×
模态框(Modal)标题
在这里添加一些文本
Close
Close
Submit
Cancel
Confirm
×
模态框(Modal)标题
×
Journal
Article
Figure
Search
EN
中文
Home
About Journal
About Journal
Indexed in
Awards
Editorial Board
Guide for Authors
Browse
Current Issue
Online First
Archive
Highlights
Topic
Archive by Subject
Most Viewed
Most Download
Most Cited
E-mail Alert
RSS
Subscribe
Advertisement
Contact us
EN
中文
Figure/Table detail
Evolution Characteristics and Obstacle Factors of Ecological Efficiency of Counties in the Fenhe River Basin from the Perspective of High-quality Development
SHI Lijiang, LI Qianjin, XUE Yaozu, ZHANG Xiaolong, WANG Mengyu, WANG Shengyun
Economic geograph
, 2025, 45(
8
): 62-72. DOI:
10.15957/j.cnki.jjdl.2025.08.007
指标类型
一级指标
二级指标
投入指标
资本要素
社会固定资产投资总额(万元)
公共财政支出(万元)
人力资源
年末总人口(人)
能源消耗
能源消耗指数
土地资源
粮食作物耕种面积(hm
2
)
产出指标
期望产出
高质量发展指数
非期望产出
PM
2.5
浓度(mg/m³)
CO
2
排放(t)
Tab.1
Evaluation index system for eco-efficiency of counties
Other figure/table from this article
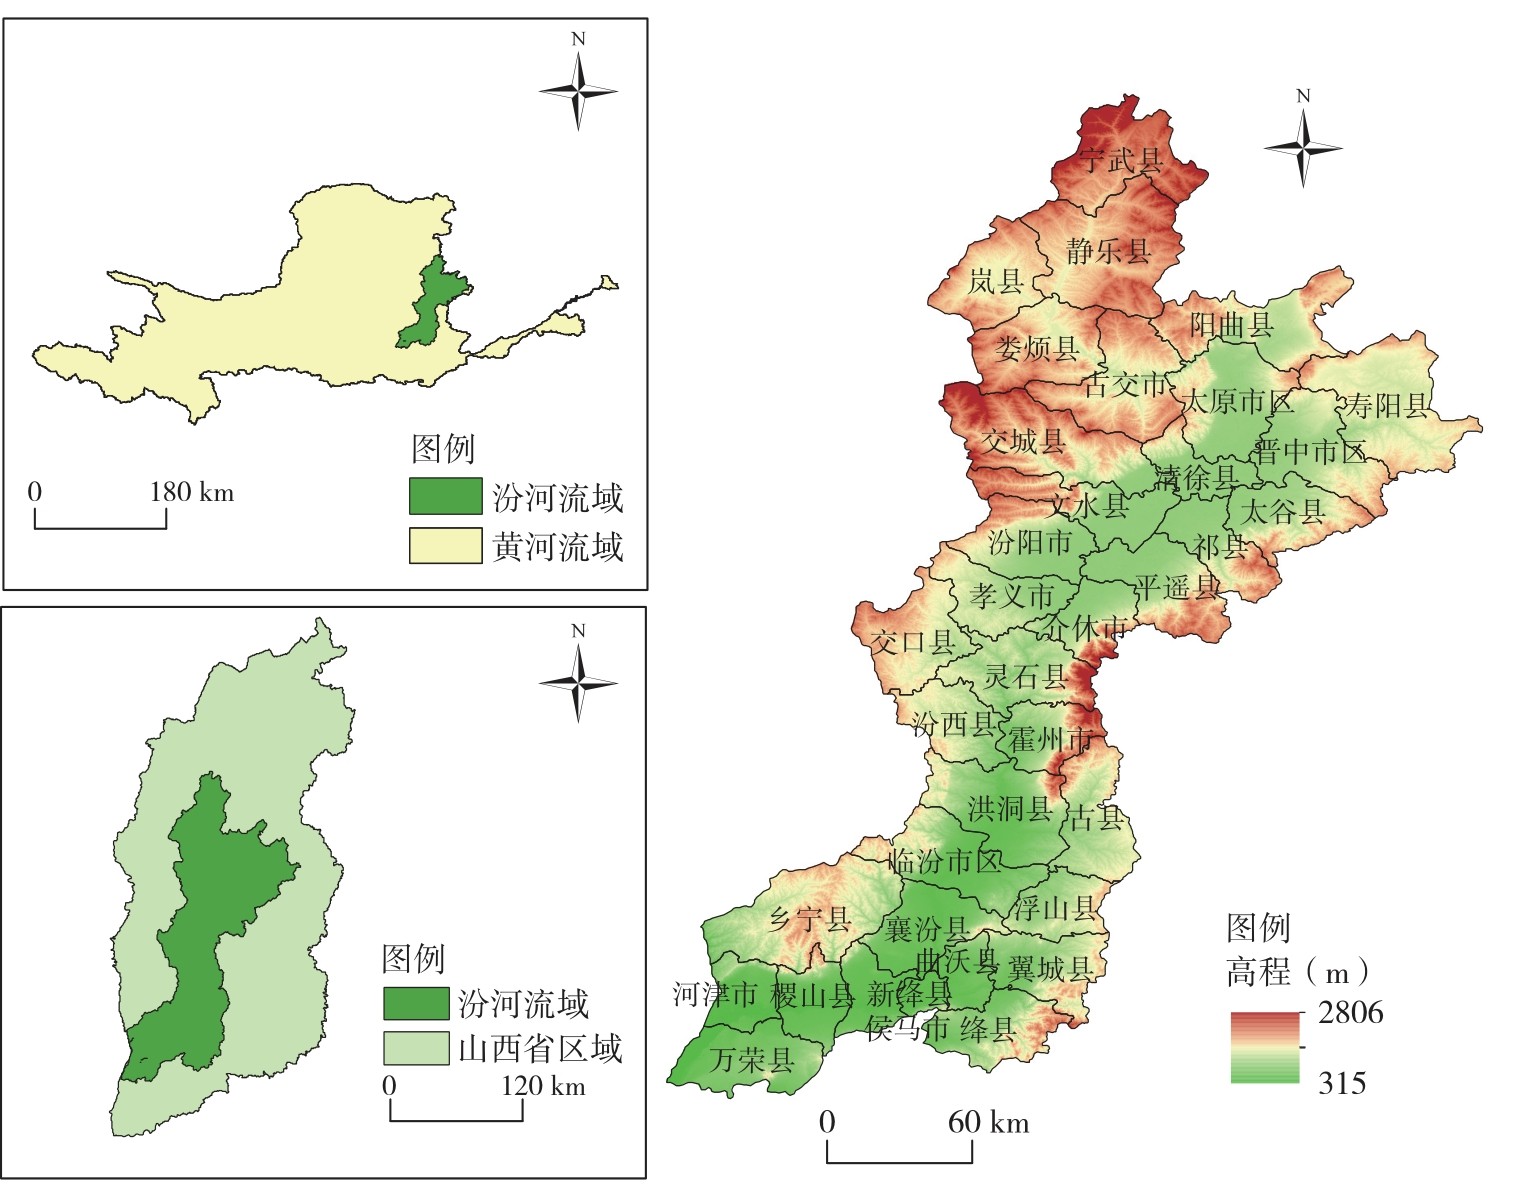
Fig.1
Location and elevation distribution of the Fen River Basin research area
Tab.2
Evaluation index system for high-quality development of counties
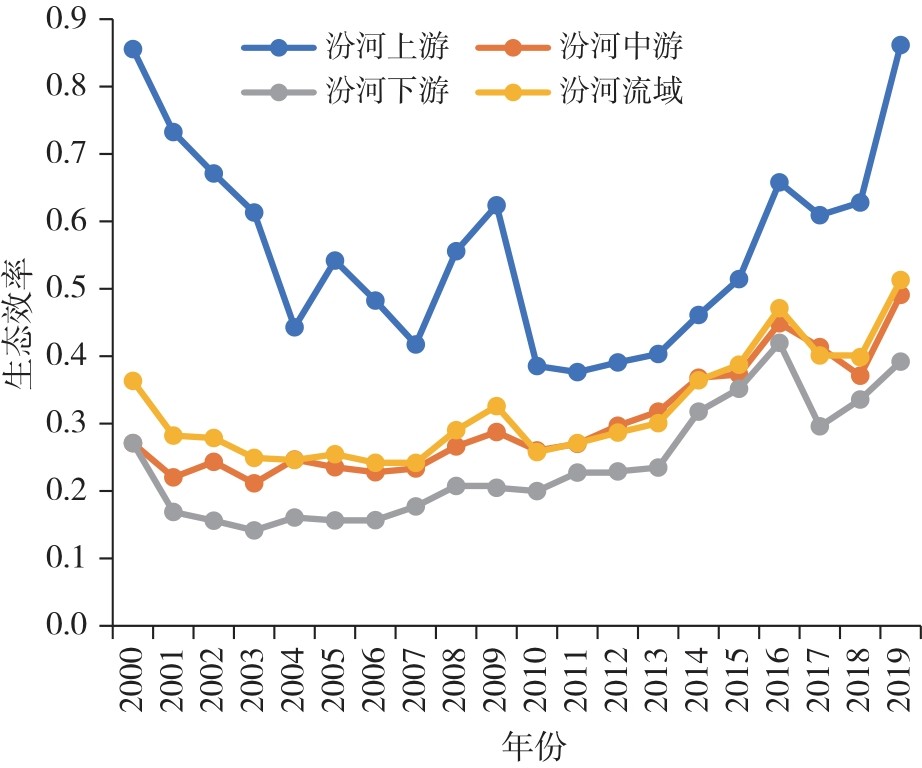
Fig.2
The changing trend of ecological efficiency in Fenhe River Basin from 2000 to 2019
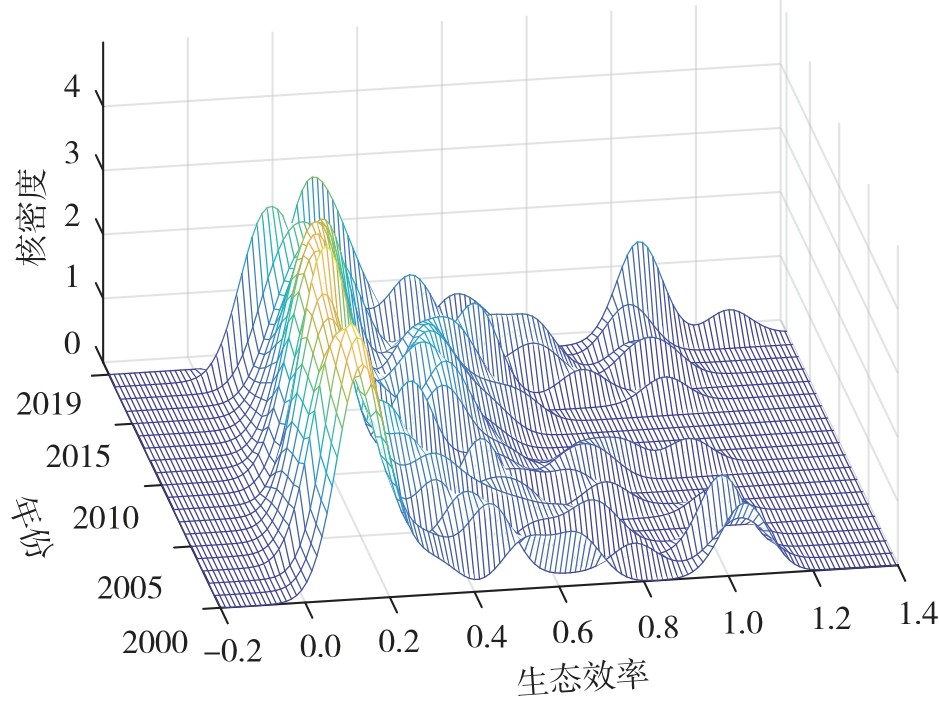
Fig.3
Kernel density map of ecological efficiency of counties in Fenhe River Basin from 2000 to 2019
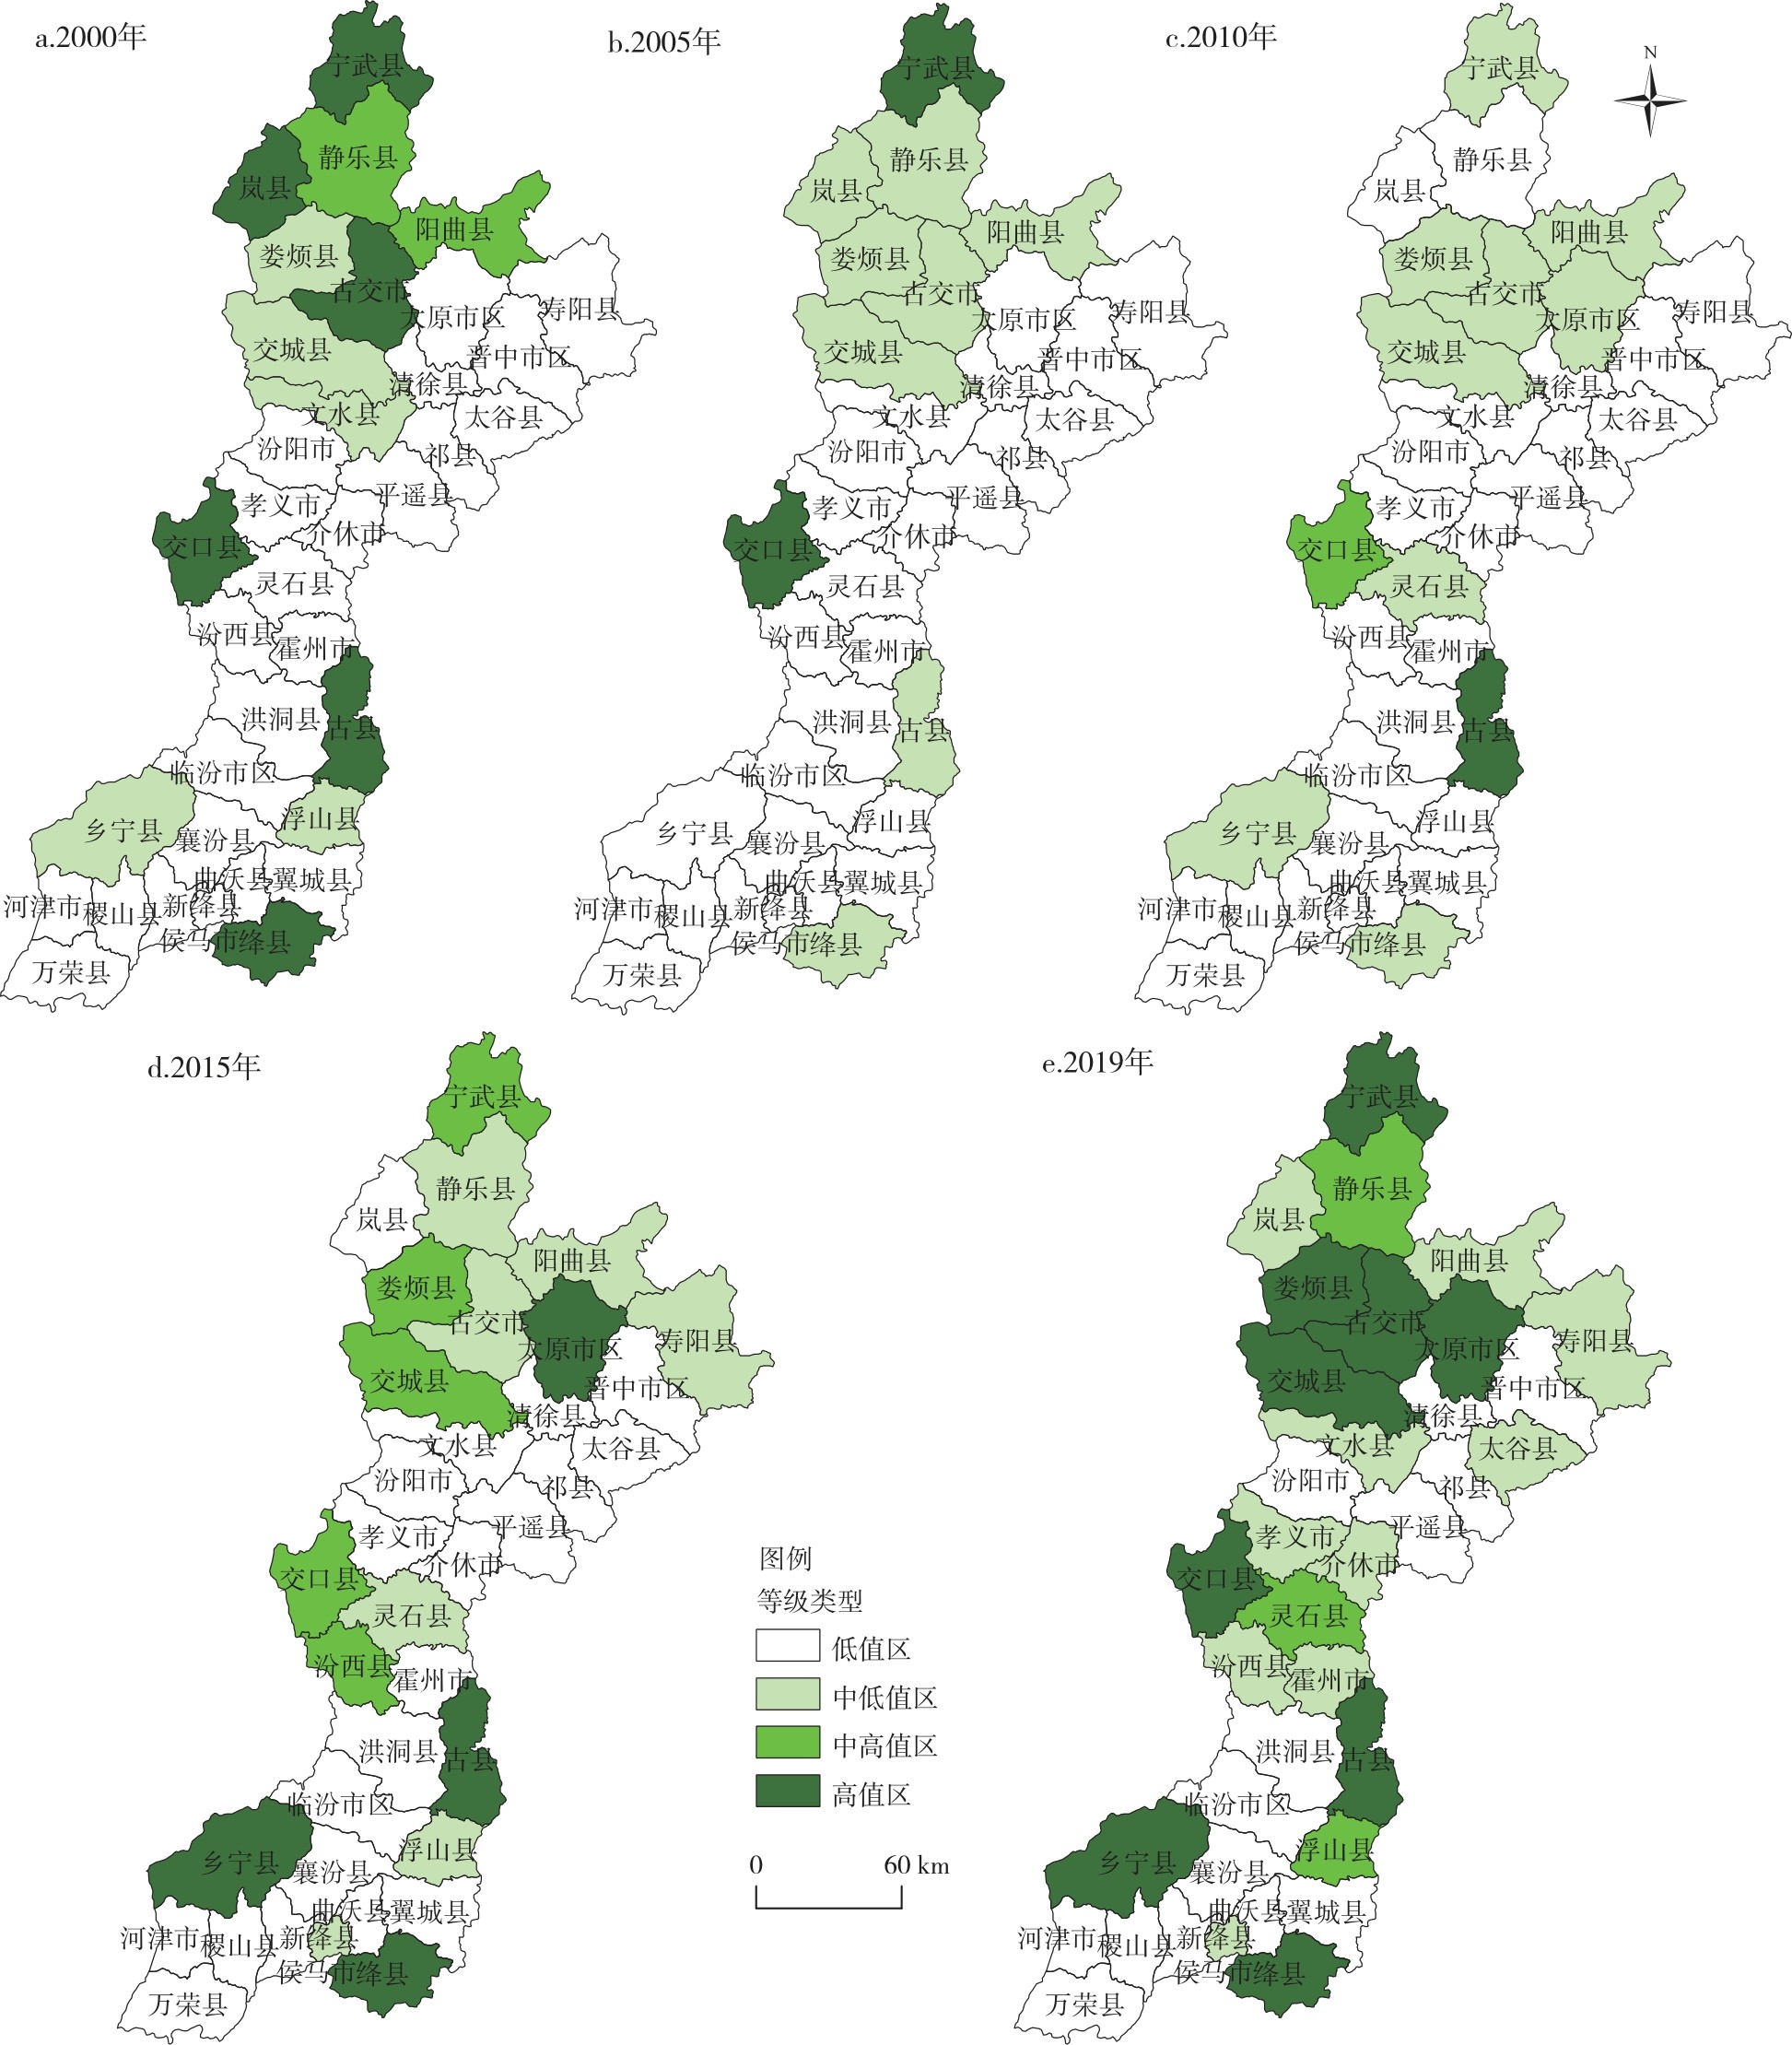
Fig.4
The spatial distribution pattern of ecological efficiency of counties in Fenhe River Basin from 2000 to 2019
Tab.3
Moran's
I
Index of ecological-efficiency of counties in Fenhe River Basin from 2000 to 2019
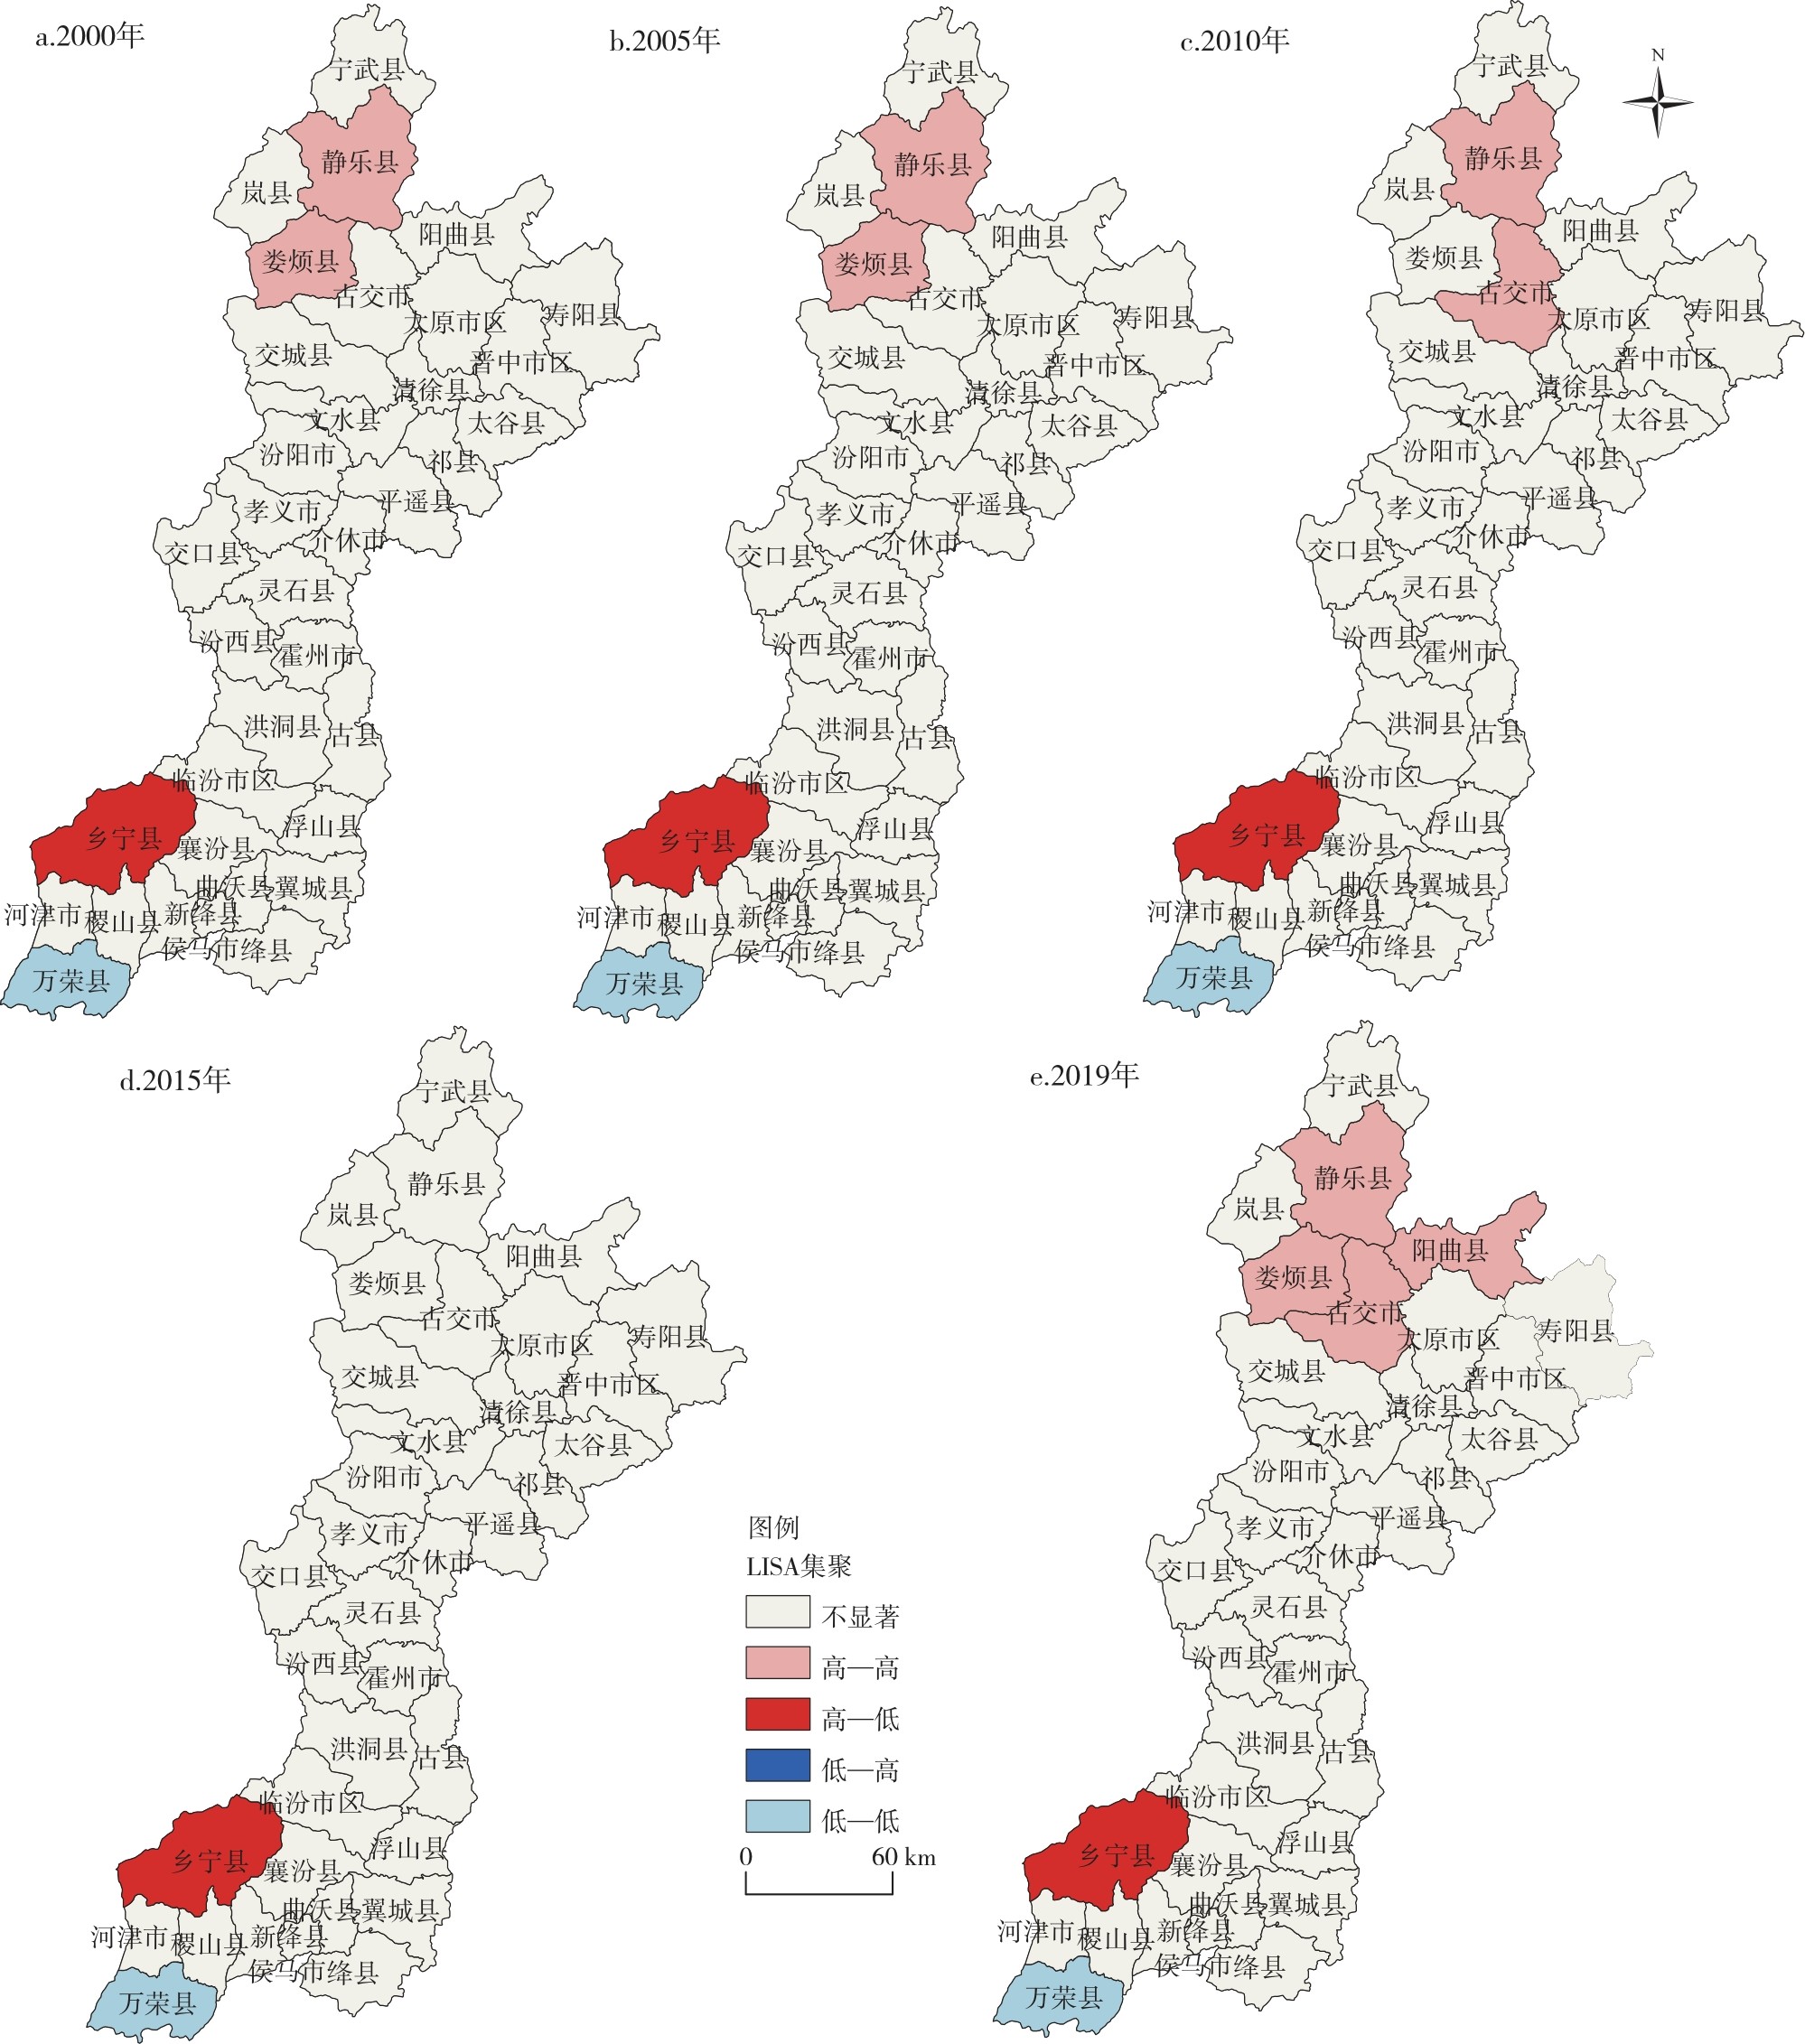
Fig.5
LISA Cluster map of ecological efficiency of counties in Fenhe River Basin from 2000 to 2019
Tab.4
The main obstacles to ecological efficiency of counties in Fen River Basin from 2000 to 2019 (%)
Tab.5
Markov transfer probability matrix of ecological efficiency of counties in Fenhe River Basin from 2000 to 2019
Tab.6
Spatial markov transfer probability matrix of ecological efficiency of counties in Fenhe River Basin from 2000 to 2019
Tab.7
Prediction of the trend of ecological efficiency of counties in Fenhe River Basin