
中国县域要素集散能力格局及多维动态演进
|
曾德源(1999—),男,博士研究生,研究方向为经济地理与区域发展。E-mail:zdysufe@163.com |
收稿日期: 2025-04-18
修回日期: 2025-09-12
网络出版日期: 2026-02-12
基金资助
国家社会科学基金一般项目(23BJL004)
上海财经大学研究生创新基金资助项目(CXJJ-2025-312)
海南省哲学社会科学重点实验室成果
Spatial Pattern and Multidimensional Dynamic Evolution of County-level Factor Agglomeration-diffusion Capacity in China
Received date: 2025-04-18
Revised date: 2025-09-12
Online published: 2026-02-12
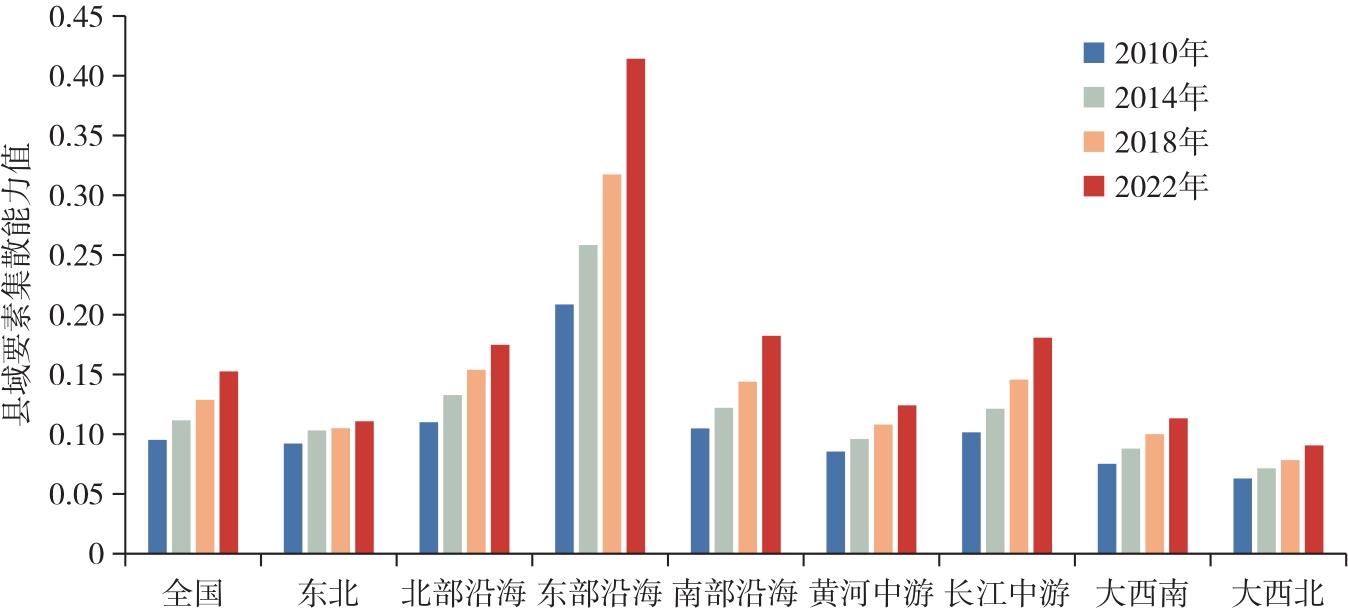
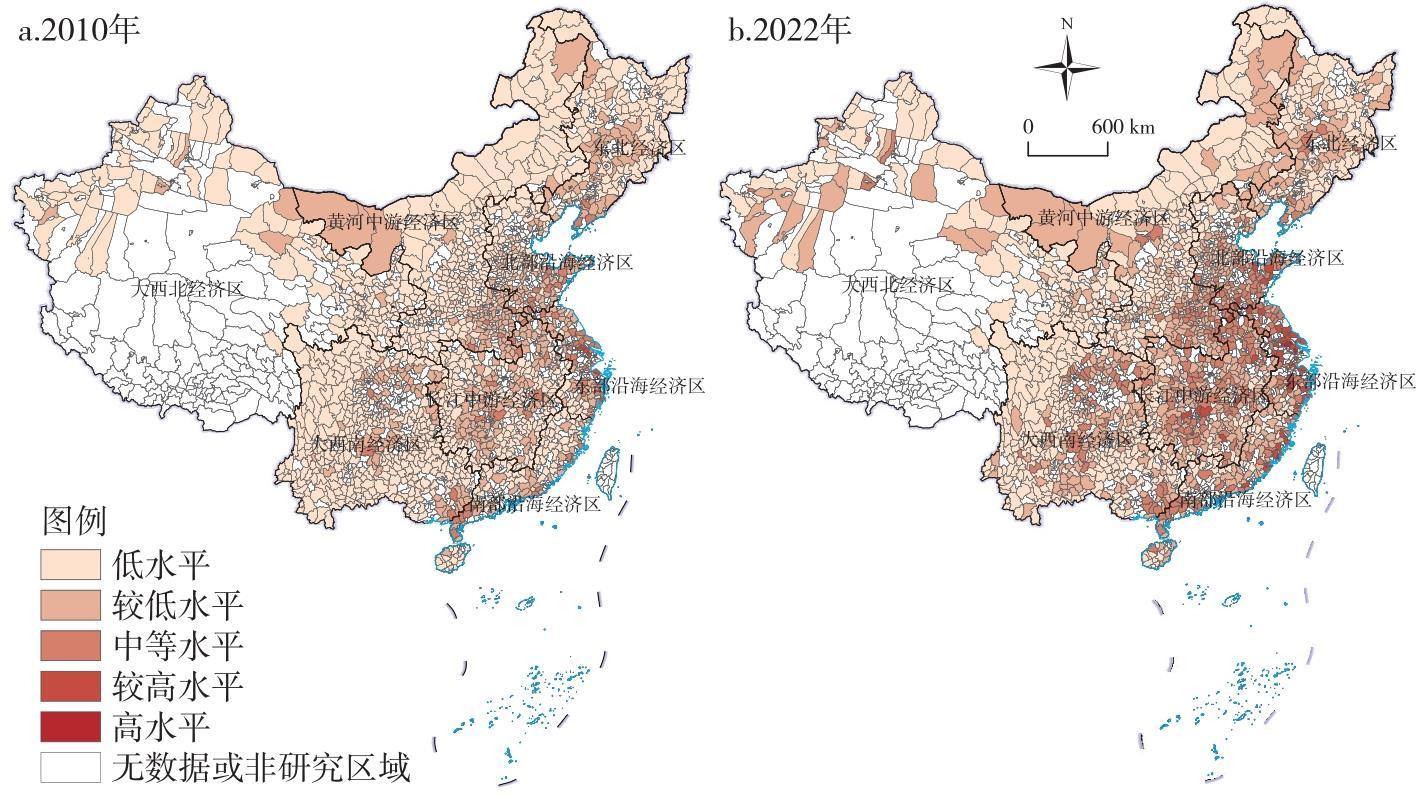
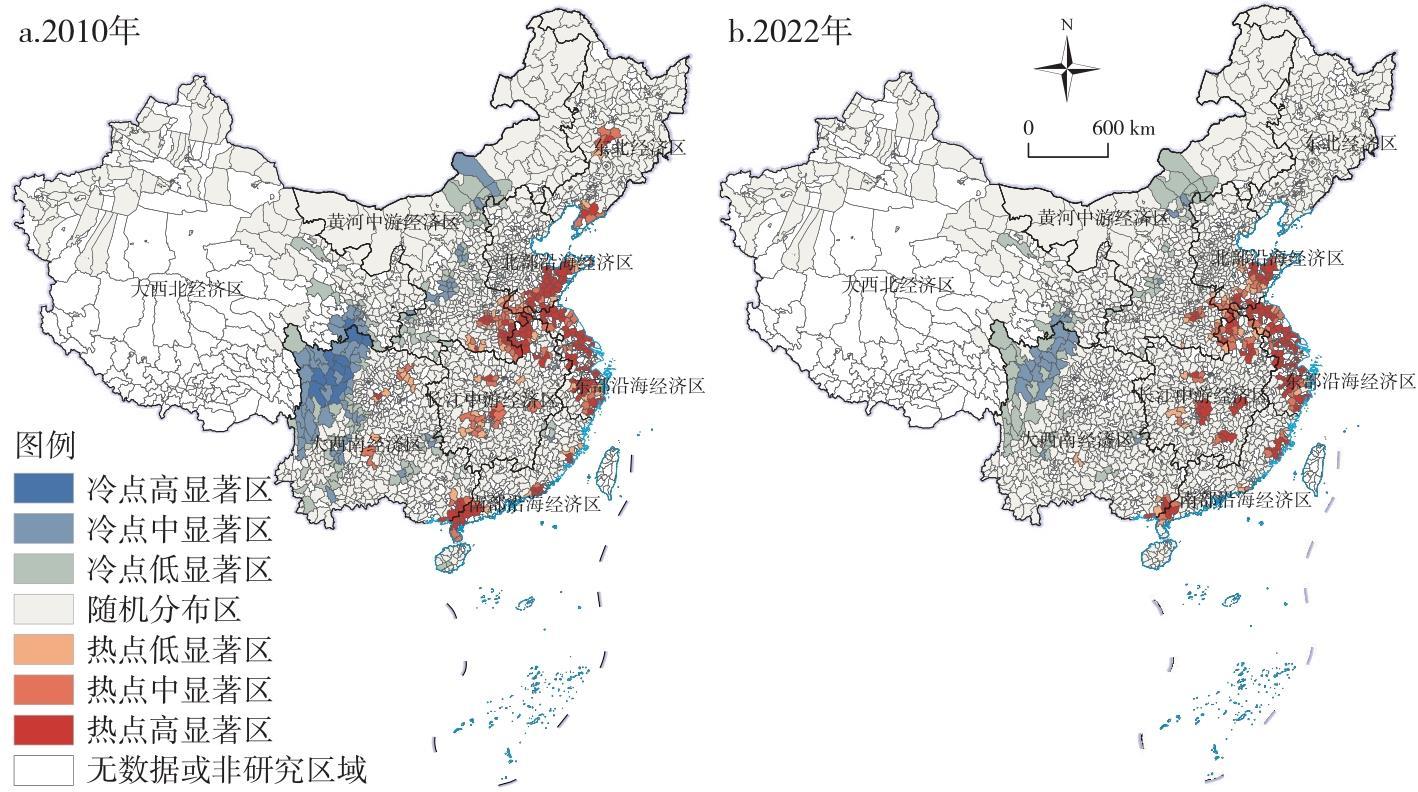
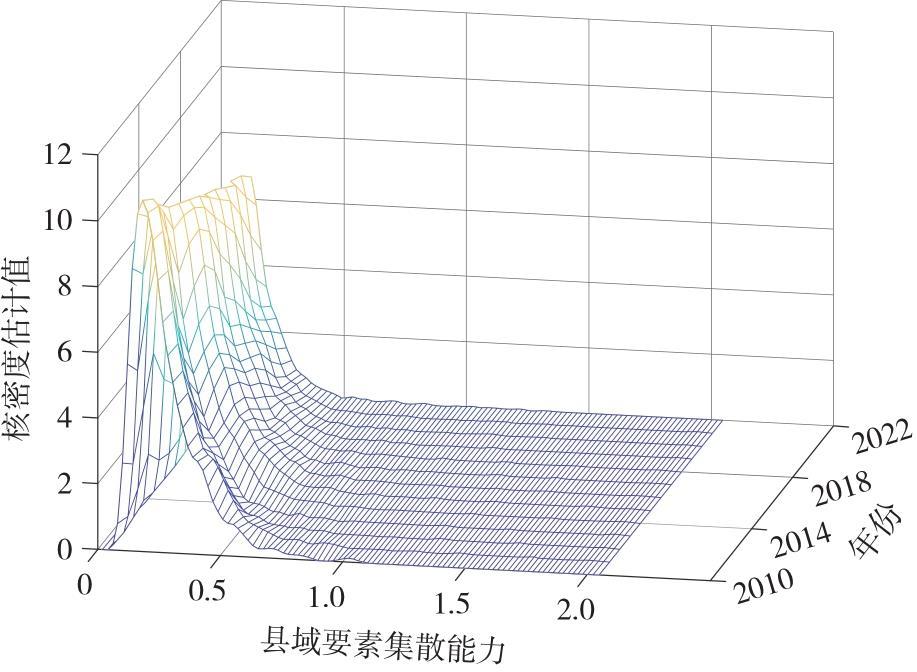
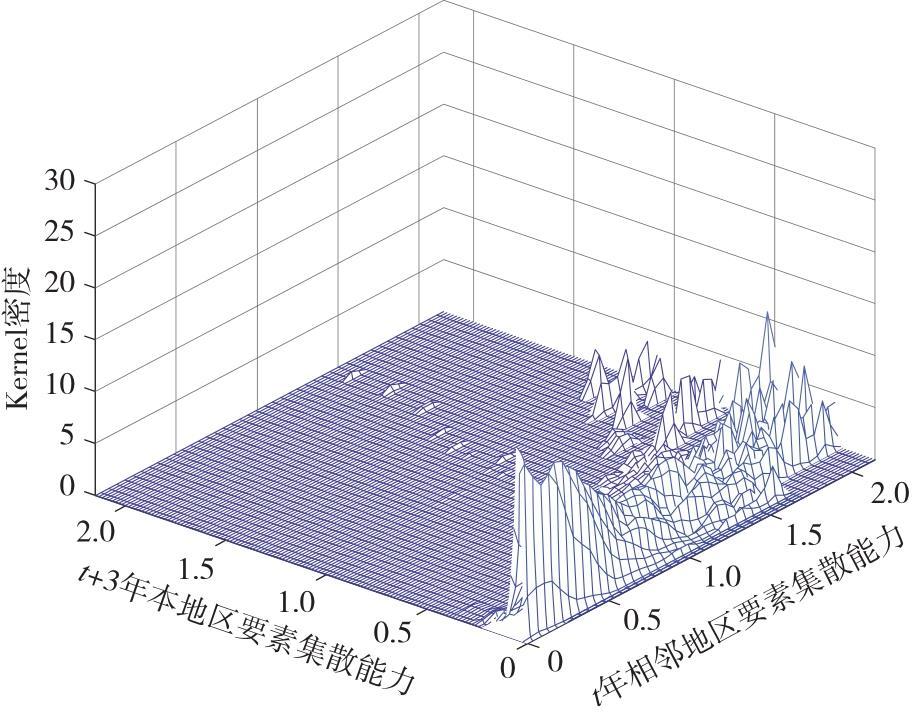
县域要素集散能力是赋能城乡融合发展的重要驱动力。文章综合运用加速遗传算法投影寻踪模型(RAGA-PPC)、Kernel密度估计和Markov链等方法,探究了2010—2022年中国1735个县域要素集散能力的格局及多维动态演进特征。研究发现:①县域要素集散能力整体呈稳定上升趋势,八大经济区之间存在显著梯度差异,东部沿海经济区持续领先,而东北经济区发展动力相对不足。②在空间分布上,县域要素集散能力呈现“核心—边缘”结构,热点区稳定集中于沿海和长江中游经济区,冷点区则主要分布在黄河中游和大西南经济区,且范围逐渐缩小。③县域要素集散能力的总体差异呈扩大趋势,区域间差异为主要来源,其中东北经济区与其他经济区的差异更为显著,而大西北经济区内部差异最小。④要素集散能力具有较强稳定性,且相邻县域间存在长期的空间影响。随着时间推移,“低—低”集聚现象逐渐缓解,向上流动趋势增强。其中高水平县域对低水平县域的虹吸效应明显,而对中等及其他水平县域则发挥辐射带动作用。研究结论为优化县域要素配置、推动城乡融合发展提供了理论依据与决策参考。
曾德源 , 郭庆宾 , 彭艳清 . 中国县域要素集散能力格局及多维动态演进[J]. 经济地理, 2026 , 46(1) : 24 -33 . DOI: 10.15957/j.cnki.jjdl.2026.01.003
County-level factor agglomeration-diffusion capacity is a key driver for advancing urban-rural integration development. Integrating the methods of real-coded accelerating genetic algorithm and projection pursuit clustering model (RAGA-PPC), kernel density estimation, and Markov chain, this study examines the spatial pattern and multidimensional dynamic evolution of factor agglomeration-diffusion capacity across 1735 county-level units in China in 2010-2022. The results show that: 1) County-level factor agglomeration-diffusion capacity shows the steady upward trend. There are significant gradient differences among eight comprehensive economic zones, the eastern coastal economic zone remains persistently at the forefront, whereas the northeastern economic zone exhibits relatively weak development. 2) Factor agglomeration-diffusion capacity displays a clear core-periphery configuration: hotspot areas are stably concentrated in the coastal economic zones and the economic zone of the middle reaches of the Yangtze River, while coldspot areas are primarily located in the economic zone of middle reaches of the Yellow River and the greater southwestern economic zone, with their spatial extent gradually contracting. 3) The overall disparities of factor agglomeration-diffusion capacity continue to widen, with interregional differences constituting the dominant source, the disparity between the northeastern economic zone and other economic zones is more significant, while the internal disparity within the greater northwestern economic zone is the smallest. 4) Factor agglomeration-diffusion capacity exhibits strong state persistence, and there is a long-term spatial influence among adjacent counties. Over time, the phenomenon of low-low clustering gradually eases, and the upward mobility trend strengthens. High-level counties exert a pronounced siphoning effect on low-level counties, while generating spillover-driven diffusion effects for medium-level and other counties. These findings provide theoretical foundations and policy-relevant evidence for optimizing county-level factor allocation and promoting urban-rural integration development.
表1 县域要素集散能力评价指标体系及说明Tab.1 Evaluation index system for county-level factor agglomeration-diffusion capacity and indicator description |
| 准则层 | 指标层 | 具体测算指标 | 指标属性 |
|---|---|---|---|
| 集聚能力 | 人口集聚 | 常住人口年均增长率(%) | + |
| 金融集聚 | 金融机构贷款余额/行政区土地总面积(万元/km2) | + | |
| 外资集聚 | 实际利用外资金额(万元) | + | |
| 技术集聚 | (科学技术支出/一般公共预算支出)·0.5+人均专利申请量标准化值·0.5 | + | |
| 整合能力 | 物质资本投入 | 固定资产投资/GDP(%) | + |
| 交通基础设施 | 公路里程/行政区土地总面积(km/km2) | + | |
| 产业整合基础 | 规模以上工业企业数(家) | + | |
| 公共服务供给 | 每千人医疗机构床位数(张/千人) | + | |
| 配置能力 | 财政配置 | 财政支出/GDP(%) | + |
| 教育配置 | 普通中小学在校生数/普通中小学专任教师数 | - | |
| 就业配置 | (第二产业+第三产业)就业人数/总就业人数(%) | + | |
| 收入配置 | 城镇居民收入/农村居民收入 | - | |
| 扩散能力 | 市场扩散 | 社会消费品零售总额(万元) | + |
| 土地扩散 | 建成区面积/夜间灯光亮度 | + | |
| 物流扩散 | 邮政业务总量(万元) | + | |
| 信息扩散 | 互联网用户数(户) | + |
表2 2010—2022年中国及八大综合经济区县域要素集散能力的总体差异和组内差异演变Tab.2 Evolution of overall and within-zone disparities in county-level factor agglomeration-diffusion capacity in China and eight comprehensive economic zones, 2010-2022 |
| 年份 | 总体 | 区域内差异 | |||||||
|---|---|---|---|---|---|---|---|---|---|
| 东北 | 北部沿海 | 东部沿海 | 南部沿海 | 黄河中游 | 长江中游 | 大西南 | 大西北 | ||
| 2010 | 0.3185 | 0.3268 | 0.2753 | 0.3308 | 0.2564 | 0.2449 | 0.2909 | 0.2942 | 0.2076 |
| 2011 | 0.3186 | 0.3322 | 0.2794 | 0.3353 | 0.2571 | 0.2488 | 0.2928 | 0.2967 | 0.2088 |
| 2012 | 0.3225 | 0.3395 | 0.2839 | 0.3352 | 0.2522 | 0.2505 | 0.2950 | 0.2981 | 0.2060 |
| 2013 | 0.3279 | 0.3417 | 0.2953 | 0.3345 | 0.2555 | 0.2526 | 0.2913 | 0.2989 | 0.2096 |
| 2014 | 0.3313 | 0.3402 | 0.2969 | 0.3335 | 0.2576 | 0.2501 | 0.2953 | 0.3007 | 0.2146 |
| 2015 | 0.3354 | 0.3433 | 0.2986 | 0.2607 | 0.3345 | 0.2469 | 0.2994 | 0.3051 | 0.2171 |
| 2016 | 0.3405 | 0.3517 | 0.3002 | 0.2616 | 0.3362 | 0.2427 | 0.3052 | 0.3038 | 0.2185 |
| 2017 | 0.3459 | 0.3564 | 0.3022 | 0.2626 | 0.3451 | 0.3086 | 0.2440 | 0.3054 | 0.2214 |
| 2018 | 0.3463 | 0.3450 | 0.2971 | 0.2626 | 0.3464 | 0.3093 | 0.2454 | 0.3077 | 0.2237 |
| 2019 | 0.3473 | 0.3454 | 0.2683 | 0.3505 | 0.2874 | 0.3134 | 0.2353 | 0.3062 | 0.2287 |
| 2020 | 0.3513 | 0.3466 | 0.3548 | 0.2703 | 0.2856 | 0.3129 | 0.2378 | 0.3072 | 0.2308 |
| 2021 | 0.3611 | 0.3537 | 0.3710 | 0.2792 | 0.2927 | 0.3135 | 0.3087 | 0.2461 | 0.2411 |
| 2022 | 0.3713 | 0.3606 | 0.3882 | 0.2884 | 0.3002 | 0.3149 | 0.3117 | 0.2562 | 0.2517 |
| 均值 | 0.3398 | 0.3449 | 0.3086 | 0.3004 | 0.2928 | 0.2776 | 0.2810 | 0.2943 | 0.2215 |
| 趋势 | 上升 | 上升 | 上升 | 下降 | 上升 | 上升 | 上升 | 下降 | 上升 |
表3 中国八大综合经济区县域要素集散能力的区域间差异Tab.3 Inter-zone disparities in county-level factor agglomeration-diffusion capacity between eight comprehensive economic zones in China |
| 区域间 | 均值 | 年均增长率(%) | 区域间 | 均值 | 年均增长率(%) |
|---|---|---|---|---|---|
| 1和2 | 0.4276 | 1.83 | 3和5 | 0.3081 | 1.01 |
| 1和3 | 0.4396 | 0.70 | 3和6 | 0.3168 | 0.76 |
| 1和4 | 0.4396 | 1.18 | 3和7 | 0.3324 | 0.01 |
| 1和5 | 0.4994 | 2.20 | 3和8 | 0.3522 | 1.25 |
| 1和6 | 0.5174 | 2.03 | 4和5 | 0.3008 | 2.29 |
| 1和7 | 0.5395 | 1.39 | 4和6 | 0.3108 | 1.76 |
| 1和8 | 0.5953 | 1.42 | 4和7 | 0.3264 | 0.85 |
| 2和3 | 0.3086 | 0.99 | 4和8 | 0.3444 | 2.01 |
| 2和4 | 0.3037 | 2.22 | 5和6 | 0.2833 | 1.25 |
| 2和5 | 0.3154 | 2.86 | 5和7 | 0.2938 | 0.27 |
| 2和6 | 0.3257 | 2.26 | 5和8 | 0.2856 | 1.23 |
| 2和7 | 0.3434 | 1.34 | 6和7 | 0.2917 | -0.26 |
| 2和8 | 0.3668 | 2.07 | 6和8 | 0.2774 | 0.56 |
| 3和4 | 0.3004 | -0.08 | 7和8 | 0.2744 | 0.10 |
注:1~8分别表示东北、北部沿海、东部沿海、南部沿海、黄河中游、长江中游、大西南和大西北综合经济区。 |
表4 中国县域要素集散能力的传统Markov转移概率矩阵Tab.4 Conventional Markov transition probability matrix for county-level factor agglomeration-diffusion capacity in China |
| 时间跨度T年 | 类别 | 低 | 较低 | 中等 | 较高 | 高 |
|---|---|---|---|---|---|---|
| T3 | 低 | 0.7817 | 0.2178 | 0.0005 | 0.0000 | 0.0000 |
| 较低 | 0.0081 | 0.6719 | 0.3168 | 0.0033 | 0.0000 | |
| 中等 | 0.0006 | 0.0127 | 0.6773 | 0.3069 | 0.0026 | |
| 较高 | 0.0000 | 0.0015 | 0.0162 | 0.7214 | 0.2610 | |
| 高 | 0.0000 | 0.0000 | 0.0003 | 0.0102 | 0.9894 | |
| T5 | 低 | 0.6688 | 0.3240 | 0.0072 | 0.0000 | 0.0000 |
| 较低 | 0.0051 | 0.4992 | 0.4735 | 0.0206 | 0.0017 | |
| 中等 | 0.0000 | 0.0088 | 0.5062 | 0.4733 | 0.0117 | |
| 较高 | 0.0000 | 0.0022 | 0.0194 | 0.5607 | 0.4176 | |
| 高 | 0.0000 | 0.0000 | 0.0000 | 0.0113 | 0.9887 |
| [1] |
郭庆宾, 马梦瑶, 程叶青. 海南自由贸易港城乡融合发展水平的时空特征及其驱动机理[J]. 经济地理, 2024, 44(12):62-71.
|
| [2] |
赵美风, 闫玘娇, 杨振, 等. 2000—2020年中国就近城镇化区域差异分解与趋同格局[J]. 地理科学进展, 2024, 43(12):2395-2412.
|
| [3] |
黄世臻, 马施婷, 刘玉亭, 等. “依附”视域下县域乡村生活空间特征及其影响因素——基于广州市增城区的实证研究[J]. 地理科学进展, 2025, 44(3):568-582.
|
| [4] |
|
| [5] |
|
| [6] |
崔树强, 周国华, 戴柳燕, 等. 基于地理学视角的城乡融合发展研究进展与展望[J]. 经济地理, 2022, 42(2):104-113.
|
| [7] |
周慧, 方城钧. 城乡融合发展的科学内涵与内在逻辑[J]. 财贸研究, 2023, 34(9):17-23.
|
| [8] |
罗必良, 耿鹏鹏. 理解县域内的城乡融合发展[J]. 南京农业大学学报(社会科学版), 2023, 23(1):16-28.
|
| [9] |
方创琳. 城乡融合发展机理与演进规律的理论解析[J]. 地理学报, 2022, 77(4):759-776.
|
| [10] |
曹萍, 古智猛. 以县域为重要切入点进一步推进城乡融合发展:生成逻辑、核心要义与实践指向[J]. 社会科学研究, 2024(6):39-44.
|
| [11] |
徐勇. 以协同治理推进城乡融合发展[J]. 人民论坛·学术前沿, 2024(21):13-19.
|
| [12] |
刘守英, 龙婷玉. 城乡融合理论:阶段、特征与启示[J]. 经济学动态, 2022(3):21-34.
|
| [13] |
肖冬利, 肖锐, 班琦. 金融资源在城市群的空间集聚与扩散效应:基于新经济地理模型的分析[J]. 现代财经(天津财经大学学报), 2025, 45(2):39-54.
|
| [14] |
李玉文, 侯新烁, 李五荣. 人口双向集散对县域城镇化的影响及其空间梯度[J]. 经济地理, 2021, 41(9):91-102.
|
| [15] |
王腾飞, 谷人旭, 马仁锋, 等. “集聚—扩散”视角下中国区域创新极及其知识溢出区位[J]. 经济地理, 2021, 41(5):11-18,185.
|
| [16] |
张玉梅, 吴先明, 高厚宾. 资源“集聚”与“辐射”视角下国际创新中心的成长机制研究——以粤港澳大湾区为例[J]. 中国工业经济, 2022(11):97-115.
|
| [17] |
段德忠, 金红. 中国城市绿色技术扩散的时空过程与形成机制[J]. 地理学报, 2023, 78(8):2001-2018.
|
| [18] |
唐昭沛, 吴威, 郭嘉颖, 等. 基于城市产业结构特征的高铁生产性服务业集散效应——以长三角城市群为例[J]. 地理研究, 2021, 40(8):2188-2203.
|
| [19] |
孙铁山, 李国平, 卢明华. 京津冀都市圈人口集聚与扩散及其影响因素——基于区域密度函数的实证研究[J]. 地理学报, 2009, 64(8):956-966.
|
| [20] |
|
| [21] |
毕秀晶, 宁越敏. 长三角大都市区空间溢出与城市群集聚扩散的空间计量分析[J]. 经济地理, 2013, 33(1):46-53.
|
| [22] |
|
| [23] |
邓苏昊, 陈珏颖, 张鑫蕊, 等. 数字经济驱动城乡融合发展的内在机理与实证检验——来自中国275个地级市的经验证据[J]. 农业技术经济, 2024(12):68-83.
|
| [24] |
|
| [25] |
张季风. 乡村振兴视阈下的城乡融合发展:日本的实践与启示[J]. 中国农村经济, 2022(12):124-138.
|
| [26] |
雷刚. 城乡融合中的县域人口集聚式收缩:影响及应对策略[J]. 中国人口·资源与环境, 2024, 34(11):1-11.
|
| [27] |
白俊红, 张艺璇, 卞元超. 创新驱动政策是否提升城市创业活跃度——来自国家创新型城市试点政策的经验证据[J]. 中国工业经济, 2022(6):61-78.
|
| [28] |
秦蒙, 刘修岩, 胡潇男. 区域中心城市规模、市场一体化与城乡收入差距[J]. 财贸经济, 2025, 46(2):159-176.
|
| [29] |
杨孟禹, 唐宝时, 刘雅宁. 被动反应与主动选择:国家土地督察何以抑制城市扩张[J]. 中国农村经济, 2024(2):131-154.
|
| [30] |
李克乐, 刘永庆, 杨宏力. 黄河流域农业高质量发展的水平测度、地区差异及动态演进[J]. 地理科学, 2025, 45(4):795-807.
|
| [31] |
王福博, 王晓芳, 罗万云, 等. 中国城市创新驱动水平时空演化及影响因素分析[J]. 地理科学, 2025, 45(1):106-118.
|
| [32] |
贺山峰, 李铮, 冯爱青, 等. 1949—2022年登陆中国热带气旋变化特征及其影响因素[J]. 地理学报, 2025, 80(1):101-119.
|
| [33] |
曾祥静, 何彪, 马勇, 等. 长江中游城市群县域生态效率时空格局及多维动态演进[J]. 地理科学, 2023, 43(6):1088-1100.
|
| [34] |
高婧珂, 成金华, 周文潇, 等. 长江经济带绿色创新的空间异质性演化及其收敛性[J]. 经济地理, 2025, 45(3):22-31.
|
| [35] |
魏后凯, 李玏, 杨沫. 东北县域人口流失的特征、原因及应对措施[J]. 社会科学战线, 2022(8):89-95.
|
| [36] |
朴光星, 马文婷. 跨越收缩:东北人口减少县域转型发展的个案研究[J]. 社会发展研究, 2024, 11(2):209-225,246.
|
| [37] |
孙平军, 张可秋, 曹乃刚, 等. 东北区域性城市收缩的地理认知与治理逻辑[J]. 地理学报, 2024, 79(8):1918-1939.
|
/
| 〈 |
|
〉 |
