
长三角临港服务业的空间演进特征与影响因素
|
谢敏(1979—),女,博士,教授,研究方向为区域创新与产业经济。E-mail:41621545@qq.com |
收稿日期: 2024-05-07
修回日期: 2025-06-05
网络出版日期: 2025-10-10
基金资助
教育部人文社会科学基金青年课题(19YJC790155)
浙江省高校重大人文社会科学攻关计划课题(2023QN166)
Spatial Evolution Characteristics and Impact Factors of the Port Service Industry in the Yangtze River Delta
Received date: 2024-05-07
Revised date: 2025-06-05
Online published: 2025-10-10
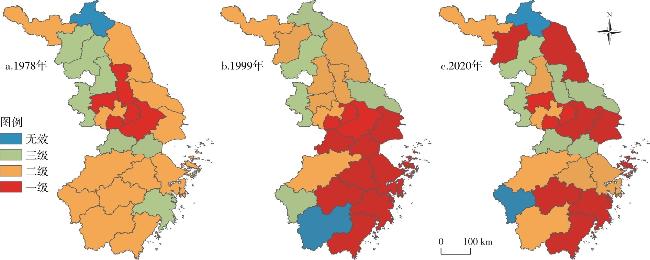
文章以物流服务业、运输服务业和金融与信息服务业三大临港服务业为研究对象,运用集聚度测算,从省域、市域以及临港服务业企业层面多尺度分析了长三角地区临港服务业空间结构演进机理,探究了区域内不同时期不同地域多层次空间演进特征。研究发现:①长三角地区临港服务业的发展呈现出逐渐增强的趋势,其中上海的临港服务业影响力相对较强,浙江和江苏紧随其后。②临港服务业与港口城市的扩散密切相关,临港服务业与港口城市互为支撑。市域的空间结构从单中心为主,再经双中心空间结构发展成为多中心的空间结构;临港服务业集聚的空间结构比较稳定,上海、苏州、杭州逐渐成为核心区域。③城市化水平、知识溢出和滞后7期均有利于临港服务业的集聚,而信息化水平和政府规模明显抑制了长三角地区临港服务业的集聚。且在临港的物流服务业、运输服务业和金融与信息服务业中也基本类似。
谢敏 , 卢凌美 . 长三角临港服务业的空间演进特征与影响因素[J]. 经济地理, 2025 , 45(8) : 132 -138 . DOI: 10.15957/j.cnki.jjdl.2025.08.014
According to the classification of port service industry,the study takes the logistics service industry,transportation service industry and financial and information service industry as the research object,and uses the theory of concentration measurement to study the evolution mechanism of the spatial structure of port service industry in the Yangtze River Delta from the perspective of the city level and port service industry enterprises,and explore the multi-level spatial evolution characteristics of different regions in different periods. The research finds that:1) The development of port service industry in the Yangtze River Delta shows a trend of gradual enhancement,it has a stronger influence of port service industry in Shanghai,followed by Zhejiang and Jiangsu. 2) The port service industry is combined with the proliferation of port cities,port service industry and port cities support each other. The spatial structure has developed from a single center to a multi center spatial structure through a dual center spatial structure at the city level. The spatial structure of cold and hot spots is relatively stable in the harbor service industry cluster,Shanghai,Suzhou and Hangzhou have gradually become the core regions. 3) The level of urbanization,knowledge spillover and the degree of agglomeration of port service industry lagging behind Phase Ⅶ are all conducive to the agglomeration of port service industry,while the level of informatization and the size of the government significantly inhibit the agglomeration of port service industry in the Yangtze River Delta. It is also basically similar in port logistics service industry,port transport service industry and port finance and information service industry.
表1 长三角地区总体临港服务业场强分区影响面积及演变(km2)Tab.1 Affected area evolution of various strong zones in the overall port service industry in the Yangtze River Delta (km2) |
| 等级 | 1978年 | 1999年 | 2020年 |
|---|---|---|---|
| 极强区 | 853 | 4521 | 10862 |
| 较强区 | 3287 | 17283 | 48905 |
| 一般区 | 8935 | 72297 | 95829 |
| 较弱区 | 298116 | 162983 | 137824 |
| 极弱区 | 83651 | 68026 | 49732 |
表2 长三角二省一市临港服务业场强分区影响面积及演变(km2)Tab.2 Division area of various strong zones of provincial port service industry (km2) |
| 年份 | 行政区 | 极强区 | 较强区 | 一般区 | 较弱区 | 极弱区 |
|---|---|---|---|---|---|---|
| 1978 | 上海港 | 189 | 372 | 963 | 4971 | 0 |
| 浙江港口 | 184 | 592 | 1373 | 59821 | 48201 | |
| 江苏港口 | 167 | 482 | 1782 | 67321 | 57211 | |
| 1999 | 上海港 | 592 | 1639 | 2893 | 1602 | 0 |
| 浙江港口 | 967 | 3782 | 16839 | 40872 | 32801 | |
| 江苏港口 | 1092 | 4792 | 27681 | 39812 | 28609 | |
| 2020 | 上海港 | 1027 | 3971 | 1320 | 823 | 0 |
| 浙江港口 | 2791 | 13820 | 29430 | 26022 | 24791 | |
| 江苏港口 | 3792 | 18981 | 37912 | 19723 | 19802 |
表3 长三角地区临港城市服务业影响区面积及演变(km2)Tab.3 Affected area and evolution of port service industry in the Yangtze River Delta (km2) |
| 港口名称 | 1978 | 1999 | 2020 |
|---|---|---|---|
| 上海港 | 89 | 378 | 2893 |
| 宁波—舟山港 | 65 | 281 | 1792 |
| 温州港 | 58 | 192 | 1027 |
| 台州港 | 47 | 128 | 836 |
| 嘉兴港 | 23 | 92 | 692 |
| 杭州港 | 51 | 189 | 1674 |
| 嘉兴内河港 | 13 | 78 | 781 |
| 湖州港 | 10 | 92 | 792 |
| 绍兴港 | 9 | 78 | 882 |
| 丽水青田港 | 11 | 67 | 1034 |
| 苏州港 | 46 | 124 | 1263 |
| 南京港 | 48 | 182 | 1635 |
| 南通港 | 23 | 101 | 1203 |
| 连云港港 | 32 | 121 | 1178 |
| 镇江港 | 28 | 82 | 983 |
| 江阴港 | 27 | 72 | 1001 |
| 徐州港 | 19 | 69 | 702 |
| 淮安港 | 12 | 73 | 962 |
| 无锡港 | 19 | 103 | 1173 |
| 泰州港 | 11 | 82 | 956 |
| 常州港 | 12 | 97 | 837 |
| 盐城港 | 9 | 93 | 952 |
| 宿迁港 | 7 | 85 | 872 |
| 扬州港 | 15 | 101 | 1183 |
表4 各因素对长三角地区临港服务业空间结构演进的模型验证结果Tab.4 Model validation of various factors on the evolution of spatial structure of port service industry in the Yangtze River Delta |
| 变量名 | 长三角地区总体 | 上海 | 浙江 | 江苏 | |||||||
|---|---|---|---|---|---|---|---|---|---|---|---|
| SLM | SEM | SLM | SEM | SLM | SEM | SLM | SEM | ||||
| CLi | 0.0037*** | 0.0049*** | 0.0045*** | 0.0041*** | 0.0019*** | 0.0025*** | 0.0032*** | 0.0036*** | |||
| ETi | 0.287*** | 0.362*** | 0.381*** | 0.401** | 0.173*** | 0.234** | 0.263*** | 0.182** | |||
| INi | -0.00004*** | -0.00003*** | -0.00002*** | -0.00002*** | -0.00003*** | -0.00004*** | -0.00001*** | -0.00002*** | |||
| Govi | -0.0021*** | -0.0072*** | -0.0061*** | -0.0058*** | -0.0034*** | -0.0046*** | -0.0031*** | -0.0048*** | |||
| S-7i | 0.813*** | 0.647*** | 0.601*** | 0.537*** | 0.481*** | 0.591*** | 0.356*** | 0.489*** | |||
| Cons. | 0.0023*** | 0.0071*** | 0.0061*** | 0.0091*** | 0.0042*** | 0.0061*** | 0.0037*** | 0.0047*** | |||
| 0.120** | - | 0.270** | - | 0.256** | - | 0.152** | - | ||||
| - | 0.213* | - | 0.183* | - | 0.273* | - | 0.165* | ||||
| R-squared | 0.528 | 0.636 | 0.491 | 0.582 | 0.632 | 0.552 | 0.589 | 0.635 | |||
表5 各因素对长三角地区临港物流服务业空间结构演进的模型验证结果Tab.5 Model validation of various factors on evolution of spatial structure of port logistics service in the Yangtze River Delta |
| 变量名 | 长三角地区整体 | 上海 | 浙江 | 江苏 | |||||||
|---|---|---|---|---|---|---|---|---|---|---|---|
| SLM | SEM | SLM | SEM | SLM | SEM | SLM | SEM | ||||
| CLi | 0.0028** | 0.0051** | 0.0031*** | 0.0021*** | 0.0011*** | 0.0023*** | 0.0031*** | 0.0032*** | |||
| ETi | -0.071 | -0.063 | -0.021*** | -0.091** | -0.013*** | -0.084** | -0.093*** | -0.073** | |||
| INi | -0.00001*** | -0.00002*** | -0.00001*** | -0.00002*** | -0.00002*** | -0.00001*** | -0.00002*** | -0.00002*** | |||
| Govi | -0.0002* | -0.0004** | -0.0007*** | -0.0002*** | -0.0009*** | -0.0004*** | -0.0009*** | -0.0008*** | |||
| S-7i | 1.980*** | 1.673*** | 1.471*** | 1.527*** | 1.663*** | 1.471*** | 1.536*** | 1.729*** | |||
| Cons. | 0.0063*** | 0.0091*** | 0.0055*** | 0.0062*** | 0.0034*** | 0.0093*** | 0.0051*** | 0.0022*** | |||
| 0.247** | 0.190** | 0.143** | 0.202** | ||||||||
| 0.182** | 0.213* | 0.193* | 0.212* | ||||||||
| R-squared | 0.692 | 0.631 | 0.491 | 0.592 | 0.612 | 0.662 | 0.591 | 0.581 | |||
表6 各因素对长三角地区临港运输服务业空间结构演进的模型验证结果Tab.6 Model validation of various factors on spatial structure evolution of transportation services in the Yangtze River Delta |
| 变量名 | 长三角地区总体 | 上海 | 浙江 | 江苏 | |||||||
|---|---|---|---|---|---|---|---|---|---|---|---|
| SLM | SEM | SLM | SEM | SLM | SEM | SLM | SEM | ||||
| CLi | 0.0017* | 0.0098* | 0.0022*** | 0.0034*** | 0.0013*** | 0.0035*** | 0.0026*** | 0.0019*** | |||
| ETi | 0.215*** | 0.378*** | 0.161*** | 0.411** | 0.223*** | 0.115*** | 0.136*** | 0.327*** | |||
| INi | -0.00003*** | -0.00001*** | -0.00002*** | -0.00001*** | -0.00003*** | -0.00002*** | -0.00001*** | -0.00002*** | |||
| Govi | -0.0035** | -0.0098*** | -0.0047** | -0.0032*** | -0.0029*** | -0.0044*** | -0.0039*** | -0.0028*** | |||
| S-7i | 0.623*** | 0.589*** | 0.521*** | 0.482*** | 0.723*** | 0.515*** | 0.469*** | 0.669*** | |||
| Cons. | 0.0068*** | 0.0043*** | 0.0051*** | 0.0045*** | 0.0044*** | 0.0082*** | 0.0067*** | 0.0031*** | |||
| 0.092** | 0.280** | 0.182** | 0.391** | ||||||||
| 0.244* | 0.183* | 0.204* | 0.282* | ||||||||
| R-squared | 0.447 | 0.481 | 0.572 | 0.467 | 0.532 | 0.687 | 0.543 | 0.682 | |||
表7 各因素对长三角地区临港金融与信息服务业空间结构演进的模型验证结果Tab.7 Model validation of various factors on the evolution of spatial structure of port financial and information service industries in the Yangtze River Delta |
| 变量名 | 长三角地区总体 | 上海 | 浙江 | 江苏 | |||||||
|---|---|---|---|---|---|---|---|---|---|---|---|
| SLM | SEM | SLM | SEM | SLM | SEM | SLM | SEM | ||||
| CLi | 0.0014** | 0.0027** | 0.0017*** | 0.002*** | 0.0018*** | 0.0026*** | 0.0019*** | 0.0016*** | |||
| ETi | 0.138*** | 0.263*** | 0.123*** | 0.286** | 0.258*** | 0.137** | 0.129** | 0.283** | |||
| INi | -0.000003*** | -0.000009*** | -0.00001*** | -0.00001*** | -0.00001*** | -0.00002*** | -0.00002*** | -0.00002*** | |||
| Govi | -0.0007 | -0.0004 | -0.0006** | -0.0002** | -0.0009** | -0.0003** | -0.0004** | -0.0008** | |||
| S-7i | 0.521*** | 0.472*** | 0.471*** | 0.392*** | 0.663*** | 0.495*** | 0.529*** | 0.569*** | |||
| Cons. | 0.0002*** | 0.0002*** | 0.0002*** | 0.0003*** | 0.0001*** | 0.0002*** | 0.0003*** | 0.0001*** | |||
| 0.271** | 0.252** | 0.204** | 0.278** | ||||||||
| 0.118* | 0.203* | 0.194* | 0.202* | ||||||||
| R-squared | 0.447 | 0.582 | 0.632 | 0.587 | 0.589 | 0.592 | 0.639 | 0.593 | |||
| [1] |
郭然, 原毅军. 互联网发展对产业协同集聚的影响及其机制研究[J]. 统计研究, 2022, 39(6):52-67.
|
| [2] |
吴思栩, 孙斌栋, 张婷麟. 互联网对中国城市内部就业分布的动态影响[J]. 地理学报, 2022, 77(6):1446-1460.
|
| [3] |
倪进峰, 隗斌贤. 长三角金融发展影响城市群空间经济演变的时空异质性分析——基于传统金融与数字金融双重维度的实证研究[J]. 浙江社会科学, 2022(5):4-16,28,155.
|
| [4] |
张亚丽, 杨洋, 项本武. 长三角城市群城乡融合发展格局演变及其影响因素[J]. 地理科学, 2024, 44(11):1955-1965.
|
| [5] |
胡艳, 张安伟, 张桅. 长三角地区城市协同发展动态演变及其网络驱动机制研究[J]. 经济体制改革, 2023(3):43-52.
|
| [6] |
邹德玲, 丛海彬, 李钰, 等. 长三角城市群内小城镇产业集聚效率时空演变与影响因素[J]. 经济地理, 2023, 43(4):73-82.
|
| [7] |
唐昭沛, 吴威, 郭嘉颖, 等. 基于城市产业结构特征的高铁生产性服务业集散效应——以长三角城市群为例[J]. 地理研究, 2021, 40(8):2188-2203.
|
| [8] |
丁宪浩, 叶立新. 江苏海洋开发绿色发展战略研究[J]. 农业现代化研究, 2009, 30(1):24-28.
|
| [9] |
陈婉婷. 港口物流服务业的发展对策研究[J]. 物流科技, 2018, 41(1):114-116.
|
| [10] |
慕光宇, 许真. 大连港口物流服务业竞争力因素分析与提升途径[J]. 黑龙江科学, 2021, 12(10):124-125.
|
| [11] |
|
| [12] |
|
| [13] |
|
| [14] |
|
| [15] |
王列辉, 陈萍, 张楠翌. 全球航运服务业的空间分布差异研究[J]. 地理学报, 2023, 78(4):913-929.
|
| [16] |
刘辉, 申玉铭, 柳坤. 中国城市群金融服务业发展水平及空间格局[J]. 地理学报, 2013, 68(2):186-198.
|
| [17] |
刘丙章, 高建华, 彭宝玉, 等. 基于POI数据的苏州市金融服务业空间格局及细分行业分布[J]. 河南大学学报(自然科学版), 2021, 51(1):29-39.
|
| [18] |
甘金磊, 宗会明. 重庆市主城区软件和信息技术服务企业空间格局演化与区位选择[J]. 热带地理, 2021, 41(6):1270-1279.
|
| [19] |
唐昭沛, 吴威, 刘玮辰, 等. 高速铁路对生产性服务业空间集聚的影响——以长三角城市群为例[J]. 地理科学进展, 2021, 40(5):746-758.
|
| [20] |
文江雪, 邓宗兵, 王定祥. 临港产业集聚对区域经济高质量发展的影响——基于知识溢出的视角[J]. 城市问题, 2021(4):62-73.
|
| [21] |
王列辉, 苏晗, 张圣. 港口城市产业转型和空间治理研究——以德国汉堡和中国上海为例[J]. 城市规划学刊, 2021(2):45-52.
|
| [22] |
李焱, 梁雪涵, 黄庆波. 海运服务贸易网络结构演变与各国角色识别[J]. 经济地理, 2024, 44(11):13-23.
|
| [23] |
沈惊宏, 周葆华, 余兆旺. 泛长三角地区城市的空间结构演变[J]. 地理研究, 2016, 35(3):482-492.
|
| [24] |
王瑞, 蒋天颖, 王帅. 宁波市港口物流企业空间格局及区位选择[J]. 地理科学, 2018, 38(5):691-698.
|
| [25] |
孙燕, 吴莉莉, 金晓斌, 等. 长三角区域一体化对城市群土地利用效率的空间协同效应[J]. 地理研究, 2024, 43(8):2104-2120.
|
| [26] |
|
| [27] |
霍鹏. 知识密集型服务业空间集聚的动态演化及驱动因素[J]. 长江流域资源与环境, 2022, 31(4):770-780.
|
/
| 〈 |
|
〉 |