
中国资源型城市产业链韧性水平测度、时空演化与区域差异
|
梁姗姗(1982—),女,博士,讲师,研究方向为产业经济与资源经济。E-mail:glxylss@163.com |
收稿日期: 2024-10-23
修回日期: 2024-12-05
网络出版日期: 2025-08-07
基金资助
中国社会科学院智库基础项目(23ZKJC053)
山西省哲学社会科学规划课题(2022YD082)
Spatial-temporal Evolution and Regional Disparities in Measuring Industrial Chain Resilience Levels of Resource-based Cities in China
Received date: 2024-10-23
Revised date: 2024-12-05
Online published: 2025-08-07
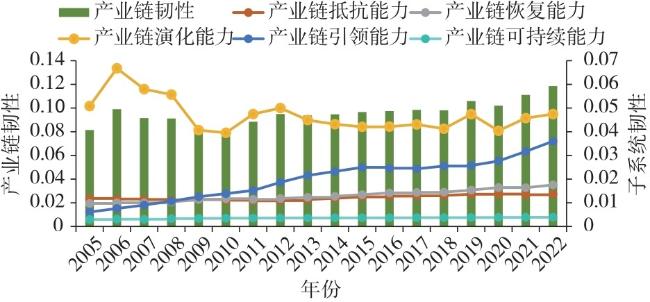
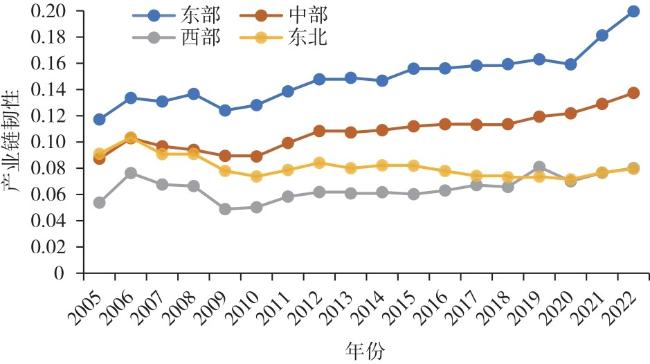
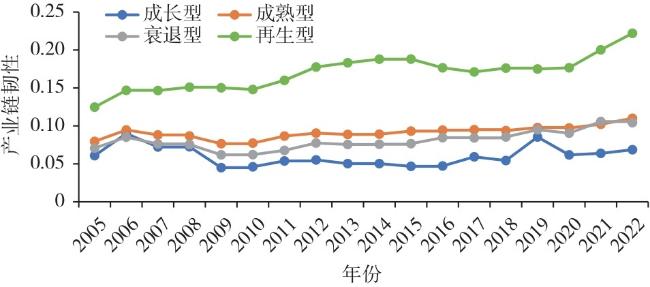
产业链韧性是刻画资源型城市经济转型能力的有效维度,测度与提升产业链韧性是精准推进资源型城市经济转型和高质量发展的重要手段。文章选取2005—2022年中国114个资源型城市数据作为样本,从抵抗能力、恢复能力、演化能力、引领能力和可持续能力五大维度构建资源型城市产业链韧性的综合评价指标体系,利用熵值法测算其产业链韧性水平,并采用Dagum基尼系数探究了不同类型资源型城市产业链韧性的区域差异及来源。研究发现:①资源型城市产业链韧性水平有所提高,但进程缓慢且总体水平偏低。②四大区域资源型城市产业链韧性水平发展不均衡,2005—2018年为“东部>中部>东北>西部地区”,2019年之后则表现出“东部>中部>东北=西部地区”的特征,且东部和中部地区差距增大,区域间差异是主要差异来源。③再生型资源型城市产业链韧性水平显著高于其他城市,且差距在不断扩大。④从空间格局看,资源型城市产业链韧性未呈现明显空间集聚性,中心城市对周边地区产业链韧性的带动作用不明显。据此,建议从优化产业结构、加强科技创新、促进绿色发展等方面提高资源型城市的产业链韧性。
梁姗姗 , 舒晨 . 中国资源型城市产业链韧性水平测度、时空演化与区域差异[J]. 经济地理, 2025 , 45(6) : 90 -99 . DOI: 10.15957/j.cnki.jjdl.2025.06.009
Industrial chain resilience serves as a pivotal metric for gauging the economic transformation adaptability of resource-based cities. Measuring and enhancing the resilience of the industrial chain emerges as a crucial strategy to effectively drive the economic transformation and foster the high-quality development of resource-based cities. Based on the data of 114 resource-based cities in China from 2005 to 2022, this paper establishes a comprehensive evaluation index system for assessing the industrial chain resilience of resource-based cities from the aspects of five dimensions: resistance ability, resilience ability, evolution ability, leadership ability, and sustainability ability. It uses the entropy method to quantify the resilience level of industrial chain and the Dagum Gini coefficient to explore the regional differences and sources of industrial chain resilience in different types of resource-based cities. It's found that: 1) The resilience level of industrial chain in resource-based cities has improved, but the process is slow and the overall level is low. 2) The development of the industrial chain resilience level in resource-based cities across the four major regions is unbalanced. From 2005 to 2018, the ranking was "eastern region > central region > northeastern region > western region". However, after 2019, the pattern shifted to "eastern region > central region > northeastern region = western region", with the gap between the eastern and central regions widening. Regional disparities remain the primary source of inequality in industrial chain resilience. 3) The resilience level of industrial chain in renewable resource-based cities is significantly higher than that of other cities, and the gap is constantly widening. 4) From the perspective of spatial pattern, the resilience level of industrial chain in resource-based cities has not shown significant spatial agglomeration, the driving effect of central cities on the industrial chain resilience in surrounding areas is not obvious. Based on the above, it is recommended to improve the industrial chain resilience of resource-based cities by optimizing the industrial structure, strengthening technological innovation, and promoting green development.
表1 资源型城市产业链韧性评价指标体系及说明Tab.1 Evaluation index system of industrial chain resilience in resource-based cities and its explanation |
| 一级指标 | 二级指标 | 三级指标 | 属性 | 权重 |
|---|---|---|---|---|
| 产业链 抵抗能力 | 资源依赖度 | 采矿业从业人数占比(%) | 反向 | 0.00011 |
| 产业结构 | 产业结构高度化(%) | 正向 | 0.04526 | |
| 产业结构多样化(%) | 正向 | 0.00536 | ||
| 产业链延伸 | 二产内部转型(%) | 正向 | 0.00633 | |
| 三产贡献率(%) | 正向 | 0.00612 | ||
| 产业链 恢复能力 | 金融协同 | 银行各项贷款余额占GDP比重(%) | 正向 | 0.01526 |
| 银行各项存款余额占GDP比重(%) | 正向 | 0.01789 | ||
| 产业集聚 | 区位熵 | 正向 | 0.01240 | |
| 人力资本 | 每万人大学生数量(个) | 正向 | 0.04209 | |
| 产业链 演化能力 | 创新辐射 | 技术创新度数中心度 | 正向 | 0.09368 |
| 技术创新中间中心度 | 正向 | 0.04716 | ||
| 技术创新接近中心度 | 正向 | 0.24212 | ||
| 创新能力 | 发明专利授权数(个) | 正向 | 0.14053 | |
| 产业数智 | 互联网普及率(%) | 正向 | 0.04034 | |
| 产业链 引领能力 | 高端引领力 | 高新区工业总产值占GDP比重(%) | 正向 | 0.22451 |
| 链条控制力 | 规模以上工业企业数(个) | 正向 | 0.05456 | |
| 产业链效益 | 规模以上工业企业营业收入利润率(%) | 正向 | 0.00107 | |
| 产业链 可持续能力 | 污染排放 | 单位工业增加值SO2排放量(t/亿元) | 反向 | 0.00055 |
| 单位工业增加值固体废物排放量(t/亿元) | 反向 | 0.00008 | ||
| 能源效率 | 单位GDP耗电量(kW·h/万元) | 反向 | 0.00107 | |
| 绿色治理 | 建成区绿地覆盖率(%) | 正向 | 0.00350 |
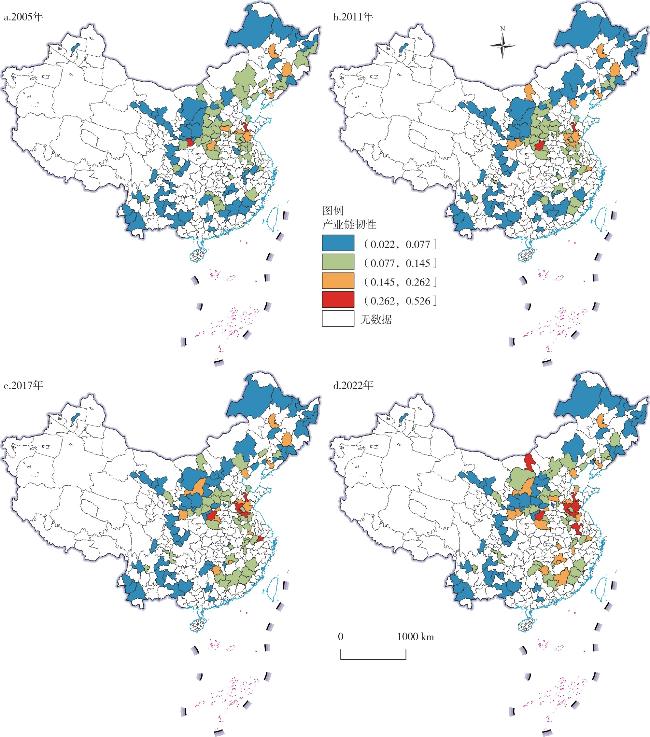
图4 中国资源型城市产业链韧性的空间分布演变注:基于自然资源部标准地图服务网站下载的审图号为GS(2024)0650号的标准地图制作,底图边界无修改。 Fig.4 Spatial distribution of industrial chain resilience level in resource-based cities |
表2 不同年份中国资源型城市产业链韧性的区间统计结果(单位:个)Tab.2 Inter-zonal statistical results of industrial chain resilience of resource-based cities in China in different years (unit) |
| 年份 | (0.022,0.077] | (0.077,0.145] | (0.145,0.262] | (0.262,0.526] |
|---|---|---|---|---|
| 2005 | 57 | 48 | 7 | 2 |
| 2011 | 62 | 39 | 11 | 2 |
| 2017 | 57 | 38 | 13 | 5 |
| 2022 | 49 | 38 | 19 | 8 |
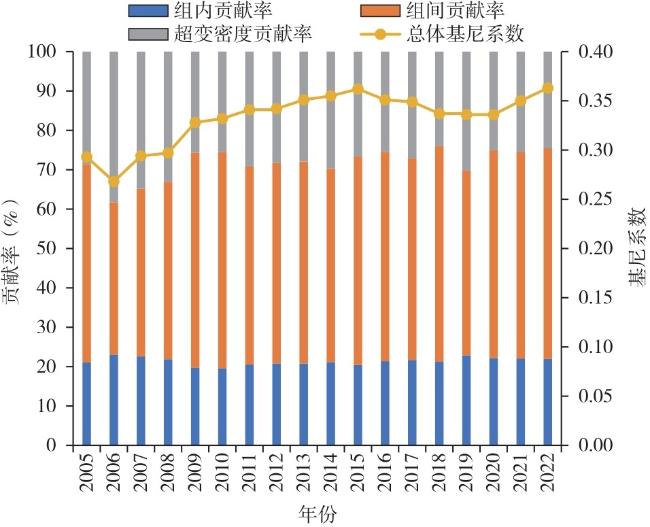
表3 2005—2022年中国资源型城市产业链韧性的Dagum基尼系数及分解Tab.3 Dagum Gini coefficient and decomposition of industrial chain resilience of resource-based cities in 2005-2022 |
| 年份 | G | 组内差异 | 组间差异 | Gt | ||||||||||
|---|---|---|---|---|---|---|---|---|---|---|---|---|---|---|
| Gw | 组内基尼系数 | Gb | 组间基尼系数 | |||||||||||
| 东部 | 中部 | 西部 | 东北 | 东部—中部 | 东部—西部 | 东部—东北 | 中部—西部 | 中部—东北 | 西部—东北 | |||||
| 2005 | 0.293 | 0.062 | 0.267 | 0.151 | 0.353 | 0.213 | 0.147 | 0.245 | 0.446 | 0.268 | 0.343 | 0.190 | 0.363 | 0.084 |
| 2006 | 0.268 | 0.062 | 0.275 | 0.135 | 0.336 | 0.223 | 0.104 | 0.247 | 0.389 | 0.280 | 0.278 | 0.185 | 0.310 | 0.103 |
| 2007 | 0.294 | 0.066 | 0.232 | 0.173 | 0.347 | 0.288 | 0.125 | 0.253 | 0.406 | 0.303 | 0.311 | 0.241 | 0.344 | 0.102 |
| 2008 | 0.297 | 0.065 | 0.259 | 0.141 | 0.361 | 0.293 | 0.134 | 0.260 | 0.427 | 0.319 | 0.307 | 0.230 | 0.356 | 0.098 |
| 2009 | 0.328 | 0.065 | 0.280 | 0.179 | 0.306 | 0.336 | 0.179 | 0.280 | 0.477 | 0.359 | 0.371 | 0.282 | 0.378 | 0.084 |
| 2010 | 0.332 | 0.065 | 0.275 | 0.182 | 0.297 | 0.357 | 0.182 | 0.288 | 0.478 | 0.386 | 0.362 | 0.303 | 0.369 | 0.085 |
| 2011 | 0.341 | 0.070 | 0.301 | 0.180 | 0.343 | 0.370 | 0.172 | 0.291 | 0.472 | 0.408 | 0.367 | 0.322 | 0.380 | 0.100 |
| 2012 | 0.342 | 0.071 | 0.316 | 0.193 | 0.329 | 0.376 | 0.174 | 0.302 | 0.466 | 0.413 | 0.358 | 0.331 | 0.374 | 0.097 |
| 2013 | 0.351 | 0.073 | 0.322 | 0.214 | 0.308 | 0.407 | 0.180 | 0.313 | 0.469 | 0.441 | 0.355 | 0.366 | 0.377 | 0.098 |
| 2014 | 0.355 | 0.075 | 0.325 | 0.229 | 0.302 | 0.428 | 0.175 | 0.316 | 0.460 | 0.451 | 0.352 | 0.384 | 0.387 | 0.105 |
| 2015 | 0.362 | 0.074 | 0.307 | 0.234 | 0.296 | 0.420 | 0.191 | 0.308 | 0.484 | 0.459 | 0.375 | 0.387 | 0.381 | 0.096 |
| 2016 | 0.351 | 0.075 | 0.299 | 0.258 | 0.293 | 0.354 | 0.186 | 0.311 | 0.469 | 0.431 | 0.371 | 0.356 | 0.337 | 0.089 |
| 2017 | 0.349 | 0.076 | 0.288 | 0.255 | 0.309 | 0.346 | 0.179 | 0.308 | 0.457 | 0.446 | 0.361 | 0.365 | 0.333 | 0.095 |
| 2018 | 0.337 | 0.072 | 0.297 | 0.258 | 0.254 | 0.320 | 0.185 | 0.314 | 0.454 | 0.442 | 0.345 | 0.350 | 0.296 | 0.081 |
| 2019 | 0.336 | 0.077 | 0.300 | 0.239 | 0.334 | 0.291 | 0.157 | 0.299 | 0.43 | 0.436 | 0.345 | 0.338 | 0.318 | 0.101 |
| 2020 | 0.336 | 0.074 | 0.303 | 0.276 | 0.267 | 0.264 | 0.177 | 0.311 | 0.441 | 0.429 | 0.358 | 0.346 | 0.268 | 0.084 |
| 2021 | 0.350 | 0.077 | 0.321 | 0.265 | 0.311 | 0.273 | 0.184 | 0.326 | 0.466 | 0.454 | 0.365 | 0.345 | 0.296 | 0.090 |
| 2022 | 0.363 | 0.08 | 0.312 | 0.285 | 0.318 | 0.271 | 0.194 | 0.335 | 0.485 | 0.469 | 0.382 | 0.356 | 0.298 | 0.089 |
| [1] |
张伟, 李航宇, 张婷. 中国制造业产业链韧性测度及其时空分异特征[J]. 经济地理, 2023, 43(4):134-143.
|
| [2] |
|
| [3] |
|
| [4] |
吴康, 宋嘉卓, 陈艺文. 人口增长与收缩对城市经济韧性的影响机制——基于产业结构和人力资本的调节效应[J]. 资源科学, 2024, 46(2):249-261.
|
| [5] |
张秀娥, 滕欣宇. 组织韧性内涵、维度及测量[J]. 科技进步与对策, 2021, 38(10):9-17.
|
| [6] |
盛朝迅. 新发展格局下推动产业链供应链安全稳定发展的思路与策略[J]. 改革, 2021 (2):1-13.
|
| [7] |
刘志彪. 产业链现代化的产业经济学分析[J]. 经济学家, 2019(12):5-13.
|
| [8] |
陈晓东, 刘洋, 周柯. 数字经济提升我国产业链韧性的路径研究[J]. 经济体制改革, 2022(1):95-102.
|
| [9] |
吕越, 邓利静. 着力提升产业链供应链韧性与安全水平——以中国汽车产业链为例的测度及分析[J]. 国际贸易问题, 2023(2):1-19.
|
| [10] |
陈晓东, 杨晓霞. 数字经济可以实现产业链的最优强度吗?——基于1987—2017年中国投入产出表面板数据[J]. 南京社会科学, 2021 (2):17-26.
|
| [11] |
贺正楚, 李玉洁, 吴艳. 产业协同集聚、技术创新与制造业产业链韧性[J]. 科学学研究, 2024, 42(3):515-527.
|
| [12] |
谷城, 张树山. 产业链韧性水平测度、区域差异及收敛性研究[J]. 经济问题探索, 2023 (6):123-139.
|
| [13] |
王泽宇, 唐云清, 韩增林, 等. 中国沿海省份海洋船舶产业链韧性测度及其影响因素[J]. 经济地理, 2022, 42(7):117-125.
|
| [14] |
朱永光, 张伍丰, 王迪, 等. 中国铜资源产业链供应链韧性评价[J]. 资源科学, 2023, 45(9):1761-77.
|
| [15] |
李虹, 邹庆. 环境规制、资源禀赋与城市产业转型研究——基于资源型城市与非资源型城市的对比分析[J]. 经济研究, 2018, 53(11):182-198.
|
| [16] |
李博, 秦欢, 孙威. 产业转型升级与绿色全要素生产率提升的互动关系——基于中国116个地级资源型城市的实证研究[J]. 自然资源学报, 2022, 37(1):186-199.
|
| [17] |
黄寰, 黄辉, 肖义, 等. 产业结构升级、政府生态环境注意力与绿色创新效率——基于中国115个资源型城市的证据[J]. 自然资源学报, 2024, 39(1):104-124.
|
| [18] |
黄林秀, 郝坚. 数字经济、创新差距和中心—外围城市经济差距——基于新经济地理的视角[J]. 改革, 2024(3):113-126.
|
| [19] |
袁航, 朱承亮. 国家高新区推动了中国产业结构转型升级吗[J]. 中国工业经济, 2018, 365(8):60-77.
|
| [20] |
林伯强. 电力消费与中国经济增长:基于生产函数的研究[J]. 管理世界, 2003(11):18-27.
|
| [21] |
干春晖, 郑若谷, 余典范. 中国产业结构变迁对经济增长和波动的影响[J]. 经济研究, 2011, 46(5):4-16,31.
|
| [22] |
夏铭璐, 张树山, 谷城. 智慧物流对产业链韧性的影响[J]. 中国流通经济, 2023, 37(9):23-33.
|
| [23] |
孙晓华, 任俊林. 资源税改革推动了城市经济增长与产业结构转型吗?[J]. 南开经济研究, 2023 (1):82-100.
|
| [24] |
|
| [25] |
蔡乌赶, 许凤茹. 中国工业韧性的测度及时空演变特征研究[J]. 经济体制改革, 2022(6):90-97.
|
| [26] |
杨丹辉, 戴魁早, 赵西三, 等. 推动中国全产业链优化升级[J]. 区域经济评论, 2021 (2):5-16.
|
| [27] |
中华人民共和国国务院. 国务院关于印发全国资源型城市可持续发展规划(2013—2020年)的通知[EB/OL]. (2013-12-03) [2024-04-20]. https://www.gov.cn/zwgk/2013-12/03/content_2540070.htm.
|
| [28] |
黄梦涵, 张卫国. 中国四类资源型城市韧性水平比较与发展策略[J]. 经济地理, 2023, 43(1):34-43.
|
| [29] |
郑紫颜, 仇方道, 张春丽, 等. 再生性资源型城市功能转型异质性及其工业结构解析[J]. 资源科学, 2020, 42(3):570-582.
|
| [30] |
刘志彪, 仝文涛. 双循环新发展格局视角下推进区域协调发展——论东北老工业基地振兴[J]. 江苏行政学院学报, 2021(1):36-43.
|
| [31] |
杨永春, 穆焱杰, 张薇. 黄河流域高质量发展的基本条件与核心策略[J]. 资源科学, 2020, 42(3):409-423.
|
| [32] |
黄若鹏, 刘海滨, 孙宇, 等. 宏观视角下黄河流域中下游经济韧性的地区差异性研究[J]. 宏观经济研究, 2022(2):155-166.
|
/
| 〈 |
|
〉 |