
新疆综合交通可达性测度及空间格局演化
|
曹开军(1987—),男,博士,教授,博士生导师,研究方向为旅游地理、旅游规划。E-mail:caokaijun@xju.edu.cn |
收稿日期: 2023-12-14
修回日期: 2024-04-21
网络出版日期: 2025-08-07
基金资助
国家自然科学基金项目(42161036)
新疆维吾尔自治区研究生科研创新项目(XJ2024G071)
Comprehensive Traffic Accessibility Measurement and Spatial Pattern Evolution Analysis in Xinjiang
Received date: 2023-12-14
Revised date: 2024-04-21
Online published: 2025-08-07
曹开军 , 商宁 . 新疆综合交通可达性测度及空间格局演化[J]. 经济地理, 2025 , 45(6) : 59 -66 . DOI: 10.15957/j.cnki.jjdl.2025.06.006
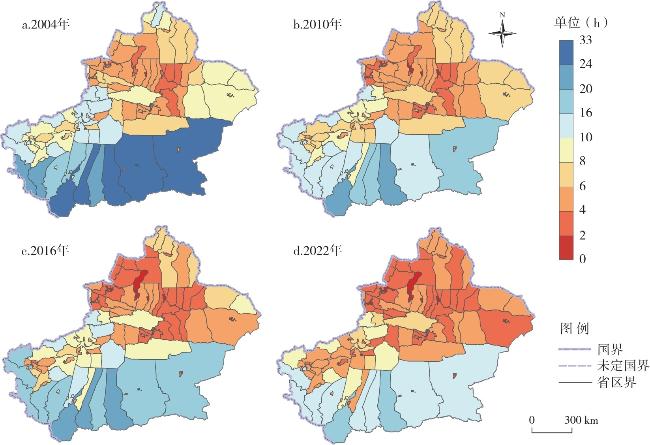
This study employs network analysis and the raster cost-distance method to systematically evaluate the spatial evolution pattern of comprehensive transportation accessibility in Xinjiang from 2004 to 2022, examining it from both global and local perspectives. The research results show that:1) The level of comprehensive transportation accessibility in Xinjiang exhibits pronounced spatial disparities, with an overall spatial distribution pattern characterized by "Northern Xinjiang > Eastern Xinjiang > Southern Xinjiang". The areas of high accessibility form an irregular annular distribution that expands outward from Urumqi City as the central point, clearly delineating a "core-periphery" structure. 2) The rate of change in accessibility over time and space varies significantly across different stages. From 2004 to 2010, and from 2016 to 2022, the rate of change in accessibility in Southern Xinjiang was generally higher than that in Northern Xinjiang. Between 2010 and 2016, there was a marked increase in the rate of change in accessibility in Eastern Xinjiang. 3)The temporal and spatial convergence effects of transportation networks across various counties and cities in Xinjiang are significant. Counties and cities with high levels of accessibility have undergone an evolutionary process from a "nodal polarized" structure to a "radial axis" pattern, and finally to a "nodal-axis interconnected" annular structure. 4)The spatial clustering characteristics of comprehensive transportation accessibility levels among counties and cities in Xinjiang are increasingly pronounced, with a clear manifestation of spatial proximity effects.
表1 地形因素高程及坡度时间成本值Tab.1 Terrain factors, elevation, and slope time cost values |
| 高程(km) | 坡度(°) | ||||||
|---|---|---|---|---|---|---|---|
| <2 | 2~3 | >3 | <10 | 10~20 | >20 | ||
| 速度(km/h) | 10 | 5 | 2 | 12 | 2 | 1 | |
| 时间成本(min) | 6 | 12 | 30 | 5 | 30 | 60 | |
表2 主要交通线路等级速度与时间成本Tab.2 Main traffic line grade speed and time cost value |
| 年份 | 道路等级 | 高铁 | 普铁 | 高速 | 国道 | 省道 | 县道 | 空白区域 |
|---|---|---|---|---|---|---|---|---|
| 2004 | 速度(km/h) | - | 70 | 100 | 80 | 60 | 40 | 5 |
| 时间成本/min | - | 0.86 | 0.60 | 0.75 | 1.00 | 1.50 | 12.00 | |
| 2010 | 速度(km/h) | - | 100 | 100 | 80 | 60 | 40 | 5 |
| 时间成本/min | - | 0.60 | 0.60 | 0.75 | 1.00 | 1.50 | 12.00 | |
| 2016 | 速度(km/h) | 250 | 120 | 120 | 80 | 60 | 40 | 5 |
| 时间成本/min | 0.24 | 0.50 | 0.50 | 0.75 | 1.00 | 1.50 | 12.00 | |
| 2022 | 速度(km/h) | 250 | 120 | 120 | 80 | 60 | 40 | 5 |
| 时间成本/min | 0.24 | 0.50 | 0.50 | 0.75 | 1.00 | 1.50 | 12.00 |
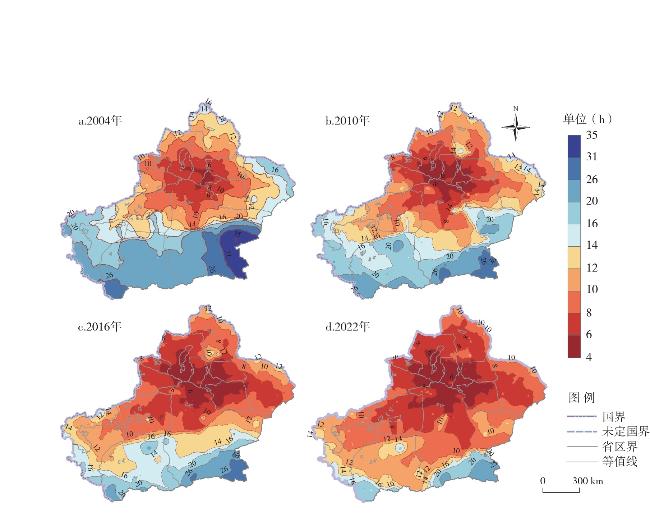
图5 新疆县市综合交通可达性空间格局演化Fig.5 Evolution of spatial patterns in comprehensive transport accessibility for Xinjiang's counties and cities |
表3 新疆县市综合交通可达性统计分析Tab.3 Statistical analysis of comprehensive transportation accessibility of counties and cities in Xinjiang |
| 等时圈 | 2004年 | 2010年 | 2016年 | 2022年 | |||||||||||
|---|---|---|---|---|---|---|---|---|---|---|---|---|---|---|---|
| 县市 数量(个) | 数量 占比(%) | 面积 占比(%) | 县市 数量(个) | 数量 占比(%) | 面积 占比(%) | 县市 数量(个) | 数量 占比(%) | 面积 占比(%) | 县市 数量(个) | 数量 占比(%) | 面积 占比(%) | ||||
| 2 h | 1 | 1.03 | 0.03 | 4 | 4.12 | 0.17 | 7 | 7.22 | 0.70 | 9 | 9.28 | 0.81 | |||
| 4 h | 11 | 11.34 | 3.61 | 20 | 20.62 | 5.35 | 36 | 29.90 | 15.02 | 45 | 46.39 | 23.76 | |||
| 8 h | 55 | 56.70 | 31.58 | 73 | 75.26 | 49.80 | 80 | 45.36 | 54.28 | 80 | 82.47 | 54.28 | |||
| 16 h | 86 | 88.66 | 61.04 | 92 | 94.85 | 77.58 | 94 | 96.91 | 92.06 | 95 | 97.94 | 94.00 | |||
| [1] |
梁宇, 郑新奇, 宋清华, 等. 中国大陆交通网络通达性演化[J]. 地理研究, 2017, 36(12):2321-2331.
|
| [2] |
郭向阳, 穆学青, 明庆忠, 等. 旅游地快速交通优势度与旅游流强度的空间耦合分析[J]. 地理研究, 2019, 38(5):1119-1135.
|
| [3] |
黄晓燕, 曹小曙, 李涛. 海南省区域交通优势度与经济发展关系[J]. 地理研究, 2011, 30(6):985-999.
|
| [4] |
宋洁华, 李敏纳, 蔡舒, 等. 海南交通可达性的测度与空间分异格局分析[J]. 地理科学, 2017, 37(10):1507-1516.
|
| [5] |
梅琳, 黄柏石, 敖荣军, 等. 长江中游城市群高速铁路可达性格局及演变[J]. 经济地理, 2018, 38(6):62-68.
|
| [6] |
阎福礼, 邹艺昭, 王世新, 等. 中国不同交通模式的可达性空间格局研究[J]. 长江流域资源与环境, 2017, 26(6):806-815.
|
| [7] |
金凤君, 陈卓. 1978年改革开放以来中国交通地理格局演变与规律[J]. 地理学报, 2019, 74(10):1941-1961.
|
| [8] |
李平华, 陆玉麒. 可达性研究的回顾与展望[J]. 地理科学进展, 2005 (3):69-78.
|
| [9] |
刘庆芳, 卢文清, 戴特奇, 等. 考虑季节性的青藏高原地区公路可达性评价[J]. 地理科学进展, 2023, 42(4):687-700.
|
| [10] |
汪德根, 孙枫. 长江经济带陆路交通可达性与城镇化空间耦合协调度[J]. 地理科学, 2018, 38(7):1089-1097.
|
| [11] |
李鲁奇, 吴启焰, 刘可文, 等. 历史视角下亚欧大陆海陆交通可达性空间格局演化[J]. 地理学报, 2020, 75(4):804-819.
|
| [12] |
邓羽, 蔡建明, 杨振山, 等. 北京城区交通时间可达性测度及其空间特征分析[J]. 地理学报, 2012, 67(2):169-178.
|
| [13] |
|
| [14] |
贾文通, 黄震方, 刘俊, 等. 高铁对区域旅游“时空压缩”效应的测度与分析——以长江经济带为例[J]. 地理研究, 2021, 40(6):1785-1802.
|
| [15] |
戴特奇, 张玉韩, 赵娟娟. 中国民用运输机场的可达性溢出效应研究[J]. 地理学报, 2013, 68(12):1668-1677.
|
| [16] |
符海月, 王妍, 张祎婷, 等. 中原城市群交通网络通达性演化及优化研究[J]. 长江流域资源与环境, 2020, 29(3):557-567.
|
| [17] |
罗金阁, 张博, 刘嗣明. 粤港澳大湾区交通可达性与旅游经济联系空间关系[J]. 经济地理, 2020, 40(10):213-220.
|
| [18] |
陈洁, 陆锋, 程昌秀. 可达性度量方法及应用研究进展评述[J]. 地理科学进展, 2007(5):100-110.
|
| [19] |
陈松林, 陈进栋, 韦素琼. 福建省综合交通可达性格局及其与制造业空间分布的关系分析[J]. 地理科学, 2012, 32(7):807-815.
|
| [20] |
黄洁, 石雯茜, 陈娱. 居民出行视角下的北京市双枢纽机场可达性研究[J]. 地球信息科学学报, 2022, 24(5):914-924.
|
| [21] |
王姣娥, 陈娱, 戴特奇, 等. 中国交通地理学的传承发展与创新[J]. 经济地理, 2021, 41(10):59-69.
|
| [22] |
陈娱, 金凤君, 陆玉麒, 等. 京津冀地区陆路交通网络发展过程及可达性演变特征[J]. 地理学报, 2017, 72(12):2252-2264.
|
| [23] |
王慧, 张梅青. 高铁对京津冀地区可达性及经济联系的影响[J]. 地理科学, 2021, 41(9):1615-1624.
|
| [24] |
蒋海兵, 张文忠, 祁毅, 等. 区域交通基础设施可达性研究进展[J]. 地理科学进展, 2013, 32(5):807-817.
|
| [25] |
曹开军, 龙顺发. 新疆县市旅游产业集聚演变及其影响因素[J]. 经济地理, 2022, 42(12):205-213.
|
| [26] |
杨良健, 曹开军. 新疆85个县市旅游生态安全时空格局演变及驱动机制[J]. 生态学报, 2021, 41(23):9239-9252.
|
| [27] |
潘竟虎, 李俊峰. 中国A级旅游景点空间分布特征与可达性[J]. 自然资源学报, 2014, 29(0):55-66.
|
| [28] |
蒋海兵, 徐建刚, 祁毅. 京沪高铁对区域中心城市陆路可达性影响[J]. 地理学报, 2010, 65(10):1287-1298.
|
| [29] |
吴威, 曹有挥, 梁双波. 20世纪80年代以来长三角地区综合交通可达性的时空演化[J]. 地理科学进展, 2010, 29(5):619-626.
|
/
| 〈 |
|
〉 |