
农旅融合对农业绿色全要素生产率的影响——基于动态空间杜宾模型与门槛效应的检验
|
王晶晶(1987—),女,博士,副教授,研究方向为乡村旅游。E-mail: wjj2111987@163.com |
收稿日期: 2023-03-09
修回日期: 2024-10-05
网络出版日期: 2025-08-07
基金资助
国家社会科学基金项目(21BGL150)
湖南省自然科学基金项目(20241J72406)
湖南省应用特色学科“应用经济学”资助项目(湘教通〔2018〕469号)
湖南人文科技学院校级委托项目(2024WT07)
湖南省青年骨干教师培养项目
山东省重点研发计划(软科学)项目重点项目(2023RZB01001)
Effects of the Integration of Agriculture and Tourism on the Green Total Factor Productivity of Agriculture: Based on Dynamic Spatial Durbin Model and Threshold Effect Test
Received date: 2023-03-09
Revised date: 2024-10-05
Online published: 2025-08-07
关键词: 农旅融合; 农业绿色全要素生产率; 溢出效应; 动态空间杜宾模型; 动态门槛效应模型
王晶晶 , 周发明 , 刘忠秀 . 农旅融合对农业绿色全要素生产率的影响——基于动态空间杜宾模型与门槛效应的检验[J]. 经济地理, 2025 , 45(6) : 161 -172 . DOI: 10.15957/j.cnki.jjdl.2025.06.016
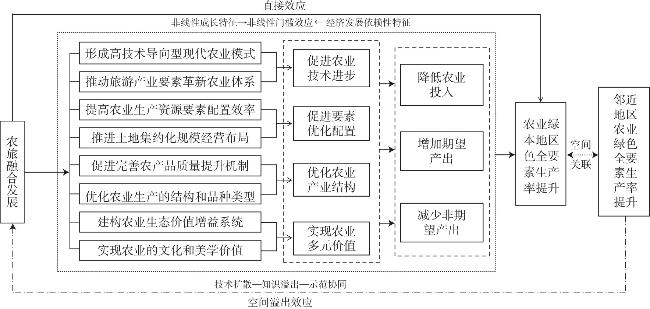
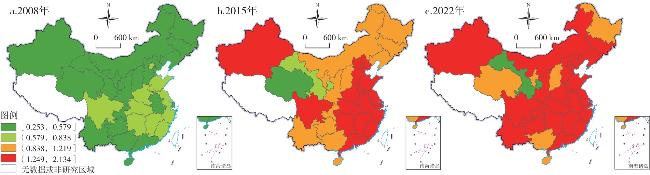
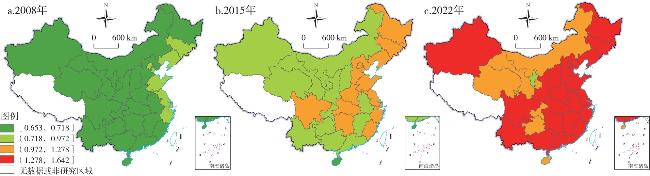
Based on the good ecological agricultural resources, the integration of agriculture and tourism can promote the agricultural technological progress, optimize the agricultural resource allocation, and drive the upgrading of the agricultural industrial structure, thereby enhancing the green total factor productivity of agriculture and promoting the green development of agriculture. This article applies the Super-SBM model with non-desired outputs to calculate the green total factor productivity of agriculture in 30 provincial-level regions of China from 2008 to 2022. It evaluates the level of integration between agriculture and tourism by the means of the entropy method, the factor analysis method, and the grey relational degree model. Based on the above, it uses the spatial Durbin model and threshold effect model to test the impact of the integration of agriculture and tourism on the green total factor productivity of agriculture. The results show that: 1) Both the agricultural green total factor productivity (AGTFP) and the integration level between agriculture and tourism (ILAT) have significant spatial agglomeration characteristics. The dynamic spatial Durbin model can better reveal the relationship between the two. 2) The integration of agriculture and tourism has a significant positive promoting effect on AGTFP, and this impact has spatial spillover effects. It has the strongest direct effect in central region, and has the most significant spillover effect in eastern region. 3) The impact of the integration of agriculture and tourism on AGTFP has a relatively prominent stage and economic dependence, showing typical nonlinear threshold characteristics. The impact of the integration of agriculture and tourism on AGTFP presents a double threshold characteristic as the integration level between agriculture and tourism increases. Additionally, as the regional economic level improves, this impact shows a single threshold characteristic. The research results provide policy implications for promoting the deep integration of agriculture and tourism to enhance AGTFP and promote the green development of agriculture.
表1 农业投入—产出指标及说明Tab.1 Input-output indicators of agriculture and their explanations |
| 变量 | 指标 | 度量指标 | 单位 |
|---|---|---|---|
| 投入指标 | 农用机械投入 | 农业机械总动力 | 万kW |
| 农业劳动力投入 | 农业从业人数=(农业产值/农林牧渔业总产值)·农林牧渔业从业人员数 | 万人 | |
| 农用土地投入 | 农作物播种面积 | 千hm² | |
| 农业资源投入 | 折纯化肥施用量 | 万t | |
| 农药使用量 | 万t | ||
| 农膜使用量 | 万t | ||
| 有效灌溉面积 | 万t | ||
| 农用柴油使用量 | 千hm² | ||
| 产出指标 | 期望产出 | 农业产值 | 亿元 |
| 非期望产出 | 农业碳排放量 | 万t | |
| 农业面源污染量 | 万t |
表2 农业与旅游融合水平测度指标体系Tab.2 Measurement index system of the integration level of agriculture and tourism |
| 准则层 | 指标体系 | |
|---|---|---|
| 产业关联度 | 农业与旅游产业的灰色关联度(X1) | 地区农业增加值、国内旅游人次、国内旅游收入 |
| 示范效应 | 融合新业态(X2) | 全国休闲农业与乡村旅游示范县、全国乡村旅游重点村镇、全国休闲农业与乡村旅游精品园区、全国休闲农业与乡村旅游示范点 |
| 融合效益 | 投资(X3) | 果园面积、农业新增固定资产投资、农村农户固定资产投资 |
| 就业(X4) | 乡村个体户就业人数、乡村私营企业就业人数 | |
| 产业发展(X5) | 旅游总收入占GDP比重、农业增加值占GDP比重 | |
表3 变量的描述性统计结果Tab.3 Descriptive statistical results of variables |
| 变量 | 观测值 | 均值 | 中位数 | 标准差 | 最大值 | 最小值 |
|---|---|---|---|---|---|---|
| AGTFP | 450 | 0.965 | 0.9307 | 0.217 | 1.642 | 0.648 |
| ILAT | 450 | 0.877 | 0.807 | 0.339 | 2.134 | 0.253 |
| AIS | 450 | 0.569 | 0.466 | 0.621 | 0.754 | 0.275 |
| INC | 450 | 2.736 | 2.813 | 0.097 | 4.632 | 1.821 |
| TRD | 450 | 0.311 | 0.327 | 0.008 | 0.361 | 0.013 |
| DIS | 450 | 0.232 | 0.262 | 0.133 | 0.764 | 0.000 |
| EDU | 450 | 7.432 | 7.521 | 0.932 | 9.012 | 3.454 |
表4 2022年中国30省份ILAT和AGTFP排序Tab.4 Ranking of ILAT and AGTFP in 30 provincial-level regions of China in 2022 |
| 省份 | ILAT | 省份 | ILAT | 省份 | AGTFP | 省份 | AGTFP | |
|---|---|---|---|---|---|---|---|---|
| 浙江 | 2.134 | 天津 | 1.420 | 山东 | 1.642 | 新疆 | 1.327 | |
| 江苏 | 2.112 | 云南 | 1.393 | 吉林 | 1.562 | 云南 | 1.325 | |
| 山东 | 2.098 | 陕西 | 1.354 | 河北 | 1.510 | 湖南 | 1.318 | |
| 四川 | 1.899 | 河北 | 1.317 | 江苏 | 1.483 | 湖北 | 1.315 | |
| 广东 | 1.887 | 贵州 | 1.276 | 浙江 | 1.478 | 广西 | 1.314 | |
| 湖北 | 1.797 | 新疆 | 1.259 | 北京 | 1.439 | 江西 | 1.313 | |
| 北京 | 1.712 | 吉林 | 1.245 | 上海 | 1.437 | 山西 | 1.310 | |
| 福建 | 1.706 | 内蒙古 | 1.225 | 辽宁 | 1.435 | 安徽 | 1.306 | |
| 湖南 | 1.704 | 黑龙江 | 1.219 | 福建 | 1.421 | 陕西 | 1.288 | |
| 河南 | 1.693 | 山西 | 1.214 | 黑龙江 | 1.418 | 贵州 | 1.278 | |
| 江西 | 1.689 | 广西 | 1.158 | 河南 | 1.410 | 重庆 | 1.277 | |
| 安徽 | 1.678 | 海南 | 1.093 | 天津 | 1.365 | 青海 | 1.146 | |
| 辽宁 | 1.649 | 宁夏 | 1.008 | 广东 | 1.345 | 海南 | 1.140 | |
| 上海 | 1.543 | 青海 | 0.897 | 江西 | 1.365 | 甘肃 | 1.132 | |
| 重庆 | 1.521 | 甘肃 | 0.832 | 山东 | 1.345 | 宁夏 | 1.079 |
表5 2008—2022年中国ILAT和AGTFP的全局莫兰值Tab.5 Global Moran's index of ILAT and AGTFP in China from 2008 to 2022 |
| 2008 | 2009 | 2010 | 2011 | 2012 | 2013 | 2014 | 2015 | 2016 | 2017 | 2018 | 2019 | 2020 | 2021 | 2022 | ||
|---|---|---|---|---|---|---|---|---|---|---|---|---|---|---|---|---|
| 农旅融合水平(ILAT) | 莫兰值 | 0.234** | 0.239*** | 0.243* | 0.247* | 0.256** | 0.257*** | 0.269** | 0.273** | 0.276*** | 0.269*** | 0.284*** | 0.283*** | 0.213*** | 0.221*** | 0.214*** |
| P值 | 0.043 | 0.006 | 0.085 | 0.097 | 0.039 | 0.002 | 0.022 | 0.034 | 0.008 | 0.003 | 0.004 | 0.008 | 0.009 | 0.006 | 0.003 | |
| 农业绿色全要素生产率(AGTFP) | 莫兰值 | 0.328* | 0.335* | 0.339* | 0.367** | 0.374** | 0.369** | 0.387* | 0.400** | 0.412* | 0.410** | 0.420*** | 0.457*** | 0.443*** | 0.417*** | 0.420*** |
| P值 | 0.078 | 0.019 | 0.096 | 0.045 | 0.021 | 0.044 | 0.071 | 0.043 | 0.054 | 0.019 | 0.006 | 0.003 | 0.006 | 0.007 | 0.005 |
表6 空间回归模型检验结果Tab.6 Results of spatial regression models |
| 检验类型 | 静态空间杜宾模型 | 动态空间杜宾模型 |
|---|---|---|
| LM-lag test | 58.412*** | 62.545*** |
| Robust LM-lag test | 27.321*** | 25.212*** |
| LM-error test | 54.081*** | 68.521*** |
| Robust LM-error test | 32.321*** | 39.611*** |
| Wald-spatial lag test | 83.542*** | 102.283*** |
| LR-spatial lag test | 101.034*** | 161.541*** |
| Wald-spatial error test | 76.143*** | 64.946*** |
| LR-spatial error test | 51.646*** | 71.328*** |
| Hausman test | 85.831*** | 140.377*** |
表7 空间杜宾模型估计结果Tab.7 Estimation results of spatial Durbin model |
| 变量 | 静态空间杜宾模型 | 动态空间杜宾模型 | |||
|---|---|---|---|---|---|
| 模型1(W1) | 模型2(W2) | 模型3(W1) | 模型4(W2) | ||
| AGTFPi,t-1 | 0.311***(3.379) | 0.268**(2.760) | |||
| ILATit | 0.361** (2.997) | 0.312***(4.315) | 0.237***(3.752) | 0.253***(4.432) | |
| AIS | 0.245*** (3.186) | 0.119***(4.191) | 0.176***(4.966) | 0.306**(3.221) | |
| INC | -0.191***(-4.969) | -0.078***(-4.139) | -0.127**(-2.118) | -0.118***(-4.127) | |
| TRD | 0.313*** (3.326) | 0.193**(3.131) | 0.204**(2.675) | 0.246***(5.032) | |
| DIS | -0.221*(-4.081) | -0.243*(-3.241) | -0.337**(-2.195) | -0.432**(-3.765) | |
| EDU | 0.187* (2.421) | 0.089**(2.822) | 0.224*(2.323) | 0.132**(2.965) | |
| W·ILATit | 0.175** (3.097) | 0.098**(2.135) | 0.124**(2.723) | 0.119**(3.031) | |
| Adj R2 | 0.811 | 0.754 | 0.825 | 0.732 | |
| ρ | 0.451*** (3.231) | 0.432***(4.635) | 0.274***(3.819) | 0.255***(4.132) | |
| Log L | 106.324 | 112.875 | 135.543 | 126.324 | |
注:受篇幅限制,本表未给出估计结果中各控制变量的空间相互作用系数。 |
表8 空间效应分解结果Tab.8 Results of spatial effect decomposition |
| 变量 | ILATit | AITit | AISit | INCit | TRDit | DISit | EDUit |
|---|---|---|---|---|---|---|---|
| 直接效应 | 0.146**(3.110) | 0.112*(2.316) | 0.146**(3.026) | -0.135**(-2.664) | 0.198**(3.208) | -0.256**(-2.882) | 0.112**(2.681) |
| 溢出效应 | 0.108*(1.987) | 0.101*(2.027) | 0.085**(2.568) | -0.056*(-2.217) | 0.091*(2.295) | -0.008(-0.065) | 0.075**(2.352) |
| 总效应 | 0.254*(2.541) | 0.213*(2.315) | 0.231*(2.315) | -0.191*(-1.987) | 0.289*(2.109) | -0.264**(-3.126) | 0.187**(2.654) |
表9 分区域估计结果Tab.9 Estimation results by region |
| 变量 | 东部地区 | 中部地区 | 西部地区 | 东北地区 |
|---|---|---|---|---|
| AGTFPi,t-1 | 0.387***(3.586) | 0.365***(3.640) | 0.326***(3.543) | 0.221*** (2.873) |
| ILATit | 0.278**(2.876) | 0.324** (3.153) | 0.197**(3.156) | 0.165** (2.746) |
| AIT | 0.158* (2.084) | 0.131* (1.995) | 0.225* (2.356) | 0.201* (1.999) |
| INC | -0.208*(-1.997) | -0.134*(-2.068) | -0.176*(-2.175) | -0.125* (-2.168) |
| TRD | 0.343**(3.121) | 0.176** (3.086) | 0.178 (1.608) | 0.221* (2.166) |
| DIS | -0.176*(-2.087) | -0.215**(-3.243) | -0.321**(-3.154) | -0.118**(-3.141) |
| EDU | 0.313* (2.543) | 0.165** (3.074) | 0.088 (1.743) | 0.132** (3.115) |
| W·ILATit | 0.209* (2.514) | 0.115** (2.875) | 0.101**(2.765) | 0.087* (1.964) |
| Adj R2 | 0.8508 | 0.8473 | 0.8164 | 0.7115 |
| ρ | 0.221**(2.787) | 0.207** (2.608) | 0.198**(2.765) | 0.171** (2.632) |
| Log L | 148.086 | 176.354 | 111.847 | 78.543 |
表10 不同区域的空间效应分析Tab.10 Spatial effect analysis of different regions |
| 变量 | 东部地区 | 中部地区 | 西部地区 | 东北地区 |
|---|---|---|---|---|
| 直接效应 | 0.246**(2.975) | 0.307** (2.614) | 0.137**(2.591) | 0.121**(3.097) |
| 溢出效应 | 0.111**(3.143) | 0.076** (3.114) | 0.075**(2.605) | 0.062 (1.448) |
| 总效应 | 0.357**(2.986) | 0.383** (2.978) | 0.212**(2.813) | 0.183**(1.987) |
表11 门槛特征检验结果Tab.11 Results of threshold characteristic test |
| 门槛变量 | 模型检验 | 门槛估计值 | F统计量 | P值 | 临界值 | ||
|---|---|---|---|---|---|---|---|
| 1% | 5% | 10% | |||||
| ILAT | 单一门槛 | 0.985 | 21.548*** | 0.003 | 14.097 | 6.865 | 4.432 |
| 双重门槛 | 门槛1:0.985 门槛2:1.397 | 14.237** | 0.028 | 21.943 | 14.843 | 10.132 | |
| 三重门槛 | - | 2.221 | 0.170 | 5.909 | 2.558 | 1.029 | |
| EGDP | 单一门槛 | 0.931 | 39.098*** | 0.000 | 11.975 | 6.843 | 3.987 |
| 双重门槛 | - | 2.019 | 0.498 | 3.114 | 2.764 | 1.498 | |
表12 动态门槛效应估计结果Tab.12 Estimation results of dynamic threshold effect |
| 门槛变量 | 门槛及区间 | 回归系数 | T值 | 标准误 |
|---|---|---|---|---|
| ILAT | 第一区间:ILAT≤0.985 | 0.257** | 3.0510 | 0.002 |
| 第二区间:0.985<ILAT≤1.397 | 0.165* | 2.1326 | 0.001 | |
| 第三区间:ILAT>1.347 | 0.405** | 2.9430 | 0.051 | |
| EGDP | 第一区间:EGDP≤0.921 | 0.224** | 2.6540 | 0.032 |
| 第二区间:EGDP>0.921 | 0.431*** | 4.7650 | 0.007 |
| [1] |
陆杉, 熊娇. 农村金融、农地规模经营与农业绿色效率[J]. 华南农业大学学报(社会科学版), 2021, 20(4):63-75.
|
| [2] |
王琪延, 徐玲. 基于产业关联视角的北京旅游业与农业融合研究[J]. 旅游学刊, 2013, 28(8):102-110.
|
| [3] |
王丽芳. 山西省农业与旅游业融合的动力机制与发展路径[J]. 农业技术经济, 2018, 276(4):136-144.
|
| [4] |
刘广宇, 黎斌林, 李新然. 云南省农旅融合发展实证分析与模式构建—基于VAR模型的检验[J]. 生态经济, 2020, 36(6):135-141.
|
| [5] |
王晶晶, 王兆峰. 中国农业与旅游产业融合发展的时空演进及空间关联性[J]. 湖南师范大学自然科学学报, 2023, 46(6):1-10.
|
| [6] |
黄祖辉, 宋文豪, 成威松, 等. 休闲农业与乡村旅游发展促进农民增收了吗?——来自准自然实验的证据[J]. 经济地理, 2022, 42(5):213-222.
|
| [7] |
姚海琴, 朋文欢, 黄祖辉. 家庭型乡村旅游发展对农户收入的影响机制及效果——以浙江、四川和湖南三省为例[J]. 经济地理, 2016, 36(11):169-176.
|
| [8] |
袁中许. 乡村旅游业与大农业耦合的动力效应及发展趋向[J]. 旅游学刊, 2013, 28(5):80-88.
|
| [9] |
|
| [10] |
|
| [11] |
|
| [12] |
|
| [13] |
|
| [14] |
|
| [15] |
|
| [16] |
|
| [17] |
刘亦文, 欧阳莹, 蔡宏宇. 中国农业绿色全要素生产率测度及时空演化特征研究[J]. 数量经济技术经济研究, 2021, 38(5):39-56.
|
| [18] |
余家凤, 胡依杨, 孔令成. 农地经营规模对农业绿色全要素生产率的影响研究——基于SBM-ML指数法和空间杜宾模型[J]. 长江大学学报(社会科学版), 2022, 45(2):99-107.
|
| [19] |
高杨, 牛子恒. 农业信息化、空间溢出效应与农业绿色全要素生产率——基于SBM-ML指数法和空间杜宾模型[J]. 统计与信息论坛, 2018, 33(10):66-75.
|
| [20] |
梁俊, 龙少波. 农业绿色全要素生产率增长及其影响因素[J]. 华南农业大学学报(社会科学版), 2015, 14(3):1-12.
|
| [21] |
李健旋. 农村金融发展与农业绿色全要素生产率提升研究[J]. 管理评论, 2021, 33(3):84-95.
|
| [22] |
黄伟华, 祁春节, 方国柱, 等. 农业环境规制促进了小麦绿色全要素生产率的提升吗?[J]. 长江流域资源与环境, 2021, 30(2):459-471.
|
| [23] |
罗明忠, 魏滨辉. 农村产业融合的环境效应分析[J]. 农村经济, 2022(12):57-66.
|
| [24] |
王玉婷. 苏州市农旅融合演进研究[D]. 苏州: 苏州科技大学, 2016.
|
| [25] |
朱志胜. 农旅融合、要素配置与农业劳动生产率[J]. 管理学刊, 2022, 35(3):29-43.
|
| [26] |
周杰. 农旅融合对高效农业的作用机制分析—一个过程—收益的视角[J]. 贵州师范学院学报, 2017, 33(7):1-4.
|
| [27] |
刘英基, 郭举. 农旅融合何以提升农村劳动力就业质量?——基于空间杜宾模型的实证检验[J]. 河南师范大学学报(哲学社会科学版), 2025, 52(2):78-84.
|
| [28] |
胡平波, 钟漪萍. 农旅融合促进农业生态效率提升机理与实证分析——以全国休闲农业与乡村旅游示范县为例[J]. 中国农村经济, 2019, 35(12):85-104.
|
| [29] |
纪成君, 夏怀明. 我国农业绿色全要素生产率的区域差异与收敛性分析[J]. 中国农业资源与区划, 2020, 41(12):136-143.
|
| [30] |
肖琴, 周振亚, 罗其友. 长江经济带农业绿色生产效率及其时空分异特征研究[J]. 中国农业资源与区划, 2020, 41(10):15-24.
|
| [31] |
李晓龙, 冉光和. 农产品贸易提升了农业绿色全要素生产率吗?——基于农村金融发展视角的分析[J]. 北京理工大学学报(社会科学版), 2021, 23(4):82-92.
|
| [32] |
陈芳, 杨梅君. 农产品国际贸易对中国农业绿色全要素生产率的影响[J]. 华南农业大学学报(社会科学版), 2021, 20(5):94-104.
|
| [33] |
刘亦文, 欧阳莹, 蔡宏宇. 中国农业绿色全要素生产率测度及时空演化特征研究[J]. 数量经济技术经济研究, 2021, 38(5):39-56.
|
| [34] |
|
| [35] |
马国霞, 於方, 曹东, 等. 中国农业面源污染物排放量计算及中长期预测[J]. 环境科学学报, 2012, 32(2):489-497.
|
| [36] |
杨歌谣, 周常春, 杨光明. 农业和旅游业产业融合与农村贫困减缓的关系分析[J]. 统计与决策, 2020, 36(5):81-86.
|
| [37] |
周鹏飞, 沈洋, 李爱民. 农旅融合能促进农业高质量发展吗——基于省域面板数据的实证检验[J]. 宏观经济研究, 2021(10):117-130.
|
| [38] |
毛其淋. 经济开放、城市化水平与城乡收入差距——基于中国省际面板数据的经验研究[J]. 浙江社会科学, 2011(1):11-22,155.
|
| [39] |
刘军, 徐康宁. 产业聚集、经济增长与地区差距——基于中国省级面板数据的实证研究[J]. 中国软科学, 2010(7):91-102.
|
| [40] |
|
| [41] |
|
| [42] |
吴军, 理爽. 双循环背景下双向FDI对碳排放强度的影响研究——基于动态空间杜宾模型的分析[J]. 生态经济, 2022, 38(12):23-30,38.
|
| [43] |
张佑印, 顾静. 天津滨海新区旅游市场空间结构及游客行为研究[J]. 干旱区资源与环境, 2013, 27(6):191-197.
|
| [44] |
许欣, 张文忠. 中国四大区域板块:增长差异、比较优势和“十四五”发展路径[J]. 经济地理, 2021, 41(7):1-9.
|
/
| 〈 |
|
〉 |