
交通运输成本视角下长江中游城市群城市网络空间关联机制
|
王圣云(1977—),男,山西河曲人,博士,研究员。主要研究方向为区域经济与福祉地理学。E-mail:wangshengyun@163.com。 |
收稿日期: 2019-06-13
修回日期: 2020-02-27
网络出版日期: 2025-05-14
基金资助
国家自然科学地区基金项目(41861025)
江西省高校人文社会科学研究规划项目(JJ19118)
江西省教育科学“十三五”规划2018年度重点课题(18ZD003)
国家统计科学项目(2019LY40)
国家社会科学基金青年项目(15CJL011)
Spatial Organization and Driving Mechanism of Connected Network of Urban Agglomeration in the Middle Reaches of the Yangtze River
Received date: 2019-06-13
Revised date: 2020-02-27
Online published: 2025-05-14
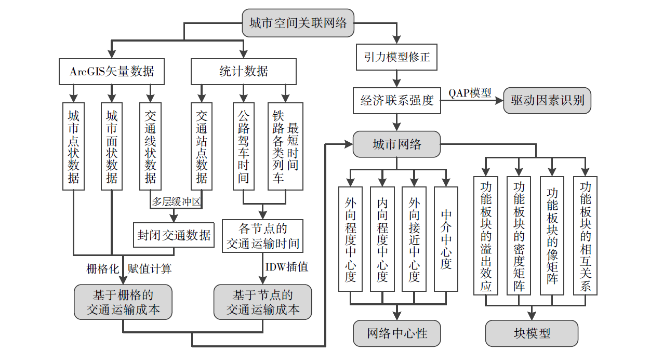
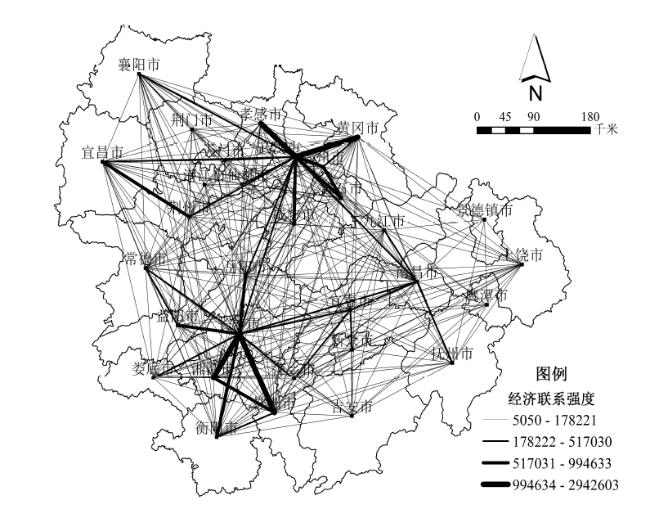
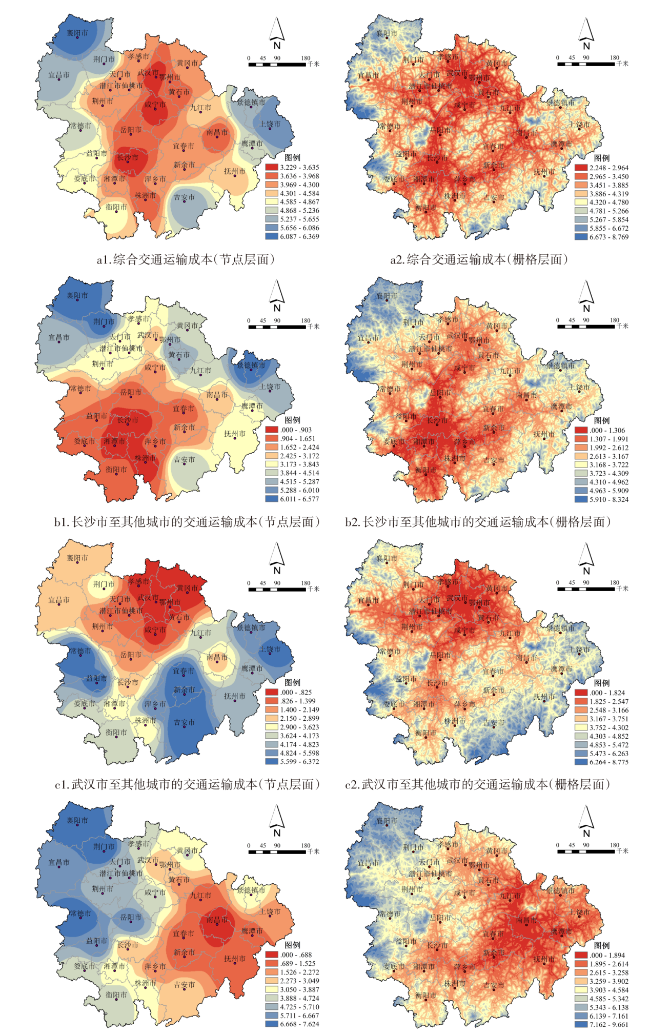
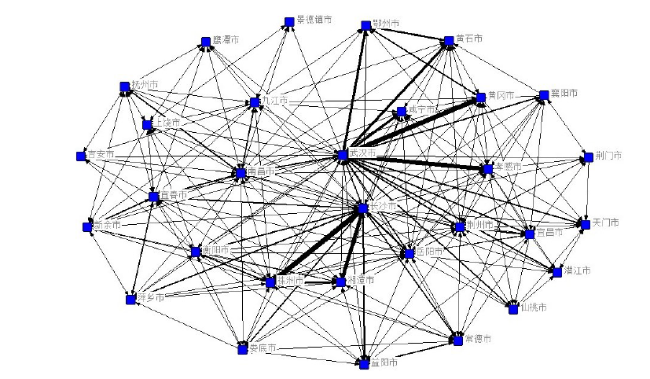
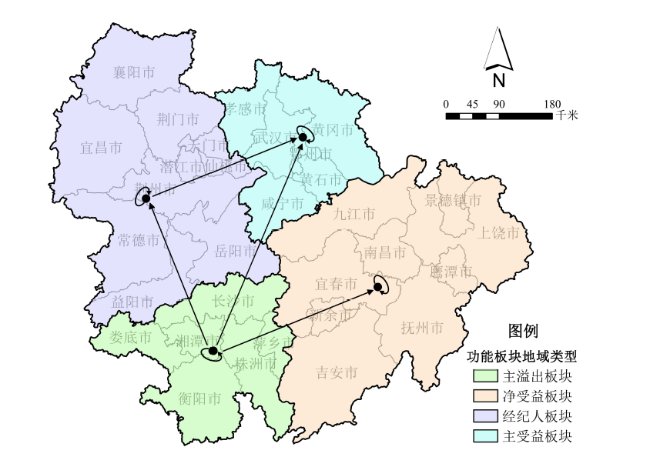
结合引力模型、交通运输成本模型、网络中心度模型、块模型和QAP模型,分析长江中游城市群城市网络空间关联及其驱动因素得出:①武汉城市圈、环长株潭城市群内部的经济联系强度均高于环鄱阳湖城市群,且武汉城市圈与环长株潭城市群之间的经济联系强度较为突出,长江中游城市群已经以武汉市和长沙市为中心形成了两个明显的城际经济联系密集区。②长江中游城市群三大城市群的综合运输成本存在差异。环长株潭城市群内部交通一体化程度最高,环鄱阳湖城市群最低。长沙市至武汉城市圈、武汉市至环长株潭城市群的交通运输成本明显低于长沙市、武汉市至环鄱阳湖城市群城市的交通运输成本。③长江中游城市群城市网络对外辐射能力整体较强,而整体的吸引能力相对偏弱,即三大城市群之间的经济联系较弱,而其内部的城际经济联系则较强。环长株潭城市群对外辐射、吸引和中介能力整体最强,环鄱阳湖城市群相对最弱。④长江中游城市群城市关联网络可以划分为主溢出板块、净受益板块、经纪人板块、主受益板块四个功能板块。主溢出板块是长江中游城市群城市关联网络的发动机,净受益板块处于相对边缘的位置,经纪人板块是主溢出板块和主受益板块之间联系的桥梁。⑤在多因素共同作用下,城市之间地理位置相邻、交通基础设施水平相近、产业结构相近和外向型经济结构相近有助于长江中游城市群城市关联网络发展,而外资利用水平、互联网开放程度等方面的差异化发展促进了城市之间的空间关联。
王圣云 , 宋雅宁 , 张玉 , 李晶 . 交通运输成本视角下长江中游城市群城市网络空间关联机制[J]. 经济地理, 2020 , 40(6) : 87 -97 . DOI: 10.15957/j.cnki.jjdl.2020.06.010
Based on the gravity model,transportation cost model,network centrality model,block model and QAP model,this study analyzes the network spatial connection and driving factors of urban agglomeration in the middle reaches of the Yangtze River. The results indicate that: 1) The economic connection intensity of Wuhan Metropolitan Area and Changsha-Zhuzhou-Xiangtan urban agglomeration is higher than that of urban agglomeration around the Poyang Lake,and the economic connection strength between Wuhan Metropolitan Area and Changsha-Zhuzhou-Xiangtan urban agglomeration is more prominent. The urban agglomeration in the middle reaches of the Yangtze River,centered on Wuhan and Changsha,has formed two obvious areas with dense inter-city economic links. 2) There are differences in the comprehensive transport cost of the three urban agglomerations in the middle reaches of the Yangtze River: the comprehensive transport cost of Changsha-Zhuzhou-Xiangtan urban agglomeration (4.245h) is lower than that of Wuhan Metropolitan Area (4.354h),while the comprehensive transport cost of Wuhan Metropolitan Area is lower than that of urban agglomeration around the Poyang Lake (4.748h). The inner traffic integration degree of Changsha-Zhuzhou-Xiangtan urban agglomeration is the highest,while that of urban agglomeration around the Poyang Lake is the lowest. The transportation costs from Changsha to Wuhan Metropolitan Area and from Wuhan to Changsha-Zhuzhou-Xiangtan urban agglomeration are significantly lower than that from Changsha and Wuhan to urban agglomeration around the Poyang Lake. 3) The connected network of urban agglomeration in the middle reaches of the Yangtze River has a stronger external radiation capacity,while its cohesive capacity is relatively weak,that is,the economic connection among the three major urban agglomerations is weak,and the internal inter-city economic linkage is stronger. The Changsha-Zhuzhou-Xiangtan urban agglomeration has the strongest external radiation,cohesion and intermediation capacity,and that of urban agglomeration around the Poyang Lake is relatively weakest. 4) The connected network of urban agglomeration in the middle reaches of the Yangtze River can be divided into four functional blocks: the main spillover block,the net beneficiary block,the broker block and the main beneficiary block. The main spillover block is the engine of the connected network of urban agglomeration in the middle reaches of the Yangtze River. The net beneficiary block is at the relative edge. The broker block is the bridge between the main spillover block and the main beneficiary block. 5) Under the influence of multiple factors,the geographical proximity,the similar level of transportation infrastructure,the similar industrial structure and the similar export-oriented economic structure of cities contribute to the development of connected network of urban agglomeration in the middle reaches of the Yangtze River. The differential development of foreign capital utilization level and Internet openness will be beneficial to the development of connected network.
表1 道路等级划分及其速度值Tab.1 The classification of roads and their speed value |
| 等级 | 公路 | 铁路 | |||||||
|---|---|---|---|---|---|---|---|---|---|
| 高速 | 一级 | 二级 | 三级 | 四级 | 等外 | 高速 | 普通 | ||
| 速度(km/h) | 100 | 80 | 70 | 35 | 25 | 15 | 250 | 120 | |
注:依据《公路工程技术标准》(JTGB01-2014)设置公路等级及速度值。 |
表2 块模型的板块分类规则Tab.2 Block classification rules of blockmodels |
| 位置内部的关系比例 | 位置接受到的关系比例 | |
|---|---|---|
| ≈0 | >0 | |
| - | 主受益板块/净受益板块 | |
| 主溢出板块 | 经纪人板块 | |
表3 长江中游城市群城市规模等级(2017年)Tab.3 The city scale of urban agglomeration in the middle reaches of the Yangtze River (2017) |
| 规模等级 | 人口分布区间(万) | 城市 |
|---|---|---|
| 超大城市 | >1 000 | 武汉 |
| 特大城市 | (500,1 000] | 长沙 |
| Ⅰ型大城市 | (300,500] | 襄阳、荆州、衡阳、孝感 |
| Ⅱ型大城市 | (100,300] | 宜昌、岳阳、南昌、株洲、益阳、湘潭、黄冈、娄底、 |
| 常德、荆门、黄石、宜春、天门、仙桃、鄂州、咸宁 | ||
| 中等城市 | (50,100] | 九江、潜江、上饶、抚州、景德镇 |
| Ⅰ型小城市 | (20,50] | 新余、萍乡、吉安、鹰潭 |
注:划分标准依据国务院于2014年颁布的《关于调整城市规模划分标准的通知》。 |
表4 长江中游城市群城市关联网络的各城市群中心度Tab.4 Centrality of each urban agglomeration of the connected network of cities in urban agglomeration in the middle reaches of the Yangtze River |
| 城市群 | 程度中心度(%) | 外向接近 中心度(%) | 中介中 心度(%) | |
|---|---|---|---|---|
| 外向度 | 内向度 | |||
| 长江中游城市群 | 66.89 | 32.44 | 81.69 | 21.55 |
| 环长株潭城市群 | 52.08 | 39.17 | 69.23 | 2.61 |
| 武汉城市圈 | 31.54 | 35.64 | 61.02 | 2.47 |
| 环鄱阳湖城市群 | 26.67 | 31.67 | 54.84 | 2.19 |
表5 长江中游城市群城市关联网络的城市中心度:前10名Tab.5 Centrality of connected network of cities in urban agglomeration in the middle reaches of the Yangtze River:Top 10 |
| 程度中心度 | 接近中心度 | 中介中心度 | |||||||
|---|---|---|---|---|---|---|---|---|---|
| 城市 | 外向度(%) | 城市 | 内向度(%) | 城市 | 外向度(%) | 城市 | 中介度(%) | ||
| 武汉市 | 100.00 | 武汉市 | 66.67 | 武汉市 | 100.00 | 武汉市 | 23.27 | ||
| 长沙市 | 96.67 | 长沙市 | 53.33 | 长沙市 | 96.77 | 南昌市 | 12.39 | ||
| 岳阳市 | 76.67 | 荆州市 | 53.33 | 岳阳市 | 81.08 | 长沙市 | 11.87 | ||
| 南昌市 | 73.33 | 南昌市 | 50.00 | 南昌市 | 78.95 | 九江市 | 5.71 | ||
| 株洲市 | 56.67 | 岳阳市 | 46.67 | 株洲市 | 69.77 | 岳阳市 | 4.61 | ||
| 衡阳市 | 53.33 | 宜春市 | 43.33 | 衡阳市 | 68.18 | 荆州市 | 4.00 | ||
| 九江市 | 46.67 | 咸宁市 | 43.33 | 荆州市 | 65.22 | 宜春市 | 2.18 | ||
| 孝感市 | 46.67 | 孝感市 | 40.00 | 孝感市 | 65.22 | 孝感市 | 2.07 | ||
| 荆州市 | 46.67 | 黄冈市 | 40.00 | 九江市 | 65.22 | 株洲市 | 1.34 | ||
| 宜昌市 | 46.67 | 株洲市 | 36.67 | 宜昌市 | 65.22 | 衡阳市 | 1.20 | ||
表6 长江中游城市群各功能板块之间的溢出效应分析结果Tab.6 Analysis results of spillover effect among functional blocks of urban agglomeration in the middle reaches of the Yangtze River |
| 功能板块 名称 | 接收关系 | 板块成 员数目 | 期望的内部 关系比例(%) | 实际的内部 关系比例(%) | 接收板块 外关系数 | 发出板块 外关系数 | 板块 特征 | |||
|---|---|---|---|---|---|---|---|---|---|---|
| 第一板块 | 第二板块 | 第三板块 | 第四板块 | |||||||
| 第一板块 | 29 | 25 | 24 | 13 | 6 | 17 | 32 | 40 | 62 | 主溢出板块 |
| 第二板块 | 15 | 45 | 2 | 11 | 9 | 27 | 62 | 40 | 28 | 净受益板块 |
| 第三板块 | 17 | 3 | 52 | 24 | 10 | 30 | 54 | 47 | 44 | 经纪人板块 |
| 第四板块 | 8 | 12 | 21 | 27 | 6 | 17 | 40 | 48 | 41 | 主受益板块 |
表7 长江中游城市群四个功能板块的密度矩阵及像矩阵Tab.7 Density matrix and image matrix of four functional blocks of urban agglomeration in the middle reaches of the Yangtze River |
| 功能板块名称 | 第一板块 | 第二板块 | 第三板块 | 第四板块 |
|---|---|---|---|---|
| 第一板块 | 0.967(1) | 0.463(1) | 0.400(1) | 0.361(1) |
| 第二板块 | 0.278(0) | 0.625(1) | 0.022(0) | 0.204(0) |
| 第三板块 | 0.283(0) | 0.033(0) | 0.578(1) | 0.400(1) |
| 第四板块 | 0.222(0) | 0.222(0) | 0.350(0) | 0.900(1) |
注:括号内数字是赋值为0,1的像矩阵。 |
表8 长江中游城市群城市网络空间关联与其驱动因素的QAP相关分析结果Tab.8 QAP correlation analysis results between network spatial connection and driving factors of urban agglomeration in the middle reaches of the Yangtze River |
| 实际相关系数 | 显著性水平 | 相关系数均值 | 标准差 | 最小值 | 最大值 | P≥0 | P≤0 | |
|---|---|---|---|---|---|---|---|---|
| 空间邻接矩阵(S) | 0.468 | 0.000 | 0.001 | 0.040 | -0.142 | 0.157 | 0.000 | 1.000 |
| 第三产业比重(I) | 0.153 | 0.033 | -0.001 | 0.074 | -0.219 | 0.265 | 0.033 | 0.967 |
| 国际互联网用户数(W) | 0.305 | 0.001 | 0.000 | 0.090 | -0.203 | 0.322 | 0.001 | 1.000 |
| 实际利用外资总额(F) | 0.340 | 0.000 | 0.000 | 0.090 | -0.216 | 0.330 | 0.000 | 1.000 |
| 等级公路总里程(M) | -0.182 | 0.001 | 0.000 | 0.062 | -0.257 | 0.199 | 0.999 | 0.001 |
| 进出口总额(O) | 0.310 | 0.000 | 0.000 | 0.090 | -0.216 | 0.334 | 0.000 | 1.000 |
表9 长江中游城市群城市网络空间关联驱动因素之间的QAP相关分析结果Tab.9 QAP correlation analysis results among driving factors of network spatial connection of urban agglomeration in the middle reaches of the Yangtze River |
| 空间邻接矩阵 (S) | 第三产业比重 (I) | 国际互联网用户数 (W) | 实际利用外资总额 (F) | 等级公路总里程 (M) | 进出口总额 (O) | |
|---|---|---|---|---|---|---|
| 空间邻接矩阵(S) | 1.000(0.000) | |||||
| 第三产业比重(I) | -0.027(0.269) | 1.000(0.000) | ||||
| 国际互联网用户数(W) | 0.065(0.074) | 0.696(0.000) | 1.000(0.000) | |||
| 实际利用外资总额(F) | 0.075(0.044) | 0.728(0.000) | 0.931(0.000) | 1.000(0.000) | ||
| 等级公路总里程(M) | -0.090(0.030) | -0.048(0.316) | 0.035(0.320) | -0.128(0.060) | 1.000(0.000) | |
| 进出口总额(O) | 0.071(0.055) | 0.680(0.000) | 0.925(0.000) | 0.973(0.000) | -0.133(0.035) | 1.000(0.000) |
表10 QAP回归得到的各变量矩阵的回归系数及检验指标Tab.10 Regression coefficients and the test indexs of the variable matrixs obtained by the QAP regression |
| 变量 | 非标准化 回归系数 | 标准化回归系数 | 显著性 水平 | P≥0 | P≤0 |
|---|---|---|---|---|---|
| 截距 | 0.324 | 0.000 | |||
| 空间邻接矩阵(S) | 0.557 | 0.421 | 0.000 | 0.000 | 1.000 |
| 第三产业比重(I) | -0.169 | -0.156 | 0.003 | 0.997 | 0.003 |
| 国际互联网用户数(W) | 0.148 | 0.177 | 0.100 | 0.100 | 0.901 |
| 实际利用外资总额(F) | 0.628 | 0.783 | 0.000 | 0.000 | 1.000 |
| 等级公路总里程(M) | -0.151 | -0.132 | 0.003 | 0.997 | 0.003 |
| 进出口总额(O) | -0.454 | -0.557 | 0.001 | 1.000 | 0.001 |
| [1] |
戴特奇, 金凤君, 王姣娥. 空间相互作用与城市关联网络演进——以我国20世纪90年代城际铁路客流为例[J]. 地理科学进展, 2005(2):80-89.
|
| [2] |
刘承良, 许佳琪, 郭庆宾. 基于铁路网的中国主要城市中心性的空间格局[J]. 经济地理, 2019, 39(3):57-66.
|
| [3] |
欧向军, 薛丽萍, 顾雯娟. 江苏省县市经济联系的空间特征[J]. 经济地理, 2015, 35(8):24-31.
|
| [4] |
王圣云, 秦尊文, 戴璐, 等. 长江中游城市集群空间经济联系与网络结构——基于运输成本和网络分析方法[J]. 经济地理, 2013, 33(4):64-69.
|
| [5] |
劳昕, 沈体雁, 杨洋, 等. 长江中游城市群经济联系测度研究——基于引力模型的社会网络分析[J]. 城市发展研究, 2016, 23(7):91-98.
|
| [6] |
靳海攀, 郑林, 张敬伟. 基于时间距离的鄱阳湖生态经济区经济联系变化网络分析研究[J]. 经济地理, 2013, 33(6):148-154.
|
| [7] |
邓楚雄, 宋雄伟, 谢炳庚, 等. 基于百度贴吧数据的长江中游城市群城市网络联系分析[J]. 地理研究, 2018, 37(6):1181-1 192.
|
| [8] |
盛科荣, 张红霞, 赵超越. 中国城市网络关联格局的影响因素分析——基于电子信息企业网络的视角[J]. 地理研究, 2019, 38(5):1030-1 044.
|
| [9] |
叶雅玲, 杨博飞, 何紫云, 等. 中国城市网络空间结构研究——基于A股上市医药公司网络[J]. 地理科学进展, 2018, 37(8):1096-1 105.
|
| [10] |
陈映雪, 甄峰, 王波, 等. 基于微博平台的中国城市网络信息不对称关系研究[J]. 地球科学进展, 2012, 27(12):1353-1 362.
|
| [11] |
刘法建, 张捷, 陈冬冬. 中国入境旅游流网络结构特征及动因研究[J]. 地理学报, 2010, 65(8):1013-1 024.
|
| [12] |
李航飞, 韦素琼, 陈松林. 海峡西岸经济区市域经济网络结构及成因分析[J]. 经济地理, 2017, 37(7):63-70,78.
|
| [13] |
吴威, 曹有挥, 曹卫东, 等. 长江三角洲公路网络的可达性空间格局及其演化[J]. 地理学报, 2006, 61(10):1065-1 074.
|
| [14] |
汪德根, 孙枫. 长江经济带陆路交通可达性与城镇化空间耦合协调度[J]. 地理科学, 2018, 38(7):1089-1 097.
|
| [15] |
安俞静, 刘静玉, 李宁, 等. 中原城市群铁路网络可达性及经济联系格局[J]. 长江流域资源与环境, 2018, 27(9):49-59.
|
| [16] |
庄汝龙, 宓科娜, 赵彪, 等. 基于可达性的中心城市场能与经济关联格局——以浙江省为例[J]. 经济地理, 2016, 36(9):58-65.
|
| [17] |
陈娱, 金凤君, 陆玉麒, 等. 京津冀地区陆路交通网络发展过程及可达性演变特征[J]. 地理学报, 2017, 72(12):2252-2 264.
|
| [18] |
李敬, 陈澍, 万广华, 等. 中国区域经济增长的空间关联及其解释——基于网络分析方法[J]. 经济研究, 2014(11):4-16.
|
| [19] |
王德忠, 庄仁兴. 区域经济联系定量分析初探——以上海与苏锡常地区经济联系为例[J]. 地理科学, 1996, 16(1):51-57.
|
| [20] |
沈惊宏, 陆玉麒, 兰小机, 等. 区域综合交通可达性评价——以安徽省为例[J]. 地理研究, 2012, 31(7):1280-1 293.
|
| [21] |
刘军. 整体网分析讲义:UCINET软件实用指南[M]. 上海: 格致出版社,上海人民出版社, 2009.
|
| [22] |
汪明峰, 宁越敏. 互联网与中国信息网络城市的崛起[J]. 地理学报, 2004, 59(3):127-135.
|
| [23] |
钟业喜, 冯兴华, 文玉钊. 长江经济带经济网络结构演变及其驱动机制研究[J]. 地理科学, 2016, 36(1):10-19.
|
| [24] |
姜海宁, 陆玉麒, 吕国庆. 江浙沪主要中心城市对外经济联系的测度分析[J]. 地理科学进展, 2008, 27(6):82-89.
|
| [25] |
袁其刚, 戴金平, 刘斌. 贸易结构变化促进经济增长途径的比较分析——基于中国数据的经验研究[J]. 世界经济研究, 2011(11):53-57,88.
|
/
| 〈 |
|
〉 |