
人口视角下黄河流域城市收缩的空间格局与影响因素
|
陈肖飞(1986—),男,河南三门峡人,副教授,硕士生导师。主要研究方向为产业空间动态、城市环境经济。E-mail:chenfei_niglas@163.com。 |
收稿日期: 2019-12-13
修回日期: 2020-05-19
网络出版日期: 2025-05-14
基金资助
国家自然科学基金项目(41901149)
2020年河南省重点研发与推广专项软科学项目(202400410244)
Spatial Pattern and Influencing Factors of Urban Shrinkage in the Yellow River Basin from the Perspective of Population Change
Received date: 2019-12-13
Revised date: 2020-05-19
Online published: 2025-05-14
陈肖飞 , 郜瑞瑞 , 韩腾腾 , 张胜男 . 人口视角下黄河流域城市收缩的空间格局与影响因素[J]. 经济地理, 2020 , 40(6) : 37 -46 . DOI: 10.15957/j.cnki.jjdl.2020.06.005
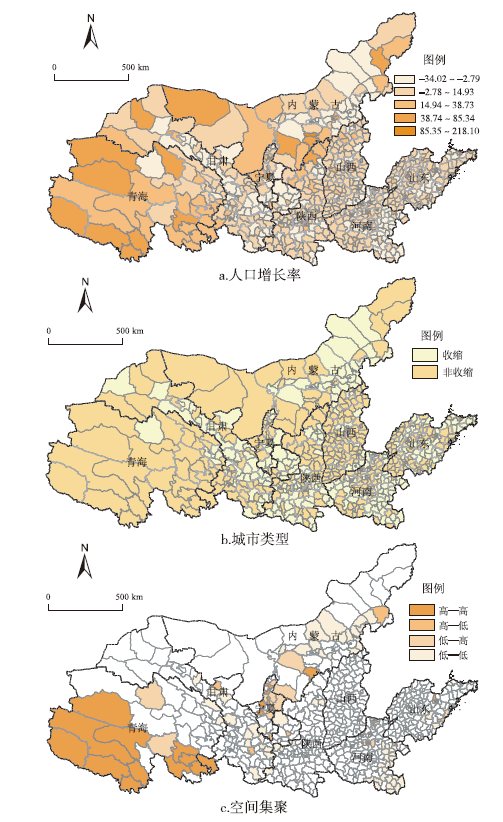
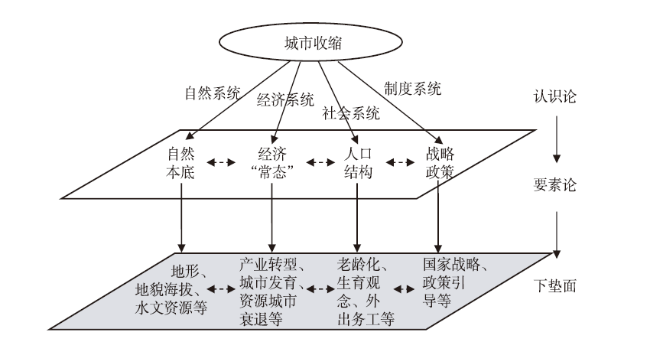
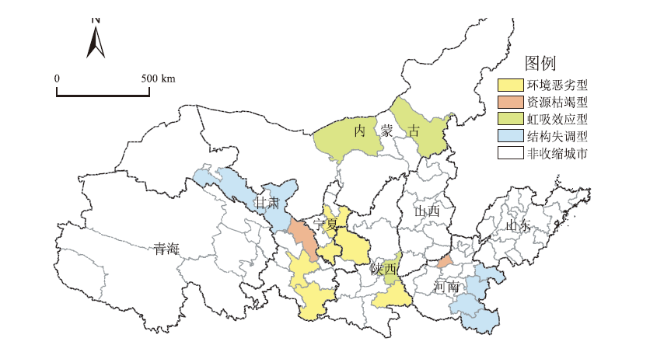
The Symposium on ecological protection and high-quality development of the Yellow River Basin clearly put forward the idea of "promoting high-quality development of the Yellow River Basin". In the context of economic and urban development mode transformation,it is of great practical significance to analyze the spatial characteristics and influencing factors of urban contraction in the Yellow River Basin. Based on the data of the fifth and sixth national census,the research studies the spatial characteristics and influencing factors of urban shrinkage in different levels of administrative units in the Yellow River Eco-economic Blet. The results show that:1) In the administrative units of the Yellow River Basin,17 prefecture level cities are shrinking,accounting for 18.68% of the total amount of cities; 23 municipal districts are shrinking,accounting for 11.79% of the total amount of municipal districts; 231 municipal counties are shrinking,accounting for 42.46% of the total amount of municipal counties. 2) Urban shrinkage can be divided into three types:isolated shrinkage,continuous shrinkage and staggered shrinkage. Among them,isolated shrinkage mainly includes parts of cities,districts and counties in Qinghai,Shandong and Shanxi Province,continuous shrinkage mainly includes parts of cities,districts and counties in Gansu,Inner Mongolia and Henan Province,and staggered shrinkage mainly includes parts of cities,districts and counties in Ningxia and Shaanxi Province. 3) The factors such as natural background conditions and government policies,insufficient supply side of population in the transformation of industrial structure,the change of age class structure and family structure of population,the lack of development of central cities and the weak radiation driving ability together led to the contraction of some cities in the Yellow River Basin,but there are still typical heterogeneity within them.
表1 孤点式城市收缩的人口年龄结构特征Tab.1 Characteristics of age structure of urban population with complete shrinkage |
| 地市 | 0~14岁(%) | 15~64岁(%) | ≥65岁(%) | ||||||||
|---|---|---|---|---|---|---|---|---|---|---|---|
| 2000 | 2010 | 增长率 | 2000 | 2010 | 增长率 | 2000 | 2010 | 增长率 | |||
| 湟中县 | 26.44 | 21.13 | -20.08 | 68.94 | 72.76 | 5.54 | 4.62 | 6.11 | 32.14 | ||
| 平安县 | 25.67 | 19.39 | -24.46 | 69.56 | 72.77 | 4.61 | 4.77 | 7.85 | 64.62 | ||
| 乐都县 | 26.15 | 18.12 | -30.70 | 68.53 | 74.16 | 8.22 | 5.33 | 7.73 | 45.13 | ||
| 化隆回族自治县 | 30.84 | 27.81 | -9.830 | 65.07 | 66.20 | 1.74 | 4.09 | 5.99 | 46.51 | ||
| 德令哈市 | 22.61 | 18.40 | -18.63 | 74.99 | 76.99 | 2.66 | 2.39 | 4.61 | 92.57 | ||
| 牟平区 | 16.77 | 9.70 | -42.16 | 73.85 | 77.43 | 4.85 | 9.38 | 12.88 | 37.33 | ||
| 利津县 | 22.19 | 15.29 | -31.08 | 69.72 | 73.99 | 6.13 | 8.09 | 10.72 | 32.43 | ||
| 莒县 | 23.53 | 17.99 | -23.53 | 67.81 | 71.03 | 4.74 | 8.66 | 10.98 | 26.80 | ||
| 蒙阴县 | 23.15 | 17.52 | -24.33 | 69.86 | 70.87 | 1.44 | 6.98 | 11.61 | 66.27 | ||
| 荣成市 | 16.80 | 10.01 | -40.42 | 72.90 | 76.37 | 4.76 | 10.30 | 13.62 | 32.26 | ||
| 左云县 | 28.00 | 17.73 | -36.68 | 66.94 | 75.00 | 12.05 | 5.06 | 7.27 | 43.56 | ||
| 平顺县 | 27.36 | 16.94 | -38.09 | 66.57 | 75.61 | 13.59 | 6.07 | 7.45 | 22.67 | ||
| 五寨县 | 25.85 | 16.46 | -36.33 | 66.89 | 75.53 | 12.92 | 7.26 | 8.01 | 10.37 | ||
| 襄汾县 | 27.64 | 17.45 | -36.86 | 66.05 | 74.02 | 12.07 | 6.32 | 8.53 | 35.06 | ||
| 古交市 | 27.71 | 17.30 | -37.56 | 67.95 | 76.67 | 12.83 | 4.34 | 6.03 | 38.92 | ||
表2 孤点式城市收缩的人口就业结构特征Tab.2 Characteristics of employment structure of urban population with complete shrinkage |
| 地市 | 第一产业(%) | 第二产业(%) | 第三产业(%) | ||||||||
|---|---|---|---|---|---|---|---|---|---|---|---|
| 2000 | 2010 | 增长率 | 2000 | 2010 | 增长率 | 2000 | 2010 | 增长率 | |||
| 湟中县 | 88.34 | 73.47 | -16.83 | 4.52 | 11.13 | 146.24 | 7.14 | 15.41 | 115.83 | ||
| 平安县 | 64.37 | 45.47 | -29.36 | 14.81 | 18.49 | 24.85 | 20.82 | 36.04 | 73.10 | ||
| 乐都县 | 86.73 | 74.04 | -14.63 | 4.96 | 11.18 | 125.40 | 8.31 | 14.77 | 77.74 | ||
| 化隆回族自治县 | 92.92 | 75.22 | -19.05 | 1.28 | 8.29 | 547.66 | 5.80 | 16.49 | 184.31 | ||
| 德令哈市 | 32.75 | 34.97 | 6.78 | 33.40 | 27.39 | -17.99 | 33.85 | 37.64 | 11.20 | ||
| 牟平区 | 61.89 | 59.29 | -4.20 | 22.51 | 21.44 | -4.75 | 15.61 | 19.27 | 23.45 | ||
| 利津县 | 79.20 | 71.51 | -9.71 | 6.54 | 10.24 | 56.57 | 14.26 | 18.25 | 27.98 | ||
| 莒县 | 82.12 | 79.92 | -2.68 | 8.77 | 9.94 | 13.34 | 9.11 | 10.14 | 11.31 | ||
| 蒙阴县 | 75.35 | 75.28 | -0.09 | 12.09 | 10.83 | -10.42 | 12.56 | 13.88 | 10.51 | ||
| 荣成市 | 56.76 | 49.61 | -12.60 | 26.31 | 28.07 | 6.69 | 16.92 | 22.32 | 31.91 | ||
| 左云县 | 44.46 | 49.22 | 10.71 | 33.26 | 12.83 | -61.43 | 22.28 | 37.96 | 70.38 | ||
| 平顺县 | 88.51 | 75.09 | -15.16 | 2.75 | 9.58 | 248.36 | 8.74 | 15.33 | 75.40 | ||
| 五寨县 | 79.30 | 71.36 | -10.01 | 3.58 | 3.87 | 8.10 | 17.12 | 24.78 | 44.74 | ||
| 襄汾县 | 79.36 | 77.10 | -2.85 | 9.29 | 9.41 | 1.29 | 11.35 | 13.49 | 18.85 | ||
| 古交市 | 25.84 | 16.15 | -37.50 | 46.34 | 51.21 | 10.51 | 27.82 | 32.64 | 17.33 | ||
表3 连绵式城市收缩的人口年龄结构特征Tab.3 Characteristics of age structure of urban population with marginal shrinkage |
| 地市 | 0~14岁(%) | 15~64岁(%) | ≥65岁(%) | ||||||||
|---|---|---|---|---|---|---|---|---|---|---|---|
| 2000 | 2010 | 增长率 | 2000 | 2010 | 增长率 | 2000 | 2010 | 增长率 | |||
| 皋兰县 | 27.86 | 16.73 | -39.94 | 66.74 | 73.35 | 9.91 | 5.41 | 9.92 | 83.42 | ||
| 景泰县 | 29.60 | 16.93 | -42.80 | 66.15 | 75.54 | 14.19 | 4.25 | 7.53 | 77.13 | ||
| 清水县 | 29.89 | 24.02 | -19.64 | 65.59 | 69.13 | 5.40 | 4.52 | 6.85 | 51.42 | ||
| 民乐县 | 25.74 | 19.67 | -23.58 | 70.14 | 73.62 | 4.97 | 4.13 | 6.71 | 62.66 | ||
| 临洮县 | 26.98 | 16.26 | -39.72 | 67.59 | 75.04 | 11.02 | 5.43 | 8.70 | 60.18 | ||
| 九原区 | 21.84 | 16.65 | -23.76 | 72.89 | 77.39 | 6.18 | 5.27 | 5.96 | 12.99 | ||
| 武川县 | 21.31 | 13.41 | -37.06 | 70.78 | 75.03 | 6.00 | 7.91 | 11.55 | 46.03 | ||
| 凉城县 | 21.20 | 14.43 | -31.94 | 69.95 | 74.70 | 6.79 | 8.85 | 10.87 | 22.83 | ||
| 阿巴嘎旗 | 20.92 | 12.79 | -38.85 | 74.89 | 80.97 | 8.11 | 4.19 | 6.24 | 48.87 | ||
| 杭锦旗 | 20.70 | 13.66 | -34.00 | 72.76 | 77.07 | 5.92 | 6.54 | 9.27 | 41.68 | ||
| 吉利区 | 20.97 | 16.74 | -20.18 | 73.44 | 74.52 | 1.46 | 5.58 | 8.74 | 56.52 | ||
| 睢阳区 | 27.19 | 20.58 | -24.32 | 65.73 | 70.92 | 7.90 | 7.08 | 8.50 | 20.10 | ||
| 卢氏县 | 24.31 | 17.07 | -29.78 | 69.17 | 75.18 | 8.69 | 6.52 | 7.76 | 18.96 | ||
| 潢川县 | 30.77 | 23.00 | -25.24 | 63.54 | 68.35 | 7.58 | 5.70 | 8.65 | 51.82 | ||
| 荥阳市 | 25.09 | 16.15 | -35.64 | 66.90 | 74.86 | 11.90 | 8.01 | 8.99 | 12.27 | ||
表4 连绵式城市收缩的人口就业结构特征Tab.4 Characteristics of employment structure of urban population with marginal shrinkage |
| 地市 | 第一产业(%) | 第二产业(%) | 第三产业(%) | ||||||||
|---|---|---|---|---|---|---|---|---|---|---|---|
| 2000 | 2010 | 增长率 | 2000 | 2010 | 增长率 | 2000 | 2010 | 增长率 | |||
| 皋兰县 | 82.03 | 76.51 | -6.73 | 5.76 | 7.49 | 30.03 | 12.22 | 16.00 | 30.93 | ||
| 景泰县 | 82.22 | 73.10 | -11.09 | 5.34 | 7.70 | 44.19 | 12.44 | 19.20 | 54.34 | ||
| 清水县 | 92.86 | 87.17 | -6.13 | 1.30 | 3.89 | 199.23 | 5.84 | 8.94 | 53.08 | ||
| 民乐县 | 91.05 | 85.84 | -5.72 | 1.96 | 3.99 | 103.57 | 6.99 | 10.17 | 45.49 | ||
| 临洮县 | 92.07 | 84.89 | -7.80 | 2.15 | 4.58 | 113.02 | 5.78 | 10.53 | 82.18 | ||
| 九原区 | 52.71 | 23.40 | -55.61 | 23.83 | 32.62 | 36.89 | 23.46 | 43.98 | 87.47 | ||
| 武川县 | 81.65 | 70.43 | -13.74 | 4.48 | 8.17 | 82.37 | 13.87 | 21.39 | 54.22 | ||
| 凉城县 | 82.94 | 81.51 | -1.72 | 5.72 | 5.36 | -6.29 | 11.35 | 13.13 | 15.68 | ||
| 阿巴嘎旗 | 59.00 | 57.08 | -3.25 | 8.43 | 9.78 | 16.01 | 32.57 | 33.14 | 1.75 | ||
| 杭锦旗 | 69.29 | 51.77 | -25.29 | 9.27 | 13.83 | 49.19 | 21.44 | 34.40 | 60.45 | ||
| 吉利区 | 36.54 | 21.51 | -41.13 | 33.58 | 36.85 | 9.74 | 29.88 | 41.65 | 39.39 | ||
| 睢阳区 | 88.26 | 70.93 | -19.64 | 3.25 | 12.76 | 292.62 | 8.50 | 16.30 | 91.76 | ||
| 卢氏县 | 88.46 | 86.83 | -1.84 | 2.33 | 3.38 | 45.06 | 9.21 | 9.78 | 6.19 | ||
| 潢川县 | 79.74 | 66.54 | -16.55 | 6.67 | 13.68 | 105.10 | 13.59 | 19.78 | 45.55 | ||
| 荥阳市 | 76.19 | 50.94 | -33.14 | 11.82 | 26.40 | 123.35 | 11.99 | 22.65 | 88.91 | ||
表5 交错式城市收缩的人口年龄结构特征Tab.5 Characteristics of age structure of urban population with spotted shrinkage |
| 地市 | 0~14岁(%) | 15~64岁(%) | ≥65岁(%) | ||||||||
|---|---|---|---|---|---|---|---|---|---|---|---|
| 2000 | 2010 | 增长率 | 2000 | 2010 | 增长率 | 2000 | 2010 | 增长率 | |||
| 平罗县 | 24.01 | 18.27 | -23.90 | 70.60 | 74.23 | 5.15 | 5.39 | 7.50 | 39.02 | ||
| 盐池县 | 27.01 | 21.26 | -21.30 | 69.00 | 72.31 | 4.80 | 3.99 | 6.42 | 60.90 | ||
| 同心县 | 37.48 | 29.76 | -20.59 | 59.16 | 65.42 | 10.58 | 3.36 | 4.82 | 43.34 | ||
| 西吉县 | 37.58 | 31.04 | -17.41 | 58.45 | 62.44 | 6.82 | 3.96 | 6.53 | 64.77 | ||
| 隆德县 | 32.47 | 22.15 | -31.77 | 62.78 | 69.93 | 11.38 | 4.75 | 7.92 | 66.72 | ||
| 彭阳县 | 32.70 | 25.4 | -22.33 | 63.24 | 67.57 | 6.85 | 4.06 | 7.04 | 73.54 | ||
| 碑林区 | 12.82 | 9.37 | -26.90 | 78.96 | 78.96 | 0.00 | 8.22 | 11.66 | 41.85 | ||
| 临渭区 | 24.52 | 14.43 | -41.16 | 69.24 | 76.46 | 10.43 | 6.24 | 9.11 | 46.08 | ||
| 蓝田县 | 28.79 | 18.89 | -34.38 | 64.29 | 71.60 | 11.36 | 6.92 | 9.52 | 37.57 | ||
| 周至县 | 28.61 | 17.24 | -39.73 | 66.00 | 73.89 | 11.96 | 5.40 | 8.87 | 64.37 | ||
| 宜君县 | 25.92 | 13.8 | -46.76 | 68.36 | 78.01 | 14.12 | 5.72 | 8.18 | 42.92 | ||
| 凤翔县 | 26.88 | 14.71 | -45.28 | 67.35 | 76.34 | 13.35 | 5.77 | 8.96 | 55.21 | ||
| 扶风县 | 27.85 | 15.66 | -43.77 | 66.95 | 75.78 | 13.20 | 5.20 | 8.56 | 64.53 | ||
| 太白县 | 24.76 | 14.13 | -42.94 | 70.35 | 78.22 | 11.18 | 4.89 | 7.65 | 56.57 | ||
| 乾县 | 28.67 | 16.78 | -41.47 | 66.20 | 74.21 | 12.10 | 5.13 | 9.01 | 75.66 | ||
表6 交错式城市收缩的人口就业结构特征Tab.6 Characteristics of employment structure of urban population with spotted shrinkage |
| 地市 | 第一产业(%) | 第二产业(%) | 第三产业(%) | ||||||||
|---|---|---|---|---|---|---|---|---|---|---|---|
| 2000 | 2010 | 增长率 | 2000 | 2010 | 增长率 | 2000 | 2010 | 增长率 | |||
| 平罗县 | 69.55 | 62.74 | -9.79 | 12.46 | 15.33 | 23.03 | 17.98 | 21.93 | 21.97 | ||
| 盐池县 | 67.02 | 58.98 | -12.00 | 12.30 | 14.32 | 16.42 | 20.69 | 26.70 | 29.05 | ||
| 同心县 | 84.99 | 84.03 | -1.13 | 3.38 | 5.33 | 57.69 | 11.63 | 10.64 | -8.51 | ||
| 西吉县 | 93.05 | 87.72 | -5.73 | 1.43 | 3.40 | 137.76 | 5.53 | 8.88 | 60.58 | ||
| 隆德县 | 81.07 | 71.70 | -11.56 | 8.66 | 14.47 | 67.09 | 10.27 | 13.83 | 34.66 | ||
| 彭阳县 | 88.15 | 80.28 | -8.93 | 3.81 | 8.18 | 114.70 | 8.04 | 11.54 | 43.53 | ||
| 碑林区 | 0.17 | 0.42 | 147.06 | 24.19 | 16.32 | -32.53 | 75.64 | 83.26 | 10.07 | ||
| 临渭区 | 75.87 | 68.23 | -10.07 | 8.27 | 10.12 | 22.37 | 15.86 | 21.66 | 36.57 | ||
| 蓝田县 | 85.94 | 70.78 | -17.64 | 4.76 | 10.47 | 119.96 | 9.29 | 18.75 | 101.83 | ||
| 周至县 | 85.56 | 71.00 | -17.02 | 4.97 | 11.16 | 124.55 | 9.48 | 17.84 | 88.19 | ||
| 宜君县 | 83.30 | 73.22 | -12.10 | 3.89 | 6.16 | 58.35 | 12.81 | 20.62 | 60.97 | ||
| 凤翔县 | 79.57 | 60.42 | -24.07 | 9.35 | 19.26 | 105.99 | 11.09 | 20.32 | 83.23 | ||
| 扶风县 | 78.58 | 59.89 | -23.78 | 10.40 | 21.72 | 108.85 | 11.02 | 18.40 | 66.97 | ||
| 太白县 | 74.99 | 64.35 | -14.19 | 10.02 | 15.67 | 56.39 | 14.99 | 19.98 | 33.29 | ||
| 乾县 | 85.61 | 79.91 | -6.66 | 5.80 | 8.85 | 52.59 | 8.59 | 11.24 | 30.85 | ||
| [1] |
|
| [2] |
|
| [3] |
|
| [4] |
龙瀛, 李郇. 收缩城市:国际经验和中国现实[J]. 现代城市研究, 2015(9):1.
|
| [5] |
|
| [6] |
|
| [7] |
|
| [8] |
|
| [9] |
|
| [10] |
|
| [11] |
|
| [12] |
|
| [13] |
|
| [14] |
|
| [15] |
|
| [16] |
张学良, 刘玉博, 吕存超. 中国城市收缩的背景、识别与特征分析[J]. 东南大学学报:哲学社会科学版, 2016, 18(4):132-139.
|
| [17] |
吴康, 孙东琪. 城市收缩的研究进展与展望[J]. 经济地理, 2017, 37(11):59-67.
|
| [18] |
刘合林. 收缩城市量化计算方法进展[J]. 现代城市研究, 2016(2):17-22.
|
| [19] |
|
| [20] |
杜志威, 李郇. 收缩城市的形成与规划启示:基于新马克思主义城市理论的视角[J]. 规划师, 2017, 33(1):5-11.
|
| [21] |
|
| [22] |
|
| [23] |
|
| [24] |
|
| [25] |
|
| [26] |
|
| [27] |
|
| [28] |
李郇, 吴康, 龙瀛, 等. 局部收缩:后增长时代下的城市可持续发展争鸣[J]. 地理研究, 2017, 36(10):1997-2 016.
|
| [29] |
林雄斌, 杨家文, 张衔春, 等. 我国城市收缩测度与影响因素分析:基于人口与经济变化的视角[J]. 人文地理, 2017, 32(1):82-89.
|
| [30] |
周恺, 钱芳芳, 严妍. 湖南省多地理尺度下的人口“收缩地图”[J]. 地理研究, 2017, 36(2):267-280.
|
| [31] |
张学良, 张明斗, 肖航. 成渝城市群城市收缩的空间格局与形成机制研究[J]. 重庆大学学报:社会科学版, 2018, 24(6):1-14.
|
| [32] |
张伟, 单芬芬, 郑财贵, 等. 我国城市收缩的多维度识别及其驱动机制分析[J]. 城市发展研究, 2019, 26(3):32-40.
|
| [33] |
|
| [34] |
张莉. 增长的城市与收缩的区域:我国中西部地区人口空间重构——以四川省与河南省信阳市为例[J]. 城市发展研究, 2015, 22(9):74-80.
|
| [35] |
吴康, 龙瀛, 杨宇. 京津冀与长江三角洲的局部收缩:格局、类型与影响因素识别[J]. 现代城市研究, 2015, 30(9):26-35.
|
/
| 〈 |
|
〉 |

