
中国文化产业与旅游产业协调态势及其驱动力
|
刘安乐(1988—),男,湖北黄冈人,博士研究生,副教授。主要研究方向为区域旅游效应。E-mail:Liuanle34@163.com。 |
收稿日期: 2019-06-02
修回日期: 2020-03-08
网络出版日期: 2025-05-14
基金资助
国家自然科学基金项目(41961021)
国家自然科学基金项目(41671147)
国家社会科学基金项目(19CGL029)
云南省社会科学界联合会智库重大项目(SHZK2019104)
云南省哲学社会科学重大项目(ZDZB201802)
贵州省教育科学规划项目(2017C038)
云南财经大学研究生创新基金项目(2019YUFEY034)
Spatial-Temporal Coordination and Driving Forces of Provincial Culture Industry and Tourism Industry in China
Received date: 2019-06-02
Revised date: 2020-03-08
Online published: 2025-05-14
刘安乐 , 杨承玥 , 明庆忠 , 张红梅 , 陆保一 . 中国文化产业与旅游产业协调态势及其驱动力[J]. 经济地理, 2020 , 40(6) : 203 -213 . DOI: 10.15957/j.cnki.jjdl.2020.06.022
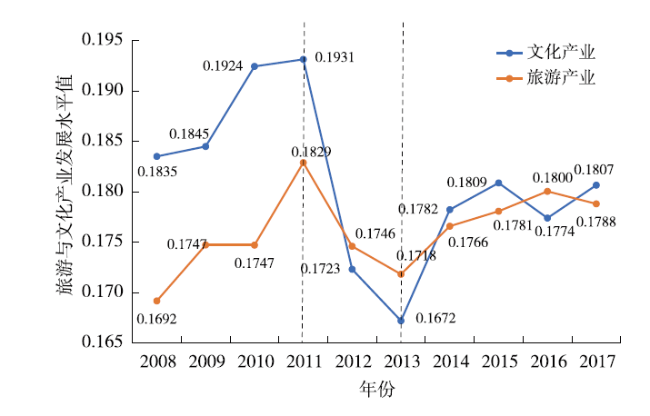
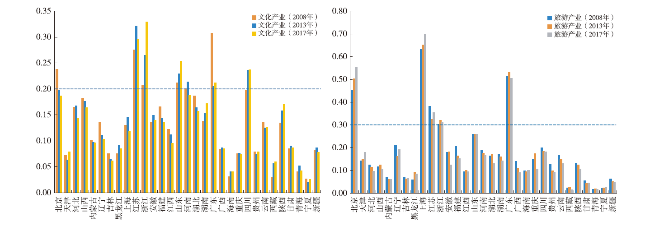
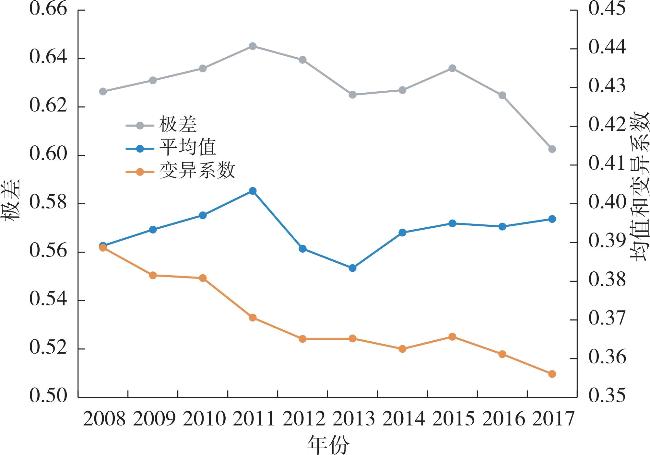
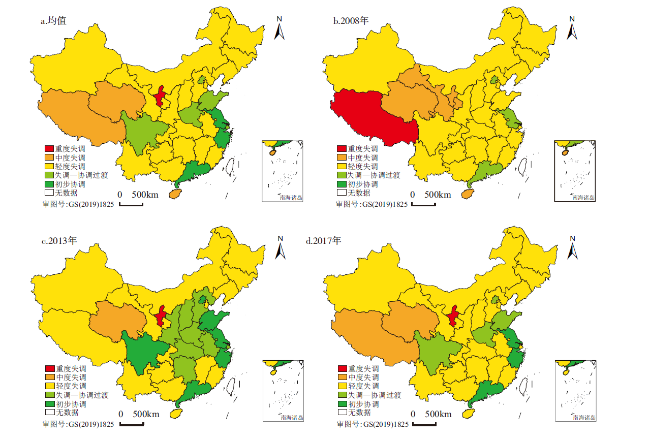
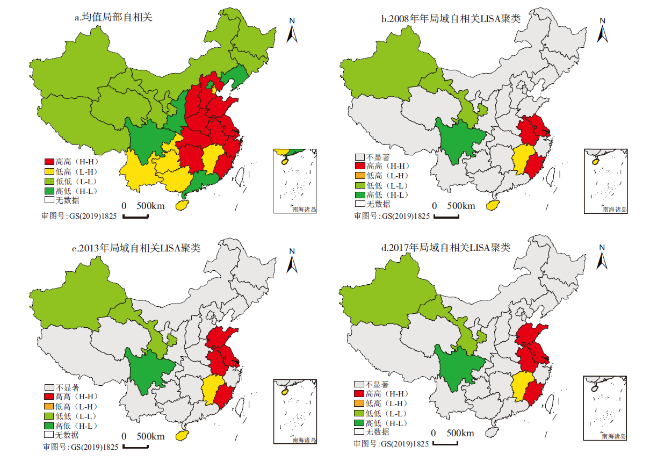
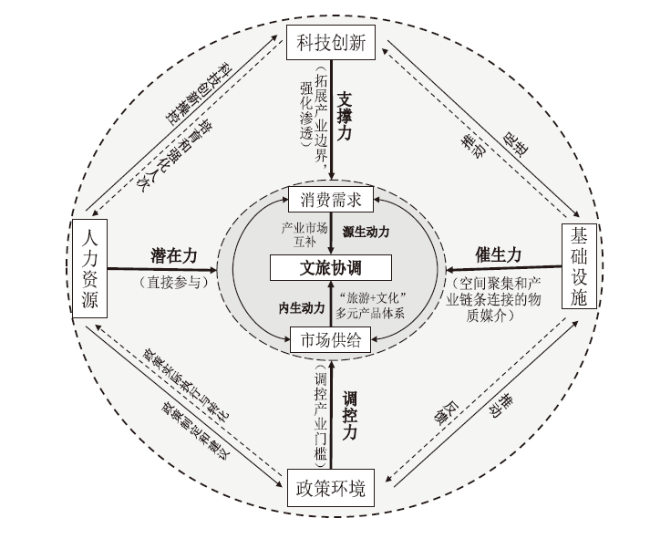
Constructing a comprehensive evaluation index system for the development of culture and tourism industry from the perspective of industrial integration. Chooses coordination model,exploratory spatial data analysis and spatial error model (SEM) by the entropy method,and the tools of ArcGIS 10.2 and GeoDa. This paper estimated the comprehensive development level of culture and tourism industry among 31 provinces in China from 2008 to 2017.The space-time differentiation characteristics of its coordination degree are discussed,and the dynamic mechanism of its coupling coordination is explored. The results show that: 1) From 2008 to 2017,the average value of cultural and tourism industry development in 31 provinces and cities in China experienced three stages: rising,declining and slowly rising with the nodes of 2011 and 2013,and the level of cultural and tourism industry development is significantly related to the government's policy conditions. From the perspective of spatial differences,the development level of Chinese culture and tourism industry showed a decreasing rule from coastal to inland as a whole.2) From 2008 to 2017,the coordination degree of the two showed a fluctuating upward trend,which was a good trend; the level of the coupling coordination degree was relatively low,the disorder-coordination transition level and the slight coordination level accounted for the biggest proportion; the inter-provincial differences of the coupling coordination degree showed a decreasing trend over time,and the equilibrium trend appeared.3) The global and local spatial correlation of coordination degree between cultural industry and tourism industry in 2008-2017 is significant. the local autocorrelation pattern showed the evolution characteristics over time,and the provincial scope of H-H region. However,its regional center of gravity was still in the Yangtze River Delta region. The distribution of L-H region was scattered and its scope was reducing. The provincial scope of L-L and H-L regions has remained stable for a long time. 4) Consumption demand,market supply,market scientific and technological innovation,policy environment,infrastructure and human resources are all important driving forces for the coupling of culture and tourism industry. Consumption demand is the strongest driving force for the coupling of culture and tourism industry. However,the policy environment has not yet played its due role in regulating and driving,and Infrastructure development has shown a negative catalytic driving effect.
表1 旅游产业与文化产业协调度等级划分标准Tab.1 Classification standard of coordination degree between tourism industry and cultural |
| 重度失调 | 中度失调 | 轻度失调 | 失调—协调过渡 | 初步协调 | 良好协调 | 优质协调 |
|---|---|---|---|---|---|---|
| (0,0.15] | (0.15,0.25] | (0.25,0.45] | (0.45,0.55] | (0.55,0.75] | (0.75,0.85] | (0.85,1] |
表2 文化产业和旅游产业综合评价指标体系Tab.2 Comprehensive evaluation index system of cultural industry and tourism industry |
| 产业类型 | 产业指标 | 具体指标 | 单位 |
|---|---|---|---|
| 文化产业WH | 文化产业基础 | WH1国家级非物质文化遗产数 | 个 |
| WH2文物业藏品数 | 件 | ||
| WH3万人拥有公共图书馆数 | 个/万人 | ||
| WH4万人拥有博物馆数 | 个/万人 | ||
| WH5万人拥有艺术表演场馆数 | 个/万人 | ||
| 文化产业人力资本 | WH6文化从业人数占总业人员比 | % | |
| WH7文化部门教育毕业生数 | 人 | ||
| 文化产业效应 | WH8文化及相关产业投资 | 亿元 | |
| WH9人均事业经费 | 元/人 | ||
| WH10文化文物机构总收入 | 千元 | ||
| WH11艺术表演团体演出收入 | 万元 | ||
| WH12博物馆接待参观人数 | 千人次 | ||
| WH13艺术表演场馆观众 | 人次 | ||
| WH14文化与相关产业企业数 | 个 | ||
| 旅游产业LY | 旅游产业基础 | LY1 5A级旅游景区 | 个 |
| LY2万人拥有星级酒店数 | 个/万人 | ||
| LY3万人拥有旅行社数 | 个/万人 | ||
| LY4万人拥有住宿、餐饮企业数 | 个/万人 | ||
| 旅游产业人力资本 | LY5旅游从业人占从业人员比 | % | |
| LY6旅游院校学生数 | 人 | ||
| 旅游产业效应 | LY7国内旅游收入 | 万元 | |
| LY8旅游外汇收入 | 百万美元 | ||
| LY9旅游总收入占GDP比重 | % | ||
| LY10旅行社营业收入 | 万元 | ||
| LY11星级酒店营业收入 | 万元 | ||
| LY12国内旅游人次 | 万人次 | ||
| LY13接待国际游客 | 百万人次 | ||
| LY14住宿餐饮增加值 | 亿元 |
表3 2008—2017年文化产业与旅游产业协调度各等级比重(%)Tab.3 Proportion of coordination degree between cultural industry and tourism industry at different levels in 2008-2017(%) |
| 类型 | 2008 | 2009 | 2010 | 2011 | 2012 | 2013 | 2014 | 2015 | 2016 | 2017 |
|---|---|---|---|---|---|---|---|---|---|---|
| 初步协调 | 0.00 | 0.00 | 9.68 | 6.45 | 9.68 | 16.13 | 19.35 | 12.90 | 12.90 | 6.45 |
| 失调—协调过渡 | 9.68 | 12.90 | 16.13 | 16.13 | 16.13 | 19.35 | 25.81 | 22.58 | 16.13 | 12.90 |
| 轻度失调 | 74.19 | 70.97 | 61.29 | 64.52 | 61.29 | 54.84 | 48.39 | 58.06 | 58.06 | 67.74 |
| 中度失调 | 12.90 | 16.13 | 12.90 | 9.68 | 9.68 | 9.68 | 6.45 | 6.45 | 9.68 | 6.45 |
| 重度失调 | 3.23 | 0.00 | 0.00 | 3.23 | 3.23 | 0.00 | 0.00 | 0.00 | 3.23 | 3.23 |
表4 Moran's I指数检验结果Tab.4 Moran's I index test results |
| 年份 | 2008 | 2009 | 2010 | 2011 | 2012 | 2013 | 2014 | 2015 | 2016 | 2017 |
|---|---|---|---|---|---|---|---|---|---|---|
| Moran I | 0.1495 | 0.1595 | 0.1442 | 0.1625 | 0.1666 | 0.1573 | 0.1623 | 0.1631 | 0.1573 | 0.1496 |
| z | 2.3559 | 2.4791 | 2.2837 | 2.5202 | 2.5679 | 2.4498 | 2.5147 | 2.5294 | 2.4553 | 2.3530 |
| p | 0.0185 | 0.0132 | 0.0224 | 0.0117 | 0.0102 | 0.0143 | 0.0119 | 0.0114 | 0.0141 | 0.0186 |
表5 文化产业与旅游产业协调协调驱动力指标体系与描述性统计Tab.5 Driving force index system and descriptive statistics of coupling and coordination between cultural industry and tourism industry |
| 变量 | 变量定义与代理变量 | AVG | Std | MAX | MIN | |
|---|---|---|---|---|---|---|
| 被解释变量 | D2017 | 文化与旅游产业协调度 | 0.381 | 0.110 | 0.586 | 0.152 |
| 解释变量 | XFXQ | 消费需求:人均消费支出对数 | 9.981 | 0.372 | 10.890 | 9.305 |
| SCGJ | 市场供给:文旅行业固定投资占GDP比 | 2.434 | 0.917 | 5.524 | 0.976 | |
| KJCX | 科技创新:科技财政支出对数 | 4.410 | 1.077 | 6.714 | 2.139 | |
| ZCHJ | 政策环境:全社会固定投资利用外资率 | 0.323 | 0.492 | 2.875 | 0.025 | |
| JCSS | 基础设施:公路交通里程/国土面积 | 0.034 | 0.028 | 0.138 | 0.003 | |
| RLZY | 人力资源:在校本科生数对数 | 3.697 | 0.916 | 4.706 | 0.884 |
表6 空间误差模型SEM选择检验和估计结果Tab.6 Selection test and estimation results of Spatial Error Model by SEM |
| 变量 | Coefficient | St. Error | z-value | Probability |
|---|---|---|---|---|
| CONSTANT | -1.5620 | 0.4097 | -3.8126 | 0.0001 |
| XFXQ(消费需求) | 0.1459 | 0.0455 | 3.2053 | 0.0014 |
| SCGJ(市场供给) | 0.0217 | 0.0096 | 2.2748 | 0.0229 |
| KJCX(科技创新) | 0.0393 | 0.0165 | 2.3778 | 0.0174 |
| ZCHJ(政策环境) | 0.0036 | 0.0133 | 0.2689 | 0.7880 |
| JCSS(基础设施) | -1.8474 | 0.3670 | -5.0341 | 0.0000 |
| RLZY(人力资源) | 0.1002 | 0.0110 | 9.1137 | 0.0000 |
| LAMBDA | 0.8607 | 0.0780 | 11.0289 | 0.0000 |
| R2 | 0.88421 | AIC | -91.8928 | |
| Log likelihood | 52.94639 | SC | -81.8549 | |
| Likelihood Ratio(p) | 15.374(0.00009) | |||
| Moran's I (error) | 0.3477(0.00018) z=3.7428 | |||
| Lagrange Multiplier-lag (p) | 2.0466(0.15255) | |||
| Robust LM-lag (p) | 0.0073(0.93201) | |||
| Lagrange Multiplier-error (p) | 8.0022(0.00467) | |||
| Robust LM-error (p) | 5.9629(0.01461) | |||
| Lagrange Multiplier SARMA(P) | 8.0095(0.01823) | |||
| [1] |
|
| [2] |
|
| [3] |
|
| [4] |
|
| [5] |
|
| [6] |
|
| [7] |
|
| [8] |
翁钢民, 李凌雁. 中国旅游与文化产业融合发展的耦合协调度及空间相关分析[J]. 经济地理, 2016, 36(1):178-185.
|
| [9] |
曲景慧. 中国文化产业与旅游产业融合发展的时空变动分析[J]. 生态经济, 2016, 32(9):129-134.
|
| [10] |
侯兵, 周晓倩. 长三角地区文化产业与旅游产业融合态势测度与评价[J]. 经济地理, 2015, 35(11):211-217.
|
| [11] |
段兆雯, 王媛媛. 西北五省(区)旅游与文化产业融合度研究[J]. 河南科学, 2017, 35(12):2055-2 061.
|
| [12] |
张琰飞, 朱海英,
|
| [13] |
韩璐, 明庆忠. 边境地区民族文化旅游发展模式研究[J]. 四川民族学院学报, 2018, 27(4):54-64.
|
| [14] |
王兆峰. 民族文化产业与旅游业耦合发展研究——以湖南湘西为例[J]. 中央民族大学学报:哲学社会科学版, 2012, 39(6):31-37.
|
| [15] |
尹华光, 王换茹, 姚云贵. 武陵山片区文化产业与旅游产业融合发展模式研究[J]. 中南民族大学学报:人文社会科学版, 2015, 35(4):39-43.
|
| [16] |
黄蕊, 侯丹. 东北三省文化与旅游产业融合的动力机制与发展路径[J]. 当代经济研究, 2017, 28(10):81-89.
|
| [17] |
赵蕾, 余汝艺. 旅游产业与文化产业融合的动力系统研究[J]. 安徽农业大学学报:社会科学版, 2015, 24(1):66-71.
|
| [18] |
但红燕, 徐武明. 旅游产业与文化产业融合动因及其效应分析——以四川为例[J]. 生态经济, 2015, 31(7):110-113,117.
|
| [19] |
徐翠蓉, 张广海. 中国文化产业与旅游业发展的交互动态响应分析[J]. 统计与决策, 2018, 34(23):143-146.
|
| [20] |
宋瑞. 文化和旅游:多视角的透视[J]. 旅游学刊, 2019, 34(4):1-3.
|
| [21] |
徐金海. 文化和旅游关系刍论:幸福的视角[J]. 旅游学刊, 2019, 34(4):3-5.
|
| [22] |
宋子千. 从国家政策看文化和旅游的关系[J]. 旅游学刊, 2019, 34(4):5-7.
|
| [23] |
马勇, 童昀. 从区域到场域:文化和旅游关系的再认识[J]. 旅游学刊, 2019, 34(4):7-9.
|
| [24] |
毕绪龙. 从人才培养角度看文化和旅游的关系[J]. 旅游学刊, 2019, 34(4):9-10.
|
| [25] |
陈怡宁, 李刚. 空间生产视角下的文化和旅游关系探讨——以英国博物馆为例[J]. 旅游学刊, 2019, 34(4):11-12.
|
| [26] |
刘安乐, 杨承玥, 明庆忠. 区域城镇发展质量综合测度及空间自相关研究[J]. 六盘水师范学院学报, 2016, 28(1):1-6.
|
| [27] |
刘安乐, 王成, 杨承玥, 等. 边疆山区旅游城市的交通与旅游发展耦合关系——以丽江市为实证案例[J]. 经济地理, 2018, 38(1):196-203.
|
| [28] |
|
| [29] |
周春波. 文化产业与旅游产业融合动力:理论与实证[J]. 企业经济, 2018, 38(8):146-151.
|
| [30] |
赵传松, 任建兰, 陈延斌, 等. 全域旅游背景下中国省域旅游产业与区域发展时空耦合及驱动力[J]. 中国人口·资源与环境, 2018, 28(3):149-159.
|
| [31] |
李维维, 陈田, 马晓龙. 中国旅游化与城市化耦合协调关系的省际格局及形成机制分析[J]. 旅游科学, 2018, 32(5):14-29,80.
|
| [32] |
|
/
| 〈 |
|
〉 |