
黄河流域城市群形成发育的空间组织格局与高质量发展
|
方创琳(1966—),男,甘肃庆阳人,研究员,博士生导师。主要研究方向为城市地理、城市群发展与城镇化的资源环境效应等。E-mail:fangcl@igsnrr.ac.cn。 |
收稿日期: 2020-05-23
修回日期: 2020-06-18
网络出版日期: 2025-05-14
基金资助
国家自然科学基金专项项目(41942004)
国家自然科学基金重大项目(41590840)
国家自然科学基金重大项目(41590842)
Spatial Organization Pattern and High-Quality Development of Urban Agglomeration in the Yellow River Basin
Received date: 2020-05-23
Revised date: 2020-06-18
Online published: 2025-05-14
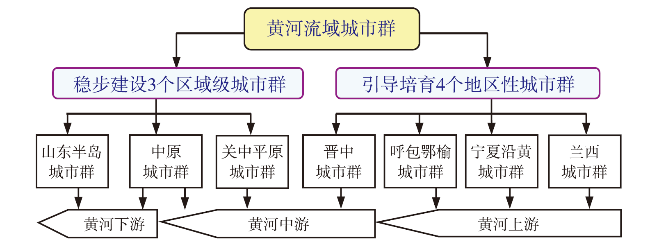
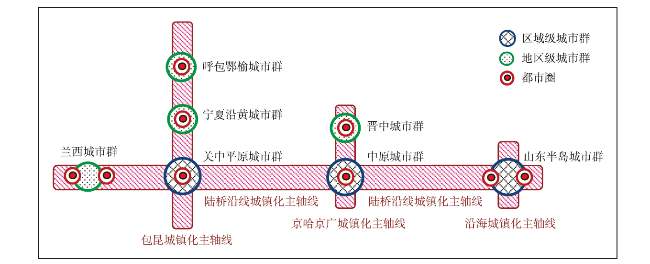
黄河流域城市群由3个区域级城市群(山东半岛城市群、中原城市群和关中平原城市群)和4个地区性城市群(兰西城市群、晋中城市群、呼包鄂榆城市群和宁夏沿黄城市群)组成“3+4”的空间组织格局,其人口及主要经济指标占中国城市群的比重大致在20%~25%之间,但占黄河流域9省区的比重高达60%~70%以上,是黄河流域人口高密度的集聚区、经济高质量发展的重心区、传承黄河文化弘扬中华文明的重载区,也是环境污染综合治理与生态保护的重点区,因而在黄河流域高质量发展中具有非常重要的战略地位。目前,黄河流域城市群呈现出集聚程度低、发育程度低,高端高新产业比重低、建设用地扩张速度慢、越往上游城市群发育程度越低的发育特点,不少城市群尚处在发育雏形阶段。未来城市群的发展要按照分级分类发展原则,以生态保护为先导,以流域一体化为主线,以创新为动力源,以文化传承为灵魂,以9大都市圈为鼎,不断提升黄河流域7大城市群发展“颜值”、发展能级、发展质量和文化品质,推动黄河流域城市群在错位分工中互补协调发展,把黄河流域城市群建成生态型、创新型和文化传承型城市群。
方创琳 . 黄河流域城市群形成发育的空间组织格局与高质量发展[J]. 经济地理, 2020 , 40(6) : 1 -8 . DOI: 10.15957/j.cnki.jjdl.2020.06.001
The Yellow River Basin consists of three regional urban agglomerations (Shandong peninsula,Central plain and Guanzhong plain urban agglomeration) and four local urban agglomerations (Lanxi,Jinzhong,Hubao-Eyu and Ningxia urban agglomeration),which constitute the spatial organizational pattern of "3+4". The population and economic output of these seven urban agglomerations account for 20%-25% of all urban agglomerations in China,but 60%-70% of the nine provinces in the Yellow River Basin. It is a densely populated area,a key area for high-quality economic development,and an important area for inheriting the Yellow River culture and carrying forward the Chinese civilization. Meanwhile,it is also a key area for the comprehensive treatment of environmental pollution and ecological protection. Therefore,it has a very important strategic position in the high-quality development of the Yellow River Basin. At present,urban agglomerations in the Yellow River Basin are characterized by a low degree of gathering,low degree of development,low proportion of high-tech industries,slow expansion of construction land,and low development degree,especially in upstream. Many urban agglomerations are still in the embryonic stage. In the future,The development of urban agglomeration should be based on the principle of classification,take ecological protection as the guide,integration of river basin as the main line,innovation as power, cultural inheritance as soul, take 9 metropolitan areas as pillar,enhance the appearance level, industry level,development quality and cultural quality of urban agglomerations in the Yellow River Basin. We should promote the complementary and coordinated development in these urban agglomerations and turn them into ecological, innovative and culturally inherited regions.
表1 黄河流域城市群主要经济指标在全国城市群的战略地位表(2016年)Tab.1 Strategic position of the main economic indicators of urban agglomerations in the Yellow River Basin (2016) |
| 城市群名称 | 人口 (亿人) | 城镇 人口 (亿人) | GDP (万亿元) | 第一产业 增加值 (万亿元) | 第二产业 增加值 (万亿元) | 第三产业 增加值 (万亿元) | 全社会规定 资产投资(万亿元) | 财政 收入 (万亿元) | 社会消费 品零售总 额(万亿元) | 实际利 用外资 (亿美元) |
|---|---|---|---|---|---|---|---|---|---|---|
| 黄河流域城市群 | 2.51 | 1.21 | 14.51 | 1.05 | 6.79 | 6.68 | 12.88 | 1.31 | 6.27 | 418.89 |
| 黄河流域9省区 | 4.16 | 2.21 | 20.39 | 1.87 | 9.15 | 9.38 | 18.96 | 1.92 | 8.05 | 511.9 |
| 占中国城市群的比重(%) | 24.15 | 21.20 | 21.45 | 23.16 | 22.83 | 19.98 | 25.79 | 16.49 | 21.40 | 15.64 |
| 占黄河流域9省区的比重(%) | 60.34 | 54.75 | 71.16 | 56.15 | 74.21 | 71.22 | 67.93 | 68.23 | 77.89 | 81.83 |
表2 黄河流域城市群人口密度与城镇密度变化表Tab.2 Population and city density of urban agglomerations in the Yellow River Basin |
| 城市群名称 | 人口密度(人/ km2) | 城镇密度(个/万km2) | |||
|---|---|---|---|---|---|
| 1980 | 2016 | 1980 | 2016 | ||
| 兰西城市群 | 69.60 | 121.67 | 2.88 | 23.86 | |
| 宁夏沿黄城市群 | 51.16 | 106.33 | 8.15 | 15.58 | |
| 呼包鄂榆城市群 | 37.48 | 64.95 | 4.34 | 13.26 | |
| 晋中城市群 | 127.86 | 235.79 | 10.40 | 29.87 | |
| 关中平原城市群 | 192.97 | 269.57 | 15.50 | 95.97 | |
| 中原城市群 | 480.93 | 704.35 | 19.59 | 78.30 | |
| 山东半岛城市群 | 348.49 | 525.70 | 48.28 | 69.23 | |
| 黄河流域城市群平均 | 191.82 | 293.04 | 12.22 | 33.71 | |
| 中国城市群平均 | 177.79 | 378.98 | 23.99 | 58.97 | |
表3 黄河流域城市群发育阶段对比分析表Tab.3 Development stage comparison of urban agglomerations in the Yellow River Basin |
| 等级 | 发育阶段 | 发育程度分级 | 对应城市群名称及发育程度指数 | 个数 |
|---|---|---|---|---|
| 三级 | 发育成熟阶段 | 山东半岛城市群(3.594) | 1 | |
| 四级 | 快速发育阶段 | 中原城市群(2.626)、呼包鄂榆城市群(2.478) | 2 | |
| 五级 | 发育雏形阶段 | 晋中城市群(1.945)、关中平原城市群(1.802)、宁夏沿黄城市群(1.797)、兰西城市群(1.341) | 4 |
表4 黄河流域城市群经济结构分析表(2016年)Tab.4 Economic structure of urban agglomerations in the Yellow River Basin(2016) |
| 产业结构占比(%) | 兰西城 市群 | 宁夏沿黄 城市群 | 呼包鄂榆 城市群 | 晋中城 市群 | 关中平原 城市群 | 中原城 市群 | 山东半岛 城市群 | 黄河流域 城市群 | 中国城 市群 |
|---|---|---|---|---|---|---|---|---|---|
| 第一产业 | 6.97 | 6.61 | 3.36 | 4.86 | 9.83 | 8.68 | 7.09 | 7.24 | 6.70 |
| 第二产业 | 38.54 | 53.17 | 48.12 | 45.02 | 44.64 | 49.45 | 46.48 | 46.82 | 43.98 |
| 第三产业 | 54.49 | 40.22 | 48.52 | 50.12 | 45.53 | 41.87 | 46.44 | 45.94 | 49.32 |
表5 黄河流域城市群建设用地扩张表(km2)Tab.5 The construction land expansion of urban agglomerations in the Yellow River Basin (km2) |
| 城市群名称 | 1980 | 1990 | 2000 | 2010 | 2015 | 历年平均扩展速度(%) |
|---|---|---|---|---|---|---|
| 兰西城市群 | 1 166 | 1 129 | 1 231 | 1 331 | 1 633 | 0.97 |
| 宁夏沿黄城市群 | 505 | 502 | 598 | 836 | 1 068 | 2.16 |
| 呼包鄂榆城市群 | 2 437 | 2 493 | 2 609 | 2 904 | 4 466 | 1.75 |
| 晋中城市群 | 1 509 | 1 545 | 1 742 | 1 960 | 2 092 | 0.94 |
| 关中平原城市群 | 2 215 | 2 241 | 2 550 | 2 809 | 3 337 | 1.18 |
| 中原城市群 | 5 243 | 5 219 | 5 887 | 6 449 | 6 815 | 0.75 |
| 山东半岛城市群 | 9 218 | 10 276 | 10 996 | 12 706 | 13 115 | 1.01 |
| 黄河流域城市群合计 | 22 293 | 23 405 | 25 613 | 28 995 | 32 526 | 1.09 |
注:本表根据李广东副研究员针对中国城市群建设用地扩张结果汇总而成。 |
表6 黄河流域城市群主要经济指标的差异分析表(2016年)Tab.6 Differences in major economic indicators of urban agglomeration in the Yellow River Basin (2016) |
| 城市群名称 | 人口 (万人) | GDP (亿元) | 人均GDP (元) | 全社会规 定资产投 资(亿元) | 财政收入 (亿元) | 社会消费品零售总额(亿元) | 实际利 用外资 (亿美元) | 粮食 总产量 (万t) | 城镇居民人均可支配收入(元) | 农村居民 人均可支 配收入(元) | |
|---|---|---|---|---|---|---|---|---|---|---|---|
| 上游 | 兰西城市群 | 1 432.93 | 5 039.35 | 35 168 | 5 492.66 | 825.48 | 2 278.79 | 1.41 | 569.01 | 25 011 | 8 554 |
| 宁夏沿黄城市群 | 554.74 | 2 912.06 | 52 494 | 3 369.05 | 330.86 | 785.16 | 0.56 | 292.78 | 25 769 | 10 607 | |
| 呼包鄂榆城市群 | 1 138.43 | 14 232.15 | 125 016 | 9 322.55 | 1 224.59 | 4 028.55 | 42.70 | 508.28 | 37 794 | 13 817 | |
| 中游 | 晋中城市群 | 2 107.84 | 8 310.41 | 39 426 | 8 622.94 | 738.14 | 4 236.84 | 18.26 | 887.00 | 27 791 | 11 196 |
| 关中平原城市群 | 4 361.24 | 17 007.51 | 38 997 | 21 209.36 | 1 824.19 | 8 014.79 | 51.43 | 1 788.59 | 27 610 | 9 435 | |
| 中原城市群 | 7 183.71 | 30 356.93 | 42 258 | 28 443.40 | 2 505.19 | 12 885.28 | 137.27 | 3 855.02 | 27 053 | 12 376 | |
| 下游 | 山东半岛城市群 | 8 329.95 | 67 215.31 | 80 691 | 52 364.41 | 5 664.89 | 30 484.89 | 167.26 | 5 453.31 | 32 628 | 14 317 |
| 黄河流域城市群合计 | 25 108.8 | 145 073.72 | 57 778 | 128 824.37 | 13 113.34 | 62 714.3 | 418.89 | 13 353.9 | 29 094 | 11 472 | |
表7 黄河流域城市群发展功能定位对比表Tab.7 Functional orientations of urban agglomerations in the Yellow River Basin |
| 城市群名称 | 发展功能定位 | |
|---|---|---|
| 上游地区 | 兰西城市群 | 维护国家生态安全的战略支撑、优化国土开发格局的重要平台、促进我国向西开放的重要支点、支撑西北地区发展的重要增长极、沟通西北西南、连接欧亚大陆的重要枢纽 |
| 宁夏沿黄城市群 | 全国重要的能源化工和新材料基地,中国面向阿拉伯国家和地区的经济文化交流中心,西北地区人与自然和谐发展示范区,宁夏经济社会发展的辐射源 | |
| 呼包鄂榆城市群 | 全国高端能源化工基地、向北向西开放战略支点、西北地区生态文明合作共建区、民族地区城乡融合发展先行区 | |
| 中游地区 | 晋中城市群 | 国家重要的能源基地与先进制造业基地,山西省国家资源型经济转型综合配套改革的核心示范区,中国内陆及环渤海联动发展的重要增长极 |
| 关中平原城市群 | 向西开放的战略支点、引领西北地区发展的重要增长极、以军民融合为特色的国家创新高地、传承中华文化的世界级旅游目的地、内陆生态文明建设先行区 | |
| 中原城市群 | 经济发展新增长极、重要的先进制造业和现代服务业基地、中西部地区创新创业先行区、内陆地区双向开放新高地、绿色生态发展示范区 | |
| 下游地区 | 山东半岛城市群 | 我国北方重要开放门户、京津冀和长三角重点联动区、国家蓝色经济示范区和高效生态经济区、环渤海地区重要增长极 |
注:本表根据国务院批准实施的《关中平原城市群发展规划》《中原城市群发展规划》《兰西城市群发展规划》《呼包鄂榆城市群发展规划》以及省内城市群发展规划整理。 |
| [1] |
习近平. 在黄河流域生态保护和高质量发展座谈会上的讲话[J]. 求是, 2019(20):4-11.
|
| [2] |
陈耀. 黄河流域生态保护和高质量发展战略的思考要点[J]. 区域经济评论, 2020(1):12-17.
|
| [3] |
方创琳, 鲍超, 马海涛. 中国城市群发展报告[M]. 北京: 科学出版社, 2016.
|
| [4] |
陆大道, 孙东琪. 黄河流域的综合治理与可持续发展[J]. 地理学报, 2019, 74(12):2431-2 436.
|
| [5] |
方创琳. 改革开放40 年来中国城镇化与城市群取得的重要进展与展望[J]. 经济地理, 2018, 38(9):1-9.
|
| [6] |
方创琳, 高倩, 张小雷, 等. 城市群空间扩展的用地转换特征及其对生态环境的影响[J]. 中国科学·地球科学, 2019, 49(9):1413-1 424.
|
/
| 〈 |
|
〉 |