
新冠疫情期间南京个体经济活力变化格局及其影响因素
|
孙洁(1989—),女,博士,副研究员,研究方向为城市社会空间、绅士化、商业空间。E-mail:jiesun@nju.edu.cn |
收稿日期: 2024-03-13
修回日期: 2025-01-10
网络出版日期: 2025-05-13
基金资助
国家自然科学基金青年项目(42101219)
国家自然科学基金面上项目(42271245)
国家社会科学基金重点项目(17ASH003)
香港政府研究基金项目(PolyU 15601221)
南京市青年文化英才培养项目“文化赋能城市更新研究博士工作站”
Spatial-temporal Pattern and Influence Factors of Economic Vitality of Self-employed and Private Businesses in Nanjing during the COVID-19 Pandemic
Received date: 2024-03-13
Revised date: 2025-01-10
Online published: 2025-05-13
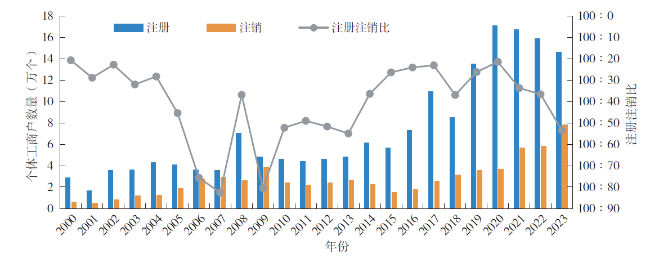
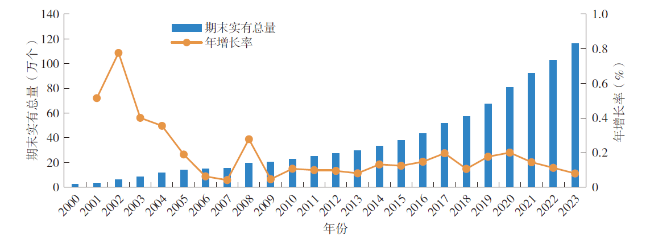
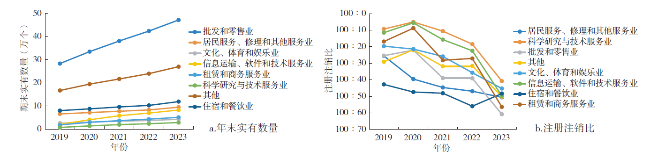
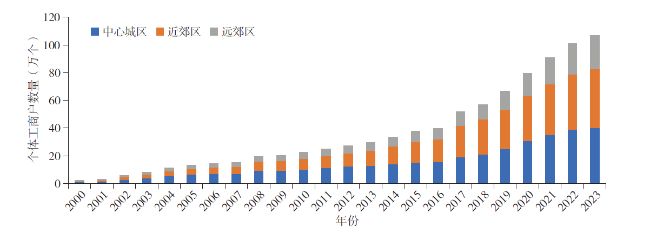
新冠疫情如何影响中国经济发展是近年学界关注的热点之一,然而极少有研究从地理空间视角分析疫情前后个体经济存亡的格局变化及其影响因素。文章基于2019—2023年天眼查网站个体工商户数据,使用描述性统计刻画疫情对南京市个体经济规模的影响,并运用核密度分析、空间自相关等方法分析了个体经济存亡的时空格局演变特征,最后通过相关性分析检验了影响个体经济空间分异的主要因素。研究发现:①疫情造成南京市个体经济规模增长减速,活力总体下降,并且传统行业个体经济受冲击更突出。②注册和注销个体工商户均集中在城市三级商圈,疫情并未改变个体经济“强核心、多层级”的空间结构特征。中心城区个体经济增长活力相对偏弱,但稳定性较强;郊区个体经济具有增长潜力,但脆弱性明显。③个体经济高度依赖于公共交通可达性,因而高等级商圈恢复更快。为促进个体经济恢复发展,城市更新和乡村振兴应创造适宜个体工商户可持续发展的营商环境。
孙洁 , 刘春卉 , 王玥然 , 殷疆南 . 新冠疫情期间南京个体经济活力变化格局及其影响因素[J]. 经济地理, 2025 , 45(3) : 76 -86 . DOI: 10.15957/j.cnki.jjdl.2025.03.008
The impact of the COVID-19 pandemic on China's economic development has emerged as a prominent subject of academic concerns in recent years, However, limited research has been conducted to analyze the transformation in the survival patterns of the self-employed and private businesses and its determinants from a geospatial perspective. Based the data of self-employed and private businesses in 2019-2023 from the website of Tianyancha, this study employs descriptive statistics to analyze the pandemic's influence on the scale of Nanjing's self-employed and private businesses. Furthermore, it uses the methods of kernel density analysis and spatial autocorrelation to examine the evolution of the spatiotemporal patterns of self-employed and private businesses. This study also identifies the principal factors contributing to the spatial differentiation of the self-employed and private businesses through correlation analysis. It’s found that: 1) The COVID-19 pandemic decelerated the growth of the scale of Nanjing's self-employed and private businesses, leading to an overall decline in vitality, with the self-employed and private businesses of traditional industries experiencing more pronounced impacts. 2) The registration and cancellation of individual industrial and commercial households were predominantly concentrated in the city's tertiary business districts. The COVID-19 pandemic did not alter the "strong core and multi-level" spatial structure characteristic of the self-employed and private businesses. While the growth vitality of the self-employed and private businesses in central urban areas was relatively weak, its stability remained robust. Conversely, the self-employed and private businesses in suburban area exhibited growth potential, but were more vulnerable. 3) The self-employed and private businesses are so highly dependent on public transport accessibility, facilitating a quicker recovery in high-grade business districts after the COVID-19. In order to promote the recovery of self-employed and private businesses, urban renewal and rural revitalization should aim to provide a business-friendly environment for self-employed and privatebusinesses.
图1 2000—2023年南京市个体工商户注册注销数量及注册注销比Fig.1 The registered and deregistered number of self-employed and private businesses and their ratio in Nanjing,2000-2023 |
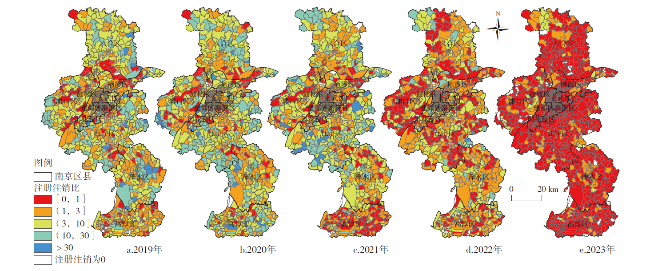
表1 2019—2023年社区尺度的南京市个体工商户注册注销比统计Tab.1 Register-to-deregister ratio of self-employed and private businesses at the community level,2019-2023 |
| 类型 | 2019 | 2020 | 2021 | 2022 | 2023 | |||||||||
|---|---|---|---|---|---|---|---|---|---|---|---|---|---|---|
| 数量(个) | 比例(%) | 数量(个) | 比例(%) | 数量(个) | 比例(%) | 数量(个) | 比例(%) | 数量(个) | 比例(%) | |||||
| 极低[0,1] | 139 | 10.82 | 134 | 10.43 | 253 | 19.69 | 357 | 27.78 | 1021 | 79.46 | ||||
| 较低(1,3] | 524 | 40.78 | 417 | 32.45 | 489 | 38.05 | 563 | 43.81 | 212 | 16.50 | ||||
| 一般(3,10] | 445 | 34.63 | 477 | 37.12 | 361 | 28.09 | 304 | 23.66 | 21 | 1.63 | ||||
| 较高(10,30] | 133 | 10.35 | 203 | 15.80 | 140 | 10.89 | 37 | 2.88 | 0 | 0 | ||||
| 极高(>30) | 25 | 1.95 | 37 | 2.88 | 23 | 1.79 | 4 | 0.31 | 0 | 0 | ||||
| 注册注销为0 | 19 | 1.48 | 17 | 1.32 | 19 | 1.48 | 20 | 1.56 | 31 | 2.41 | ||||
| 总计 | 1285 | 100 | 1285 | 100 | 1285 | 100 | 1285 | 100 | 1285 | 100 | ||||
表2 2019—2023年南京市各个行业注册、注销个体工商户的单变量全局自相关检验结果Tab.2 Global Moran's I of the registered and deregistered self-employed and private businesses in various industries of Nanjing from 2019 to 2023 |
| 行业 | 注册 | 注销 | |||||||||
|---|---|---|---|---|---|---|---|---|---|---|---|
| 2019 | 2020 | 2021 | 2022 | 2023 | 2019 | 2020 | 2021 | 2022 | 2023 | ||
| 居民服务、修理和其他服务 | 0.375 | 0.217 | 0.243 | 0.279 | 0.197 | 0.318 | 0.275 | 0.273 | 0.345 | 0.288 | |
| 信息传输、软件和信息技术服务业 | 0.340 | 0.063 | 0.02 | 0.03 | 0.121 | 0.281 | 0.252 | 0.056 | 0.095 | 0.090 | |
| 文化、体育和娱乐业 | 0.332 | 0.254 | 0.247 | 0.364 | 0.227 | 0.315 | 0.300 | 0.228 | 0.270 | 0.308 | |
| 批发和零售业 | 0.285 | 0.213 | 0.246 | 0.278 | 0.251 | 0.139 | 0.198 | 0.100 | 0.215 | 0.261 | |
| 住宿和餐饮业 | 0.275 | 0.256 | 0.256 | 0.246 | 0.259 | 0.281 | 0.313 | 0.282 | 0.280 | 0.302 | |
| 租赁和商务服务 | 0.249 | 0.046 | 0.079 | 0.171 | 0.175 | 0.325 | 0.167 | 0.036 | 0.126 | 0.023 | |
| 其他 | 0.245 | 0.250 | 0.243 | 0.261 | 0.226 | 0.182 | 0.225 | 0.088 | 0.237 | 0.212 | |
| 科学研究和技术服务业 | 0.164 | 0.202 | 0.207 | 0.174 | 0.197 | 0.139 | 0.228 | 0.204 | 0.116 | 0.191 | |
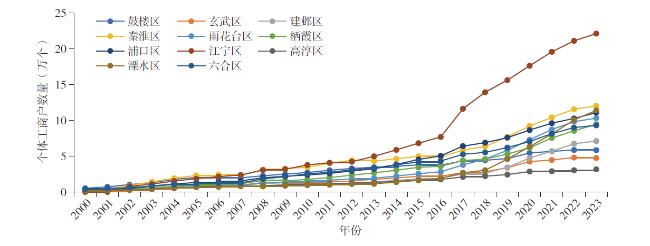
图4 2000—2023年南京市中心城区、近郊区及远郊区年末个体工商户数量Fig.4 The number of self-employed and private businesses in central urban area,peri-urban area,and suburban area of Nanjing,2000-2023 |
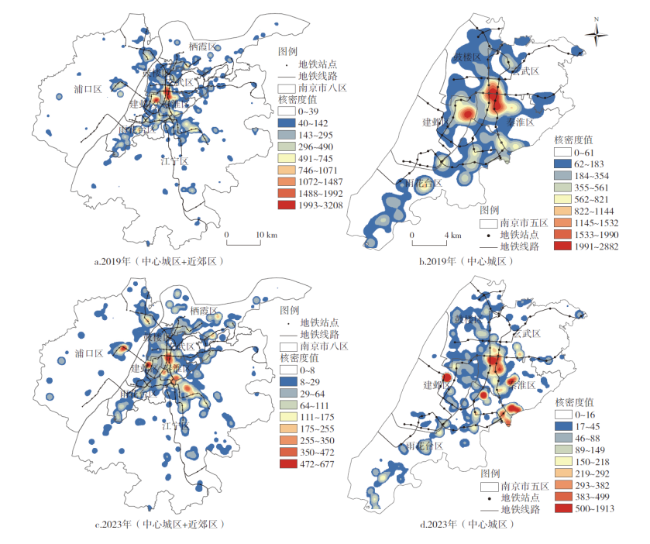
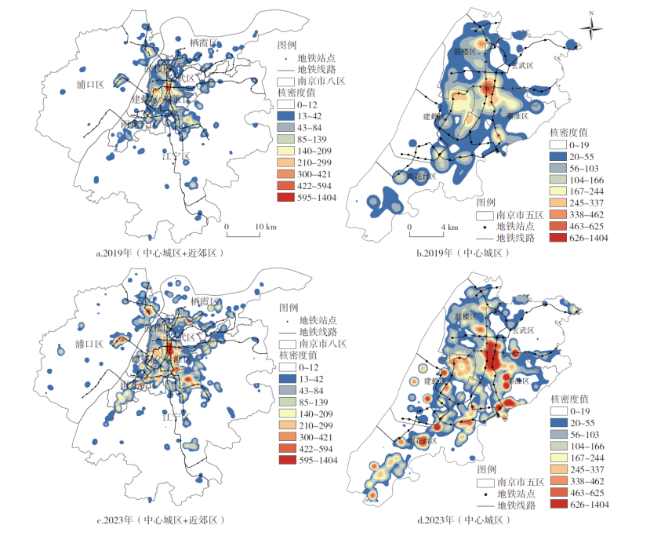
图6 南京市近郊区与中心城区注册个体工商户的核密度图(2019,2023)Fig.6 Kernel density of registered self-employed and private businesses in central urban area and peri-urban area of Nanjing in 2019 and 2023 |
表3 2019—2023年南京市不同地区个体工商户注册注销比最大值、平均值及标准差Tab.3 Maximum,mean and standard deviation of register-to-deregister ratio of self-employed and private businesses in different area of Nanjing,2019-2023 |
| 年份 | 中心城区 | 近郊区 | 远郊区 | ||||||||
|---|---|---|---|---|---|---|---|---|---|---|---|
| 最大值 | 平均值 | 标准差 | 最大值 | 平均值 | 标准差 | 最大值 | 平均值 | 标准差 | |||
| 2019 | 58.00 | 4.22 | 6.24 | 110.50 | 7.00 | 11.01 | 78.50 | 6.85 | 9.77 | ||
| 2020 | 125.60 | 6.41 | 11.99 | 118.86 | 7.73 | 11.96 | 76.00 | 7.78 | 9.41 | ||
| 2021 | 51.40 | 3.16 | 4.58 | 155.00 | 7.06 | 11.80 | 155.00 | 5.11 | 9.67 | ||
| 2022 | 46.91 | 2.56 | 3.32 | 58.50 | 2.64 | 4.63 | 30.00 | 3.58 | 4.29 | ||
| 2023 | 6.22 | 0.44 | 0.56 | 7.50 | 0.68 | 0.89 | 7.50 | 0.77 | 0.97 | ||
表4 变量定义与描述性统计分析Tab.4 Definition of variables and descriptive statistical analysis |
| 分类 | 变量名称 | 变量定义 | 均值 | |
|---|---|---|---|---|
| 因变量 | 个体经济规模变化 | 2019—2023年单元内个体工商户数量变化率 | 0.67 | |
| 自变量 | 交通区位 | 公交可达 | 单元内地公交站点数量(个) | 5.81 |
| 地铁可达 | 单元内地铁站点数量(个) | 0.15 | ||
| 路网密度 | 单元内路网密度(km/km2) | 6.02 | ||
| 周边配套 | 人口密度 | 单元内人口密度(人/km2) | 9352.46 | |
| 住宅房价 | 单元内二手房成交均价(元/m2) | 30772 | ||
| 购物资源 | 单元内大型购物中心数量(个) | 0.32 | ||
| 旅游资源 | 单元内旅游景点数量(个) | 2.35 | ||
| 商业环境 | 商铺租金 | 单元内商铺租金均值[元/(月·m2)] | 125.49 | |
| 商业用地 | 单元内商业用地面积比例(%) | 0.03 | ||
| 产业用地 | 单元内二产用地面积比例(%) | 0.14 | ||
| 疫情防控 | 封控时间 | 2019—2023年内社区被封控的时间(天) | 5.5 |
表5 相关性分析结果Tab.5 Correlation results of variables and descriptive statistic analysis |
| 人口密度 | 路网密度 | 地铁可达 | 公交可达 | 旅游资源 | 商铺租金 | 住宅房价 | 购物资源 | 商业用地 | 产业用地 | 封控时间 | |
|---|---|---|---|---|---|---|---|---|---|---|---|
| 皮尔逊相关性 | -0.088*** | -0.017 | 0.084*** | 0.056** | -0.017 | 0.030 | 0.018 | 0.001 | 0.016 | 0.089*** | -0.036 |
| 显著性值 | 0.002 | 0.534 | 0.003 | 0.045 | 0.537 | 0.459 | 0.619 | 0.980 | 0.575 | 0.001 | 0.200 |
注:***、**分别表示在0.01、0.05水平下显著。 |
| [1] |
新华社. 我国市场主体达1.7亿户其中个体工商户1.14亿户约占总量三分之二_滚动新闻_中国政府网[EB/OL]. https://baijiahao.baidu.com/s?id=1757793521703333129&wfr=spider&for=pc,2023-12-05.
|
| [2] |
国家市场监督管理总局. 《促进个体工商户发展条例》系列解读文章之三促进个体工商户发展对经济社会发展具有重要意义[EB/OL]. https://www.sac.gov.cn/zw/zfxxgk/fdzdgknr/xwxcs/art/2023/art_0ca52eaa39ae48fb943a5da1826ad979.html,2023-12-11.
|
| [3] |
胡飞. 当前个体工商户发展面临的主要困难与对策[J]. 中国经贸导刊, 2022(11):72-73.
|
| [4] |
|
| [5] |
李连刚, 胡晓辉. 新冠肺炎疫情下中国区域经济韧性时空格局与影响因素分析[J]. 世界地理研究, 2023, 32(3):64-75
|
| [6] |
蒋正云, 刘庆芳, 宋金平. 中国区域经济韧性的格局特征及演化机制[J]. 经济地理, 2023, 43(6):1-12.
|
| [7] |
曾春水, 周侃, 柯文前, 等. 新冠疫情冲击下福建省县域经济韧性格局与影响因素[J]. 地域研究与开发, 2023, 42(5):35-41.
|
| [8] |
吴锋, 刘桂君, 郭纳良, 等. COVID-19疫情对中国区域经济及产业的影响[J]. 地理学报, 2021, 76(4):1034-1048.
|
| [9] |
狄乾斌, 陈科其, 陈小龙. 疫情冲击下北京市旅游业经济韧性测度及其影响因素[J]. 经济地理, 2023, 43(1):133-140.
|
| [10] |
韩梅, 孙根年. 疫情冲击下北京市旅游业及细分行业恢复的差异[J]. 经济地理, 2023, 43(9):219-230.
|
| [11] |
杨波, 夏筱君, 陈媛媛. 新冠肺炎疫情下的餐饮业:冲击与分化[J]. 河海大学学报(哲学社会科学版), 2021, 23(1):31-40,106.
|
| [12] |
|
| [13] |
|
| [14] |
|
| [15] |
|
| [16] |
|
| [17] |
|
| [18] |
|
| [19] |
|
| [20] |
|
| [21] |
陈蔚珊, 柳林, 梁育填. 基于 POI 数据的广州零售商业中心热点识别与业态集聚特征分析[J]. 地理研究, 2016, 35(4):703-716.
|
| [22] |
浩飞龙, 王士君, 冯章献, 等. 基于 POI 数据的长春市商业空间格局及行业分布[J]. 地理研究, 2018, 37(2):366-378.
|
| [23] |
何伟纯, 李二玲, 崔之珍, 等. 开封市主城区零售商业空间布局及其影响因素[J]. 经济地理, 2018, 38(9):158-167.
|
| [24] |
魏宗财, 魏纾晴, 彭丹丽, 等. 数字经济影响下城市零售空间变化及其规划响应[J] .规划师, 2021, 37(13):24-30.
|
| [25] |
新华社. 外交部发言人: 中国经济韧性强、 潜力大、活力足[EB/OL]. https://www.gov.cn/xinwen/2023-01/18/content_5737852.htm,2023-01-18.
|
| [26] |
武传君, 朱雨蒙, 吴晓波. 第四次创业浪潮[N]. 经济信息时报,2014 -11- 26(03).
|
| [27] |
任泽平团队. cn/zl/2021-12-20/zl-ikyamrmz 00 29687.d. html,2021-12-20.
|
| [28] |
魏宗财, 魏纾晴, 陈旭华, 等. 数字化转型下的广州市中心城区商业店铺租金影响因素探究[J]. 经济地理, 2022, 42(10):119-126.
|
| [29] |
魏琛朋, 朱喜钢, 孙洁, 等. 疫情防控常态化时期青年人休闲活动的时空特征及影响因素探究——以南京市为例[J]. 现代城市研究, 2022(6):23-30,53.
|
| [30] |
扬子晚报. 市内游、乡村游、景区夜游“实力圈粉” 国庆黄金周南京迎客超700万人次[EB/OL] https://baijiahao.baidu.com/s?id=1746041980572470983&wfr=spider&for=pc,2022-10-07.
|
| [31] |
央广网. 江苏南京: “五一”假期居民“留宁度假”多业态共迎“烟火气””复归[EB/OL]. https://js.cnr.cn/whly/20220505/t20220505_525816294.shtml,2022-05-05.
|
| [32] |
谷跃, 王捷凯, 黄琴诗, 等. 南京商铺租金时空格局及影响因素分析[J]. 地理研究, 2021, 40(9):2459-2475.
|
/
| 〈 |
|
〉 |