
长三角地区生态韧性抵抗—适应—恢复的耦合协调及影响机制
|
周怡静(2000—),女,博士研究生,研究方向为城市地理与区域可持续发展。E-mail:zhouyijing@zjnu.edu.cn |
收稿日期: 2024-04-03
修回日期: 2024-09-02
网络出版日期: 2025-05-13
基金资助
国家自然科学基金项目(42301231)
教育部人文社会科学研究项目(23YJCZH282)
浙江省自然科学基金项目(ZCLQ24D0101)
湖南省教育厅科研项目(22C0688)
金华市公益性技术应用研究项目(2023-4-029)
Coupling Coordination and Influencing Mechanisms of Ecological Resilience in the Yangtze River Delta Region:A Resistance-Adaptation-Recovery Framework
Received date: 2024-04-03
Revised date: 2024-09-02
Online published: 2025-05-13
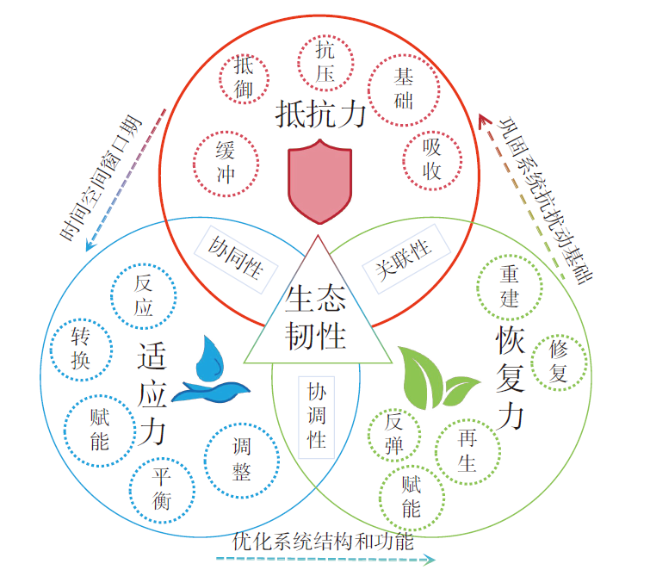
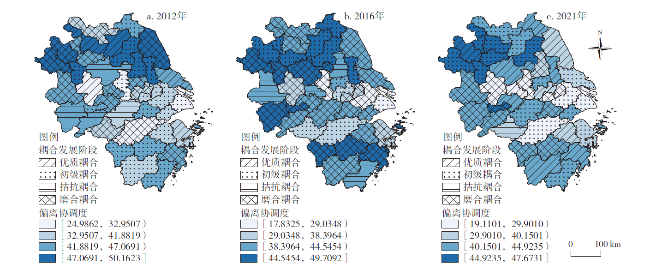
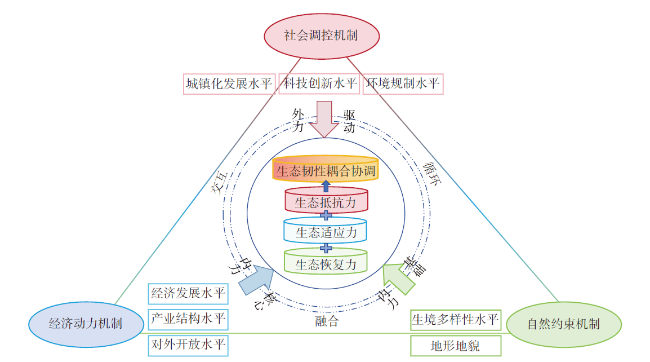
增强生态韧性是推动生态文明建设的重要途径,提升生态韧性协调性是区域高质量发展的内在要求。文章基于抵抗—适应—恢复三维框架构建指标体系,并借助动态耦合协调度模型、地理探测器和空间杜宾模型等方法,分析了2012—2021年长三角生态韧性内部子系统耦合协调的时空变化规律及其影响机制。结果表明:①长三角生态韧性三大指数呈缓慢上升态势。各子系统在时间上呈现增长趋势,在空间上呈现“东南高、西北低”的分布特征。②长三角生态韧性协同水平不断提升。其中抵抗力和恢复力的演化方向由负转正,演化速度也有不同程度提高;而适应力的演化方向则由正转负,演化速度减缓。偏离协调度在长三角大格局上呈现东南低西北高的分布特征。③经济发展、科技创新、产业结构、对外开放和城镇化水平是影响生态韧性耦合协调度的主导因子,同时在外源扰动和内核驱动的双重作用下,生态韧性耦合协调度受到社会调控机制、经济动力机制和自然约束机制的综合影响。
周怡静 , 张长淦 , 尹上岗 , 孙恬 . 长三角地区生态韧性抵抗—适应—恢复的耦合协调及影响机制[J]. 经济地理, 2025 , 45(3) : 160 -170 . DOI: 10.15957/j.cnki.jjdl.2025.03.016
Ecological resilience plays a pivotal role in sustainable urban development. Enhancing ecological resilience is a critical pathway for advancing ecological civilization, improving the coordination of ecological resilience is an inherent requirement for achieving high-quality regional development. Based on a three-dimensional framework of resistance-adaptation-recovery, this study constructs an index system and analyzes the spatiotemporal dynamics and influencing mechanisms of the coupling coordination among internal subsystems of ecological resilience in the Yangtze River Delta from 2012 to 2021 by the means of dynamic coupling coordination degree model, geographical detector, and spatial Durbin model. The results show: 1) The three dimensions of ecological resilience in the Yangtze River Delta show a gradual upward trend. Each subsystem demonstrates a growth trend over time and displays a spatial distribution characterized by "high in the southeast of the Yangtze River Delta, low in the northwest of the Yangtze River Delta". 2) The coordination level of ecological resilience in the Yangtze River Delta has continuously improved. The evolution direction of resistance and recovery shifted from negative to positive, with their evolution speeds also increasing to varying degrees. In contrast, the evolution direction of adaptation shifted from positive to negative, and its evolution speed slowed down. The degree of deviation coordination in the region displays a spatial distribution characterized by "low in the southeast of the Yangtze River Delta and high in the northwest of the Yangtze River Delta". 3) Economic development, scientific and technological innovation, industry structure, openness to the global market, and urbanization level are the primary drivers influencing the coupling coordination degree of ecological resilience. Additionally, under the dual effects of external disturbances and internal forces, the coupling coordination degree of ecological resilience is comprehensively influenced by social regulation mechanism, economic power mechanism, and natural constraint mechanism.
表1 区域生态韧性指标体系及说明Tab.1 Evaluation index system of regional ecological resilience and its explanation |
| 目标层 | 准则层 | 指标层 | 单位 | 归一化 | 权重 |
|---|---|---|---|---|---|
| 生 态 韧 性 水 平 | 抵抗力 | 人口密度 | 人/km2 | 反向 | 0.2703 |
| 碳排放总量 | 万t | 反向 | 0.0696 | ||
| 工业SO2排放量 | t | 反向 | 0.0508 | ||
| 化肥施用量(折纯) | 万t | 反向 | 0.1597 | ||
| 可吸入细颗粒物年平均浓度 | μg/m3 | 反向 | 0.3655 | ||
| 城市建设用地占市区面积比重 | % | 反向 | 0.0840 | ||
| 适应力 | 水利、环境和公共设施管理业从业人员数量 | 万人 | 正向 | 0.1032 | |
| 排水管道长度 | km | 正向 | 0.1576 | ||
| 市容环境卫生公用设施固定资产投资 | 亿元 | 正向 | 0.3050 | ||
| 污水处理能力 | 万m3/日 | 正向 | 0.2482 | ||
| 生活垃圾处理能力 | t/日 | 正向 | 0.1819 | ||
| 一般工业固体废物综合利用率 | % | 正向 | 0.0041 | ||
| 恢复力 | 建成区绿化覆盖率 | % | 正向 | 0.0233 | |
| 人均绿地面积 | m2/人 | 正向 | 0.1581 | ||
| 人均水资源占有量 | m3/人 | 正向 | 0.2815 | ||
| 景观格局指数 | - | 正向 | 0.0553 | ||
| 地方财政环境保护支出 | 亿元 | 正向 | 0.2746 | ||
| 人均绿色专利数量 | 个/人 | 正向 | 0.2071 |
表2 耦合协调阶段及说明Tab.2 Stage and explanation of coupling coordination |
| 发展阶段 | (VR,VA,VC) | 具体说明 |
|---|---|---|
| 拮抗耦合 | (-,-,-) | 抵抗力、适应力和恢复力都处于恶化的状态 |
| 磨合耦合 | (+,-,-) | 抵抗力得到加强,但适应力和恢复力仍在恶化 |
| (-,+,-) | 适应力开始得到提升,但抵抗力和恢复力仍在下降 | |
| (-,-,+) | 适应力有所提升,但抵抗力和适应力不足 | |
| 初级耦合 | (-,+,+) | 适应力和恢复力较强,但抵抗力下降 |
| (+,-,+) | 抵抗力和恢复力得到加强,但适应力不足 | |
| (+,+,-) | 抵抗力和适应力都得到了加强,但恢复力不足 | |
| 优质耦合 | (+,+,+) | 抵抗力、适应力和恢复力都得到了加强,系统表现出高度协调性和整体韧性 |
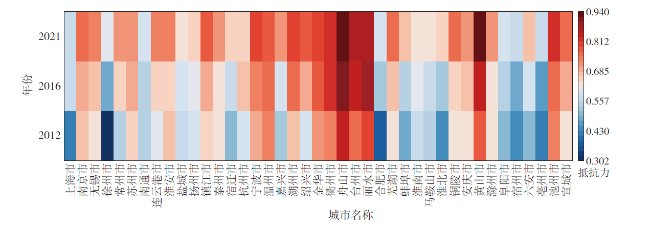
图2 2012—2021年长三角城市抵抗力指数Fig.2 Resistance index in cities of the Yangtze River Delta from 2012 to 2021 |
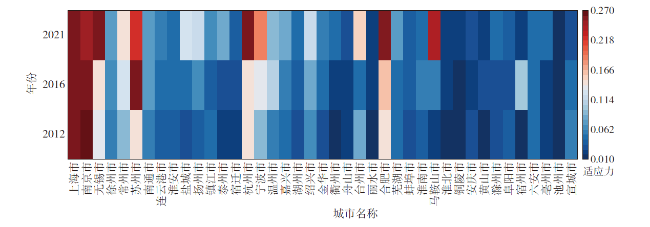
图3 2012—2021年长三角城市适应力指数Fig.3 Adaptability index in cities of the Yangtze River Delta from 2012 to 2021 |
表3 2012—2021年长三角地区VR、VA和VC演变趋势Tab.3 Evolution trend of VR, VA and VC in the Yangtze River Delta (2012-2021) |
| 年份 | VR | VA | VC | |||||
|---|---|---|---|---|---|---|---|---|
| 平均值 | 标准差 | 平均值 | 标准差 | 平均值 | 标准差 | |||
| 2012 | -0.0085 | 0.0384 | 0.0099 | 0.0345 | 0.0004 | 0.0314 | ||
| 2013 | -0.0129 | 0.0336 | 0.0001 | 0.0397 | 0.0127 | 0.0272 | ||
| 2014 | 0.0377 | 0.0390 | 0.0118 | 0.0348 | 0.0049 | 0.0259 | ||
| 2015 | 0.0396 | 0.0284 | -0.0068 | 0.0492 | 0.0125 | 0.0162 | ||
| 2016 | -0.0192 | 0.0377 | 0.0080 | 0.0337 | -0.0154 | 0.0320 | ||
| 2017 | 0.0102 | 0.0349 | 0.0073 | 0.0341 | 0.0096 | 0.0216 | ||
| 2018 | 0.0202 | 0.0302 | 0.0053 | 0.0464 | 0.0143 | 0.0182 | ||
| 2019 | 0.0201 | 0.0234 | 0.0061 | 0.0353 | -0.0005 | 0.0233 | ||
| 2020 | 0.0305 | 0.0246 | 0.0165 | 0.0582 | 0.0253 | 0.0375 | ||
| 2021 | 0.0113 | 0.0255 | -0.0064 | 0.0595 | 0.0129 | 0.0286 | ||
表4 生态韧性耦合协调度的影响因素及说明Tab.4 Influencing factors of coupling coordination degree of ecological resilience and their explanations |
| 因素分类 | 影响因素 | 具体指标 | 测度方法 | 单位 |
|---|---|---|---|---|
| 社会因素 | 城镇化发展水平 | 常住人口城镇化率 | 城镇人口/常住人口 | % |
| 科技创新水平 | R&D经费比例 | R&D经费投入/GDP | % | |
| 环境规制水平 | 环境规制强度指数 | 政府工作报告中与“环境保护”相关词汇的频率 | - | |
| 经济因素 | 经济发展水平 | 人均GDP | GDP/常住人口 | 元/人 |
| 产业结构水平 | 第二产业比重 | 第二产业增加值/GDP | % | |
| 对外开放水平 | 人均使用外资金额 | 实际使用外资金额/常住人口 | 美元/人 | |
| 自然因素 | 生境多样性水平 | 香农多样性指数 | 生态系统中物种的丰富度和均匀度 | - |
| 地形地貌 | 地形坡度 | - | - |
表5 2012、2016和2021年生态韧性耦合协调度的影响因素探测结果Tab.5 Detection results of influencing factors of coupling coordination degree of ecological resilience in 2012,2016 and 2021 |
| 特征变量 | 2012 | 2016 | 2021 | ||||||
|---|---|---|---|---|---|---|---|---|---|
| q | p | q | p | q | p | ||||
| 社会因素 | 城镇化发展水平 | 0.408 | 0.688 | 0.144 | 0.142 | 0.441*** | 0.000 | ||
| 科技创新水平 | 0.744*** | 0.000 | 0.777*** | 0.000 | 0.710*** | 0.000 | |||
| 环境规制水平 | 0.342 | 0.371 | 0.190** | 0.011 | 0.071 | 1.000 | |||
| 经济因素 | 经济发展水平 | 0.932*** | 0.000 | 0.941*** | 0.000 | 0.956*** | 0.000 | ||
| 产业结构水平 | 0.141*** | 0.006 | 0.493*** | 0.000 | 0.486*** | 0.003 | |||
| 对外开放水平 | 0.530*** | 0.000 | 0.517*** | 0.009 | 0.329 | 0.406 | |||
| 自然因素 | 生境多样性水平 | 0.215 | 0.886 | 0.202 | 0.951 | 0.314** | 0.020 | ||
| 地形地貌 | 0.157 | 1.000 | 0.109 | 0.300 | 0.201 | 0.999 | |||
表6 长三角生态韧性全局莫兰指数(2012—2021年)Tab.6 Global Moran's index of ecological resilience in the Yangtze River Delta (2012-2021) |
| 年份 | 2012 | 2013 | 2014 | 2015 | 2016 | 2017 | 2018 | 2019 | 2020 | 2021 |
|---|---|---|---|---|---|---|---|---|---|---|
| Moran's I | 0.167** | 0.215*** | 0.287*** | 0.238*** | 0.265*** | 0.161*** | 0.241*** | 0.229*** | 0.297*** | 0.224*** |
表7 长三角生态韧性空间溢出效应(2012—2021年)Tab.7 Spatial spillover effects of ecological resilience in the Yangtze River Delta (2012-2021) |
| 变量 | 直接效应 | 间接效应 | 总效应 |
|---|---|---|---|
| 经济发展水平 | 0.00618** | 0.0132* | 0.0194** |
| (0.0030) | (0.0073) | (0.0079) | |
| 科技创新水平 | 0.00285 | -0.0164** | -0.0136* |
| (0.0019) | (0.0065) | (0.0069) | |
| 产业结构水平 | -0.00474* | 0.0123* | 0.00752 |
| (0.0026) | (0.0067) | (0.0068) | |
| 对外开放水平 | 0.00207** | -0.00169 | 0.000375 |
| (0.0010) | (0.0027) | (0.0032) | |
| 城镇化发展水平 | -0.000686 | 0.00256 | 0.00188 |
| (0.0011) | (0.0023) | (0.0025) |
注:括号内数值为标准误。 |
| [1] |
|
| [2] |
赵瑞东, 方创琳, 刘海猛. 城市韧性研究进展与展望[J]. 地理科学进展, 2020, 39(10):1717-1731.
|
| [3] |
|
| [4] |
刘玒玒, 刘书芳. 祁连山地区复合生态系统韧性时空演化及障碍因子识别[J]. 干旱区地理, 2024, 47(2):237-247.
|
| [5] |
|
| [6] |
尹建军, 胡静, 黄宇瑄. 长江中游城市群城市韧性时空演化特征及动态预测研究[J]. 长江流域资源与环境, 2023, 32(11):2312-2325.
|
| [7] |
|
| [8] |
陈晓红, 娄金男, 王颖. 哈长城市群城市韧性的时空格局演变及动态模拟研究[J]. 地理科学, 2020, 40(12):2000-2009.
|
| [9] |
|
| [10] |
汪东川, 龙慧, 王康健, 等. 京津冀城市群城市化强度与生态韧性的耦合协调分析[J]. 生态学报, 2023, 43(15):6321-6331.
|
| [11] |
陶洁怡, 董平, 陆玉麒. 长三角地区生态韧性时空变化及影响因素分析[J]. 长江流域资源与环境, 2022, 31(9):1975-1987.
|
| [12] |
宋永永, 庞先峰, 唐宇, 等. 能源富集区社会—生态系统韧性演化与机理——以榆林市为例[J]. 经济地理, 2024, 44(1):32-44.
|
| [13] |
彭文斌, 曹笑天. 城市更新作用下生态韧性时空分异及其影响效应——以环长株潭城市群为例[J]. 经济地理, 2023, 43(10):44-52.
|
| [14] |
王松茂, 牛金兰. 山东省旅游经济与城市生态韧性协同演化研究[J]. 地理学报, 2023, 78(10):2591-2608.
|
| [15] |
吴朝霞, 许越, 孙坤. 城市集聚效应对绿色技术创新的影响研究——基于中国232个地级及以上城市的空间计量分析[J]. 经济地理, 2022, 42(10):25-34,71.
|
| [16] |
|
| [17] |
赵领娣, 孙兆旭. 海岸带城市经济发展质量与生态韧性协同发展演化及空间收敛特征[J]. 经济地理, 2023, 43(7):119-129.
|
| [18] |
|
| [19] |
|
| [20] |
|
| [21] |
|
| [22] |
|
| [23] |
|
| [24] |
尹上岗, 孙恬, 朱奕衡, 等. 长三角地区城区面积-绿地面积异速增长关系及协调性研究[J]. 地理科学, 2024, 44(4):670-680.
|
| [25] |
宓泽锋, 曾刚, 周灿, 等. 长三角城市群生态文明建设问题及潜力研究——基于5大城市群的比较[J]. 长江流域资源与环境, 2018, 27(3):463-472.
|
| [26] |
|
| [27] |
尹上岗, 姜晓艳, 姜海宁. 长三角地区房价、创新能力与城市品质的互动关系——基于PVAR模型的分析[J]. 地理研究, 2023, 42(10):2738-2758.
|
| [28] |
秦明慧, 刘秀丽. 海河流域水环境安全评价及动态耦合协调度分析[J]. 灌溉排水学报, 2023, 42(10):63-73.
|
| [29] |
|
| [30] |
段健, 王维婷, 徐勇, 等. 近30年来青藏高原粮食供需平衡格局演变及驱动因素[J]. 生态学报, 2024, 44(22):10411-10426.
|
| [31] |
马丽君, 刘聪, 唐盈. 省域旅游业高质量发展促进共同富裕的空间效应分析[J]. 经济地理, 2024, 44(4):210-219.
|
| [32] |
石龙宇, 郑巧雅, 杨萌, 等. 城市韧性概念、影响因素及其评估研究进展[J]. 生态学报, 2022, 42(14):6016-6029.
|
| [33] |
|
| [34] |
|
/
| 〈 |
|
〉 |