
中国金融科技公司时空格局及其影响因素
|
盛天翔(1983—),男,博士,副教授,研究方向为金融科技、货币信贷。E-mail:shengtx@njau.edu.cn |
收稿日期: 2024-08-29
修回日期: 2025-02-11
网络出版日期: 2025-05-13
基金资助
国家自然科学基金面上项目(72373066)
国家自然科学基金面上项目(72173063)
教育部人文社会科学研究青年基金项目(22YJC790105)
江苏省社会科学基金一般项目(22EYB017)
Spatio-temporal Evolution and Driving Factors of China's Fintech Companies
Received date: 2024-08-29
Revised date: 2025-02-11
Online published: 2025-05-13
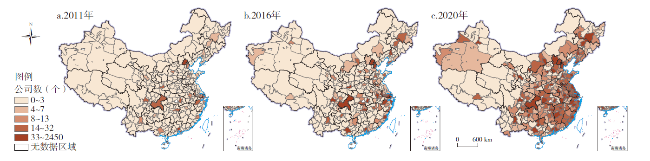
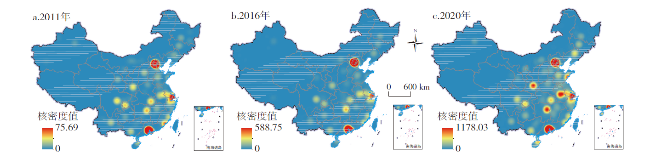
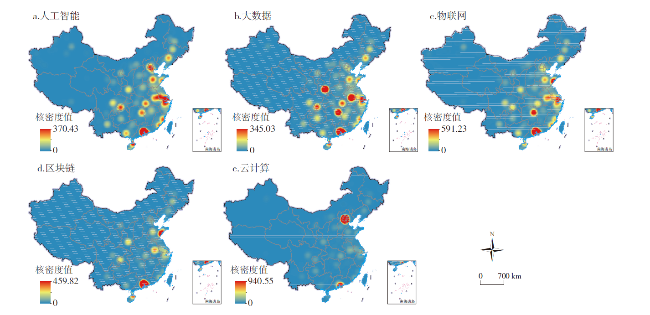
文章构建了中国金融科技公司基本信息库,利用ArcGIS空间统计方法分析2011—2020年金融科技公司的时空格局演变特征,并运用地理探测器探究了影响其布局的主要因素。研究发现:①中国金融科技公司数量增速在时序上呈“倒U”型,空间分布的总体差异主要源于各区域内的差异,且东部地区差异最大。以东部沿海和长江沿岸相结合的“T型”结构为轴线,公司分布呈“点—轴—网络”的扩散趋势。②中国金融科技公司分布重心向西南小幅移动,以南扩为主,形成“东北—西南”方向的空间格局。③中国金融科技公司集聚程度提高,形成“两极一核多片”的格局,呈现集聚连片式发展态势,而不同技术类型公司的集聚区位存在差异。④中国金融科技公司的空间分布格局是多维度因素共同作用的结果。从不同发展阶段来看,经济实力、财政金融、创新能力和政策环境始终是驱动金融科技公司发展的核心维度。创新孵化政策在各阶段均为最强因子,3个阶段的次强因子各不相同,不同技术类型公司的影响因素则呈现异质性特征。⑤各维度因子的交互作用均表现出显著增强关系,但存在较大差异。财政金融、基础设施和政策环境维度在各阶段都具有较强的催化作用。在全面深化阶段,创新能力维度不仅自身具有重要影响,还能显著增强其他因子的效力。
盛天翔 , 许润韬 , 范从来 , 姚越 . 中国金融科技公司时空格局及其影响因素[J]. 经济地理, 2025 , 45(3) : 119 -128 . DOI: 10.15957/j.cnki.jjdl.2025.03.012
This study constructs a basic information database of China's fintech companies, uses ArcGIS spatial statistical methods to analyze the spatio-temporal evolution of fintech companies from 2011 to 2020, and utilizes Geodetector to investigate the primary factors influencing their layout. The findings reveal that: 1) The growth rate of fintech companies exhibits an "inverted U" trend over time, with overall spatial distribution disparities primarily stemming from regional variations, particularly evident in the eastern region. The distribution of these companies demonstrates a "point-axis-network" diffusion trend, centered around a "T-shaped" structure that combines the eastern coast and the Yangtze River. 2) The gravity center of fintech company distribution has shifted slightly towards the southwest of China, predominantly due to southward expansion, forming a "northeast-southwest" directional spatial pattern. 3) The agglomeration of fintech companies has intensified, resulting in a "two poles, one core, multiple regions" configuration, exhibiting a contiguous development trend. However, the agglomeration locations vary among different types of fintech companies. 4) The spatial distribution pattern of fintech companies is influenced by multiple factors. Across different developmental stages, economic strength, fiscal finance, innovation capability, and policy environment consistently serve as the core drivers of fintech company growth. Innovation incubation policies remain the strongest factor at every stage, while the second strongest factors differ across the three stages. Additionally, the influencing factors for different types of fintech companies exhibit heterogeneous characteristics. 5) The interaction among these dimensional factors has significantly intensified, albeit with notable variations. Fiscal finance, infrastructure, and policy environment all exert strong catalytic effects across various stages. In the comprehensive deepening stage, the innovation capability dimension not only exerts a significant impact but also substantially enhances the effectiveness of other factors.
表1 不同区域金融科技公司数量和增长率变化Tab.1 Changes in the number and growth rate of fintech companies in different regions |
| 区域 | 2011年公司数 (家) | 2016年公司数 (家) | 2020年公司数 (家) | 2011—2015 年均增长率(%) | 2016—2018 年均增长率(%) | 2019—2020 年均增长率(%) |
|---|---|---|---|---|---|---|
| 东部地区 | 552 | 3378 | 9896 | 38 | 41 | 26 |
| 中部地区 | 83 | 491 | 2366 | 39 | 50 | 44 |
| 西部地区 | 103 | 489 | 2290 | 34 | 53 | 37 |
| 东北地区 | 32 | 154 | 730 | 34 | 48 | 43 |
| 全国 | 770 | 4512 | 15282 | 37 | 44 | 30 |
表2 中国金融科技公司分布的泰尔指数测算结果Tab.2 Theil index measurements of the distribution of China's fintech companies |
| 年份 | 总体差异 | 组间差异及贡献度 | 组内差异及贡献度 | ||||
|---|---|---|---|---|---|---|---|
| 总体 | 东部地区 | 中部地区 | 西部地区 | 东北地区 | |||
| 2011 | 0.7817 | 0.3285(0.4203) | 0.4531(0.5797) | 0.5480(0.5012) | 0.1188(0.0163) | 0.3317(0.0577) | 0.0836(0.0044) |
| 2016 | 0.9801 | 0.3941(0.4021) | 0.5860(0.5979) | 0.7058(0.5391) | 0.2355(0.0261) | 0.2685(0.0297) | 0.0835(0.0029) |
| 2020 | 0.6076 | 0.2408(0.3962) | 0.3669(0.6038) | 0.4447(0.4739) | 0.1678(0.0428) | 0.3069(0.0757) | 0.1457(0.0115) |
注:括号内数值为贡献度。 |
表3 中国金融科技公司空间分布影响因素Tab.3 Factors influencing the spatial distribution of China's fintech companies |
| 维度 | 影响因子 | 代码 | 具体指标 |
|---|---|---|---|
| 经济实力 | 经济规模 | GDP总量 | |
| 经济发展水平 | 人均GDP | ||
| 产业结构高度 | 第三产业增加值/GDP | ||
| 财政金融 | 财政科技支持 | 财政科学技术支出/GDP | |
| 金融深化程度 | 金融机构人民币存贷款总额/GDP | ||
| 金融业发展水平 | 商业银行数量 | ||
| 基础设施 | 数字基建 | 电信业务收入 | |
| 交通服务能力 | 城市道路面积/行政区域面积 | ||
| 创新能力 | 创新产出水平 | 专利授权数 | |
| 创新产业链 | 科技型上市公司数量 | ||
| 人才供给能力 | 普通高等学校在校学生数 | ||
| 政策环境 | 创新孵化政策 | 风险投资数量 | |
| 生态环境政策 | 城市绿地面积/年平均常住人口数 |
表4 中国金融科技公司空间分布影响因子探测结果Tab.4 Detector results of influencing factors on the spatial distribution of China's fintech companies |
| 影响因子 | 2011—2015年 初始起步阶段 | 2016—2018年 快速发展阶段 | 2019—2020年 全面深化阶段 | |||||
|---|---|---|---|---|---|---|---|---|
| qstatistic | pvalue | qstatistic | pvalue | qstatistic | pvalue | |||
| 0.47 | 0.00 | 0.38 | 0.00 | 0.29 | 0.00 | |||
| 0.12 | 0.00 | 0.20 | 0.00 | 0.23 | 0.00 | |||
| 0.19 | 0.00 | 0.19 | 0.00 | 0.18 | 0.00 | |||
| 0.15 | 0.00 | 0.22 | 0.00 | 0.14 | 0.00 | |||
| 0.18 | 0.00 | 0.16 | 0.00 | 0.21 | 0.00 | |||
| 0.41 | 0.00 | 0.33 | 0.00 | 0.37 | 0.00 | |||
| 0.43 | 0.00 | 0.54 | 0.00 | 0.18 | 0.00 | |||
| 0.17 | 0.00 | 0.14 | 0.00 | 0.16 | 0.00 | |||
| 0.43 | 0.00 | 0.48 | 0.00 | 0.52 | 0.00 | |||
| 0.44 | 0.00 | 0.53 | 0.00 | 0.48 | 0.00 | |||
| 0.18 | 0.00 | 0.13 | 0.00 | 0.22 | 0.00 | |||
| 0.61 | 0.00 | 0.54 | 0.00 | 0.54 | 0.00 | |||
| 0.08 | 0.00 | 0.09 | 0.00 | 0.12 | 0.00 | |||
表5 金融科技公司分布影响因子交互探测结果(2019—2020年)Tab.5 Interactive detection results of influencing factors on the distribution of fintech companies (2019-2020) |
| 影响因子 | |||||||||||||
|---|---|---|---|---|---|---|---|---|---|---|---|---|---|
| 0.29 | |||||||||||||
| 0.41↗ | 0.23 | ||||||||||||
| 0.41↗ | 0.42↖ | 0.18 | |||||||||||
| 0.42↗ | 0.42↖ | 0.41↖ | 0.14 | ||||||||||
| 0.42↗ | 0.39↗ | 0.25↗ | 0.42↖ | 0.21 | |||||||||
| 0.49↗ | 0.65↖ | 0.54↗ | 0.70↖ | 0.58↗ | 0.37 | ||||||||
| 0.39↗ | 0.74↖ | 0.38↖ | 0.70↖ | 0.46↖ | 0.49↗ | 0.18 | |||||||
| 0.38↗ | 0.35↗ | 0.38↖ | 0.41↖ | 0.51↖ | 0.64↖ | 0.54↖ | 0.16 | ||||||
| 0.81↗ | 0.81↖ | 0.82↖ | 0.86↖ | 0.84↖ | 0.85↗ | 0.83↖ | 0.87↖ | 0.52 | |||||
| 0.50↗ | 0.50↗ | 0.56↗ | 0.53↗ | 0.55↗ | 0.61↗ | 0.80↖ | 0.71↖ | 0.93↗ | 0.48 | ||||
| 0.35↗ | 0.44↗ | 0.32↗ | 0.46↖ | 0.34↗ | 0.53↗ | 0.76↖ | 0.40↖ | 0.87↖ | 0.57↗ | 0.22 | |||
| 0.60↗ | 0.56↗ | 0.58↗ | 0.57↗ | 0.70↗ | 0.70↗ | 0.82↖ | 0.84↖ | 0.83↗ | 0.63↗ | 0.64↗ | 0.54 | ||
| 0.53↖ | 0.38↖ | 0.39↖ | 0.45↖ | 0.48↖ | 0.53↖ | 0.44↖ | 0.32↖ | 0.83↖ | 0.71↖ | 0.35↖ | 0.74↖ | 0.12 |
注:符号分别表示:↖非线性增强关系;↗双因子增强关系。 |
| [1] |
|
| [2] |
|
| [3] |
|
| [4] |
贾盾, 韩昊哲. 金融科技与商业银行竞争性负债[J]. 世界经济, 2023, 46(2):183-208.
|
| [5] |
蔡岑, 殷晓晴, 陈选娟. 金融科技创新路径选择与银行经营效率[J]. 财经研究, 2023, 49(3):19-33.
|
| [6] |
|
| [7] |
|
| [8] |
|
| [9] |
|
| [10] |
|
| [11] |
程雪军. 金融科技公司算法黑箱风险的生成机制与多维治理[J]. 金融论坛, 2023, 28(8):25-34,46.
|
| [12] |
|
| [13] |
|
| [14] |
|
| [15] |
|
| [16] |
|
| [17] |
|
| [18] |
潘峰华, 刘宇帆. 全球金融科技产业的分布及其影响因素研究进展[J]. 世界地理研究, 2021, 30(4):696-707.
|
| [19] |
刘程军, 陈亦婷, 陈秋驹, 等. 企业投资视角下金融科技的空间联系网络演化与影响因素[J]. 经济地理, 2023, 43(2):136-146.
|
| [20] |
刘辉, 申玉铭, 柳坤. 中国城市群金融服务业发展水平及空间格局[J]. 地理学报, 2013, 68(2):186-198.
|
| [21] |
程惠霞, 杨璐. 中国新型农村金融机构空间分布与扩散特征[J]. 经济地理, 2020, 40(2):163-170.
|
| [22] |
王艳华, 赵建吉, 刘娅娜, 等. 中国金融产业集聚空间格局与影响因素——基于地理探测器模型的研究[J]. 经济地理, 2020, 40(4):125-133.
|
| [23] |
赵建吉, 刘岩, 王艳华, 等. 欠发达地区城市群金融机构空间演化特征及影响因素——以中原城市群为例[J]. 经济地理, 2022, 42(1):70-78.
|
| [24] |
丁建军, 刘贤, 王淀坤, 等. 国家级专精特新“小巨人”企业空间分布及其影响因素[J]. 经济地理, 2022, 42(10):109-118.
|
| [25] |
杨洋, 乔家君, 郭远智, 等. 广东省瞪羚企业空间分布特征及驱动机制[J]. 经济地理, 2022, 42(8):112-122.
|
| [26] |
肖凡, 王姣娥, 黄宇金, 等. 中国高新技术企业分布影响因素的空间异质性与尺度效应[J]. 地理研究, 2022, 41(5):1338-1351.
|
| [27] |
袁康, 唐峰. 金融科技公司的风险防范与监管对策[J]. 山东大学学报(哲学社会科学版), 2021(5):59-71.
|
| [28] |
宋敏, 周鹏, 司海涛. 金融科技与企业全要素生产率——“赋能”和信贷配给的视角[J]. 中国工业经济, 2021(4):138-155.
|
| [29] |
唐士亚. 中国金融科技治理模式变迁及其逻辑[J]. 经济社会体制比较, 2022(5):90-99.
|
| [30] |
巴曙松, 白海峰. 金融科技的发展历程与核心技术应用场景探索[J]. 清华金融评论, 2016(11):99-103.
|
| [31] |
刘勇. 金融科技十讲[M]. 北京: 中国人民大学出版社, 2020.
|
| [32] |
丛海彬, 段巍, 吴福象. 新型城镇化中的产城融合及其福利效应[J]. 中国工业经济, 2017(11):62-80.
|
| [33] |
|
| [34] |
|
| [35] |
乔海曙, 黄荐轩. 金融科技发展动力指数研究[J]. 金融论坛, 2019, 24(3):64-80.
|
/
| 〈 |
|
〉 |