
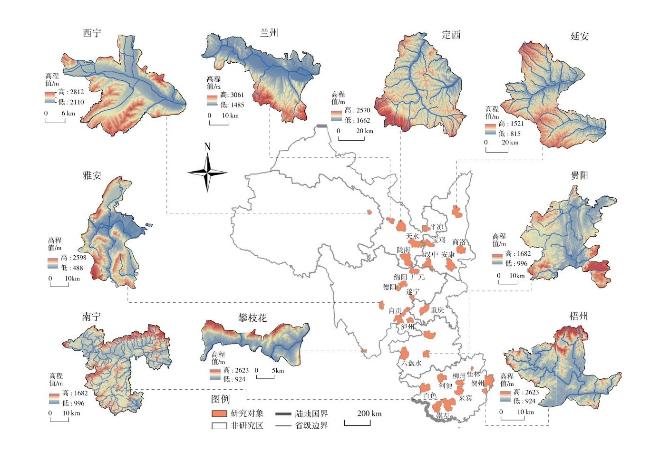
西部河谷城市空间结构对碳排放量的影响
|
张新红(1981—),男,博士,副教授,硕士生导师,研究方向为城市与区域规划。E-mail:406630970@qq.com |
收稿日期: 2024-02-22
修回日期: 2024-07-10
网络出版日期: 2025-05-12
基金资助
国家自然科学基金项目(42261034)
Influences of Urban Spatial Structure on Carbon Emissions for the Western Valley Cities
Received date: 2024-02-22
Revised date: 2024-07-10
Online published: 2025-05-12
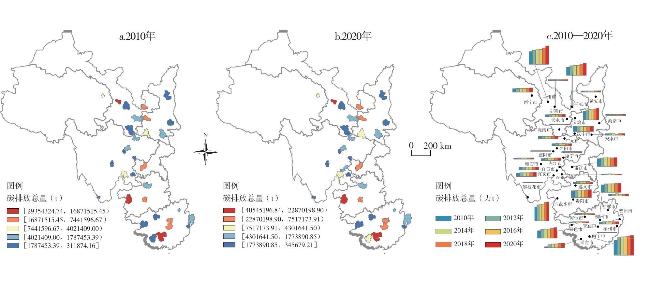
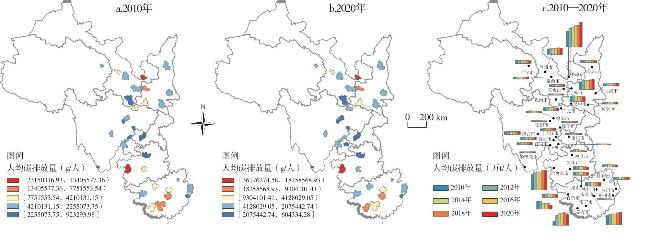
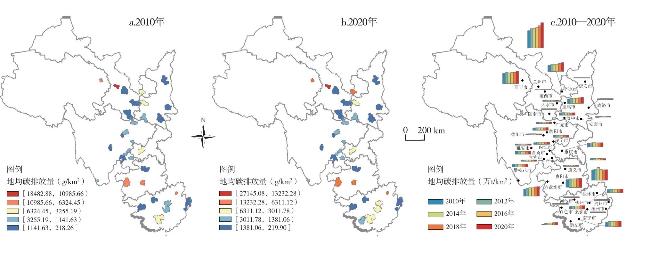
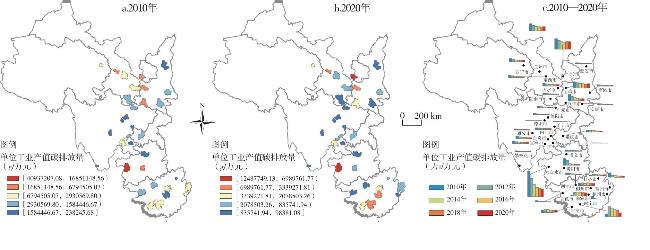
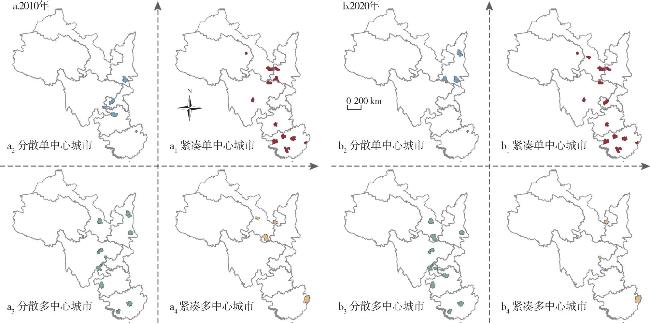
科学认知城市空间结构对碳排放的影响,对明晰城市碳减排路径具有重要意义。文章选择组团结构鲜明的34个西部河谷城市为研究对象,采用2010—2020年的多元经济社会数据,在解析其碳排放量与空间结构分布特征的基础上,借助固定效应多元回归分析模型探究城市空间结构对碳排放量的影响。研究发现:①城市碳排放总量和均量均呈现出南北高而中间低的分布格局,11年间总量与均量变化的差异性均较大。②基于空间集中与集聚指数可将城市空间结构划分为4种类型,11年内大部分城市的空间结构相对保持稳定,但其空间分布具有明显的地域差异性。③案例对比、基准回归和稳健检验分析均表明,紧凑(多中心)空间结构有利于降低西部河谷城市的碳排放总量、人均碳排放量和地均碳排放量。但异质性检验分析得出,紧凑型空间结构仅有利于西南河谷城市和用地规模中等城市的碳减排,紧凑多中心空间结构仅有利于人口规模小的城市降低碳排放量。
张新红 , 王诗涵 , 董建红 , 张娜 , 李晶 . 西部河谷城市空间结构对碳排放量的影响[J]. 经济地理, 2025 , 45(2) : 80 -90 . DOI: 10.15957/j.cnki.jjdl.2025.02.008
Scientifically understanding the influences of spatial structure on carbon emissions is is crucial for identifying the pathways to urban carbon emission reduction. Taking 34 western valley cities with distinctive group structures as samples, and based on the panel data of western valley from 2010 to 2020, this study analyzes carbon emissions and its distribution characteristics of spatial structure, and employs a fixed-effect multiple regression analysis model to explore the influences of urban spatial structure on carbon emissions. It's found that: 1) Both total and average values of urban carbon emissions show a uneven distribution pattern which is high in the north and south of research area, and low in the middle of research area, with large variations in the changes of total and average values in 2010-2020. 2) Based on the concentration index and agglomeration index, the urban spatial structure can be classified into four types. The spatial structure of most cities remained stable relatively in 2010-2020, but their spatial distribution exhibited obvious geographical differences. 3) According to the case comparison, baseline regression and robustness tests, it indicates that compact (polycentric) spatial structure is conducive to reducing total, per capita and per square kilometer carbon emissions in western cities in the valley. However, the heterogeneity test analysis concludes that the compact spatial structure is only conducive to carbon emission reduction for the southwest of research area and cities with medium land use, the compact polycentric spatial structure is only conducive to carbon emission reduction in cities with small population sizes.
表1 指标的描述性统计Tab.1 Descriptive statistics of indicators |
| 变量 | 定义 | 单位 | 数量 | 平均值 | 标准差 | 最小值 | 最大值 |
|---|---|---|---|---|---|---|---|
| lnCE | 碳排放量 | g | 374 | 28.95 | 1.148 | 26.47 | 31.33 |
| lnCEpp | 人均碳排放量 | g/人 | 374 | 15.19 | 0.849 | 13.31 | 17.40 |
| lnCEpl | 地均碳排放量 | g/km² | 374 | 21.38 | 1.145 | 19.14 | 24.02 |
| lnCEpi | 单位工业产值碳排放量 | g/万元 | 374 | 14.44 | 1.128 | 11.50 | 17.53 |
| Aci | 空间集中指数 | - | 374 | 0.484 | 0.162 | 0.046 | 0.764 |
| Gini | 空间集聚指数 | - | 374 | 0.804 | 0.099 | 0.333 | 0.963 |
| lnPop | 人口规模 | 人 | 374 | 13.76 | 0.696 | 12.63 | 15.85 |
| lnPopden | 人口密度 | 人/km² | 374 | 6.187 | 1.007 | 4.603 | 8.295 |
| lnBuilt | 建成区面积 | km² | 374 | 4.230 | 0.900 | 2.565 | 7.356 |
| lnGdpper | 人均GDP | 万元/人 | 374 | 1.456 | 0.536 | -0.335 | 3.311 |
| lnIndu | 工业总产值 | 万元 | 374 | 14.29 | 1.308 | 10.40 | 18.24 |
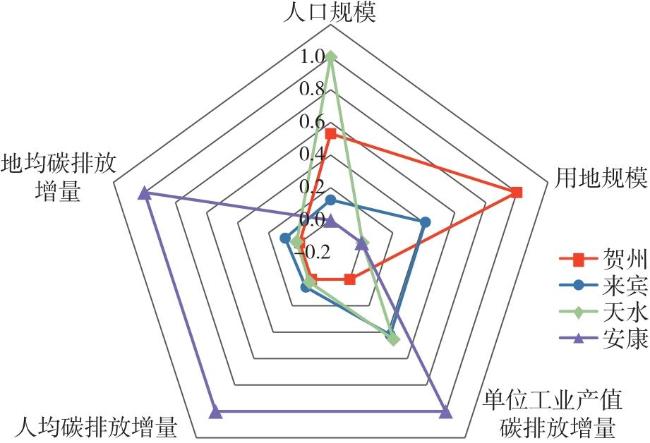
表2 2010—2020年四类空间结构城市的碳排放增量Tab.2 Carbon emission increment from four types of urban spatial structure in 2010 and 2020 |
| 空间结构 | 代表城市 | 人口规模 (万人) | 用地规模 (km²) | 人均碳排放增量 (t/人) | 地均碳排放增量 (t/km²) | 单位工业产值碳排放增量 (t/万元) |
|---|---|---|---|---|---|---|
| 紧凑多中心 | 贺州 | 106 | 5513.07 | 158917.23 | 61454381.94 | -5183130.26 |
| 紧凑单中心 | 天水 | 121 | 3640.85 | 256286.58 | 80703518.77 | -1301212.24 |
| 分散多中心 | 来宾 | 93 | 4403.67 | 434392.61 | 155549192.62 | -1588861.82 |
| 分散单中心 | 安康 | 89 | 3631.03 | 4852991.56 | 1070403735.22 | 3358539.18 |
表3 基准回归与稳健检验分析结果Tab.3 Results of baseline regression and robustness test |
| 变量 | (1) lnCE | (2) lnCE | (3) lnCEpp | (4) lnCEpl | (5) lnCEpi | (6) lnCE | (7) lnCE |
|---|---|---|---|---|---|---|---|
| Aci | 0.094*(0.0520) | 0.094*(0.0526) | 0.094*(0.0526) | 0.094*(0.0526) | 0.147(0.1203) | 0.649***(0.2257) | 0.090*(0.0529) |
| Gini | -0.166*(0.0928) | -0.178*(0.0939) | -0.178*(0.0939) | -0.178*(0.0939) | -0.242(0.2148) | -0.176*(0.0932) | -0.531(0.4913) |
| lnPop | -0.008(0.4649) | -1.008**(0.4649) | -1.008**(0.4649) | -1.458(1.0631) | 0.115(0.4636) | -0.069(0.4725) | |
| lnPopden | 0.020(0.4575) | 0.020(0.4575) | 1.020**(0.4575) | 0.085(1.0464) | -0.092(0.4559) | 0.079(0.4650) | |
| lnBuilt | -0.034(0.0382) | -0.034(0.0382) | -0.034(0.0382) | -0.054(0.0875) | 0.028(0.0451) | -0.102(0.1012) | |
| lnGdpper | -0.033(0.0408) | -0.033(0.0408) | -0.033(0.0408) | -1.107***(0.0932) | -0.027(0.0405) | -0.031(0.0409) | |
| lnIndu | 0.019(0.0134) | 0.019(0.0134) | 0.019(0.0134) | -0.031(0.0307) | 0.016(0.0134) | 0.019(0.0134) | |
| Aci*lnBuilt | -0.128**(0.0508) | ||||||
| Gini*lnBuilt | 0.085(0.1169) | ||||||
| 常数项 | 30.736***(0.0805) | 30.647***(3.3865) | 30.647***(3.3865) | 30.647***(3.3865) | 39.380***(7.7445) | 29.488***(3.3898) | 31.357***(3.5253) |
注:***、**和*分别为1%、5%和10%水平上的显著性;括号内数值为标准误。表4同。 |
表4 异质性检验结果Tab.4 Results of heterogeneity tests |
| 变量 | (8) lnCE | (9) lnCE | (10) lnCE | (11) lnCE | (12) lnCE | (13) lnCE | (14) lnCE | (15) lnCE |
|---|---|---|---|---|---|---|---|---|
| Aci | 0.114 | 0.100 | 0.583** | 0.015 | -0.012 | 0.026 | 0.133 | -0.005 |
| (0.0712) | (0.0632) | (0.2752) | (0.0561) | (0.0621) | (0.0344) | (0.1365) | (0.1010) | |
| Gini | 0.030 | -0.203* | -1.036** | -0.000 | 0.066 | -0.017 | -0.510** | -0.016 |
| (0.1177) | (0.1139) | (0.4484) | (0.1012) | (0.1238) | (0.0578) | (0.2565) | (0.2698) | |
| lnPop | -0.340 | -1.093*** | -0.155 | 17.994*** | 8.277*** | 0.084** | 0.246 | 7.774*** |
| (0.2993) | (0.1014) | (1.1471) | (3.7242) | (0.1905) | (0.0377) | (0.7516) | (0.2511) | |
| lnPopden | 0.115 | 1.101*** | 0.234 | -18.340*** | -8.232*** | -0.176*** | 0.180 | -7.743*** |
| (0.2467) | (0.0277) | (1.0064) | (3.8689) | (0.2022) | (0.0508) | (0.6900) | (0.1964) | |
| lnBuilt | 0.070 | -0.043 | -0.277 | -0.004 | -0.020 | 0.024 | -0.107 | 0.055 |
| (0.0471) | (0.0512) | (0.1988) | (0.0625) | (0.0352) | (0.0384) | (0.0862) | (0.0483) | |
| lnGdpper | -0.246*** | -0.016 | -0.417 | -0.043 | -0.016 | -0.006 | -0.030 | -0.139* |
| (0.0788) | (0.0468) | (0.2658) | (0.0436) | (0.0510) | (0.0408) | (0.0747) | (0.0747) | |
| lnIndu | -0.008 | 0.025 | 0.171** | -0.001 | -0.029* | -0.003 | 0.032 | 0.021 |
| (0.0160) | (0.0167) | (0.0658) | (0.0154) | (0.0164) | (0.0136) | (0.0271) | (0.0231) | |
| 常数项 | 34.761*** | 28.980*** | 28.243** | -117.181*** | -37.111*** | 28.880*** | 23.938*** | -35.544*** |
| (2.9415) | (1.3242) | (10.6565) | (29.8639) | (1.4816) | (0.5794) | (6.7404) | (2.5425) | |
| 样本量 | 88 | 286 | 73 | 120 | 181 | 165 | 154 | 55 |
| [1] |
王凯, 陈明. 中国绿色城镇化的认识论[J]. 城市规划学刊, 2021(1):10-17.
|
| [2] |
|
| [3] |
|
| [4] |
|
| [5] |
潘海啸, 汤諹, 吴锦瑜, 等. 中国“低碳城市”的空间规划策略[J]. 城市规划学刊, 2008(6):57-64.
|
| [6] |
熊健, 卢柯, 姜紫莹, 等. “碳达峰、碳中和”标下国土空间规划编制研究与思考[J]. 城市规划学刊, 2021(4):74-80.
|
| [7] |
郑德高, 吴浩, 林辰辉, 等. 基于碳核算的城市减碳单元构建与规划技术集成研究[J]. 城市规划学刊, 2021(4):43-50.
|
| [8] |
|
| [9] |
|
| [10] |
|
| [11] |
|
| [12] |
|
| [13] |
秦波, 邵然. 低碳城市与空间结构优化:理念、实证和实践[J]. 国际城市规划, 2011, 26(3):72-77.
|
| [14] |
韩帅帅, 苗长虹, 李奕灿. 黄河流域城市多中心空间结构对碳排放的影响研究[J]. 地理研究, 2023, 42(4):936-954.
|
| [15] |
孙瑜. 城市空间形态与碳排放的关系研究[D]. 杭州: 浙江大学, 2022.
|
| [16] |
魏洪波. 城市规模等要素对碳排放的影响研究[D]. 哈尔滨: 哈尔滨工业大学, 2019.
|
| [17] |
何小钰, 庄雅烨, 邱穗萱, 等. 城市三维空间结构对碳排放影响的尺度效应分析[J]. 生态学报, 2024(2):1-13.
|
| [18] |
梁静宜. 长三角地区城市紧凑度与碳排放的时空互动关系研究[D]. 杭州: 浙江大学, 2023.
|
| [19] |
张鑫. 青岛西海岸新区碳排放空间分布特征及其优化策略[D]. 西安: 西安建筑科技大学, 2023.
|
| [20] |
方丹, 杨谨, 陈绍晴. 城市群多中心发展的碳减排效应及其作用机制[J]. 中国人口·资源与环境, 2023, 33(9):45-58.
|
| [21] |
王颖. 武汉市国土空间碳排放时空演变及情景模拟研究[D]. 武汉: 中国地质大学(武汉), 2023.
|
| [22] |
田达睿, 杨帅, 关冲, 等. 城市空间集聚性与居民生活碳排放相关性探索——基于全国110个城市数据的分析[J]. 城市规划, 2023, 47(7):76-85.
|
| [23] |
俞洁, 张勇, 李清瑶. 长三角碳排放空间关联网络结构特征及演化机制[J]. 自然资源学报, 2024, 39(2):372-391.
|
| [24] |
王桂新, 武俊奎. 城市规模与空间结构对碳排放的影响[J]. 城市发展研究, 2012, 19(3):89-95,112.
|
| [25] |
|
| [26] |
杨文越, 梁斐雯, 曹小曙. 多尺度建成环境对居民通勤出行碳排放的影响——来自广州的实证研究[J]. 地理研究, 2020, 39(7):1625-1639.
|
| [27] |
丛建辉. 碳中和愿景下中国城市形态的碳排放影响效应研究——基于289个地级市的数据分析[J]. 贵州社会学, 2021(9):125-134.
|
| [28] |
史方晨. 可持续发展视角下城市形态对碳排放的影响研究[D]. 重庆: 重庆大学, 2022.
|
| [29] |
方时姣, 张柯. 长江经济带城市蔓延对能源碳排放的影响研究——来自夜间灯光的经验证据[J]. 学习与实践, 2022(10):30-39.
|
| [30] |
杨文越, 曹小曙. 居住自选择视角下的广州出行碳排放影响机理[J]. 地理学报, 2018, 73(2):346-361.
|
| [31] |
黄经南, 李丹哲, 韩笋生. 武汉市家庭碳排放的空间分布特征研究[J]. 现代城市研究, 2015(10):108-116.
|
| [32] |
张赫, 于丁一, 王睿, 等. 面向低碳生活的县域城镇空间结构优化研究[J]. 规划师, 2020, 36(24):12-20.
|
| [33] |
冷红, 宋世一. 严寒地区城市形态对建筑用电能耗影响实证研究[J]. 建筑学报, 2021(Sup1):108-113.
|
| [34] |
林辰辉, 朱雯娟, 张永波, 等. “双碳”目标下的国土空间规划方法研究与实践——以天津市为例[J]. 城市规划学刊, 2022(Sup2):229-234.
|
| [35] |
王睿, 张赫, 强文丽, 等. 基于城镇化的中国县级城市碳排放空间分布特征及影响因素[J]. 地理科学进展, 2021, 40(12):1999-2010.
|
| [36] |
|
| [37] |
滕菲, 王艳军, 王孟杰, 等. 长三角城市群城市空间形态与碳收支时空耦合关系[J]. 生态学报, 2022, 42(23):9636-9650.
|
| [38] |
|
| [39] |
|
| [40] |
方创琳, 祁巍锋. 紧凑城市理念与测度研究进展及思考[J]. 城市规划学刊, 2007(4):65-73.
|
| [41] |
滕菲, 王艳军, 王孟杰, 等. 长三角城市群城市空间形态与碳收支时空耦合关系[J]. 生态学报, 2022, 42(23):9636-9650.
|
| [42] |
|
| [43] |
|
| [44] |
钟娟, 冯慧敏, 魏彦杰. “中心—外围”视角下城市碳排放转移的经济脱碳效应——基于长三角地区地级及以上城市数据的实证分析[J]. 城市问题, 2024(3):65-78.
|
| [45] |
杨永春, 汪一鸣. 中国西部河谷型城市地域结构与形态研究[J]. 地域研究与开发, 2000(4):58-61.
|
| [46] |
杨永春. 中国西部河谷型城市的发展与空间结构研究[M]. 兰州: 兰州大学出版社, 2003.
|
| [47] |
|
| [48] |
文余源, 刘洋, 邢晓旭, 等. 人口收缩视角下中国产业集聚与城市人口规模演化及其关系[J]. 经济地理, 2023, 43(11):115-125.
|
| [49] |
戴宏伟, 杨宏昌. 中国城市群空间结构对科技创新的影响[J]. 经济地理, 2023, 43(12):36-47.
|
/
| 〈 |
|
〉 |