
城市居民旅游景区偏好的代际差异
|
吴晋峰(1969—),女,博士,教授,博士生导师,研究方向为旅游开发与规划。E-mail:jfwu@snnu.edu.cn |
收稿日期: 2024-11-26
修回日期: 2025-01-14
网络出版日期: 2025-05-12
基金资助
国家自然科学基金项目(41671135)
Intergenerational Differences in Urban Residents' Preferences for Scenic Spots
Received date: 2024-11-26
Revised date: 2025-01-14
Online published: 2025-05-12
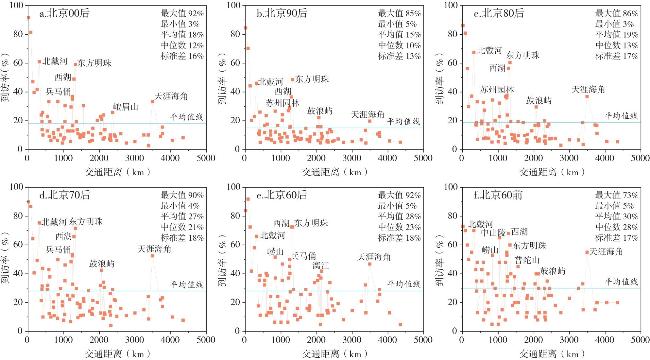
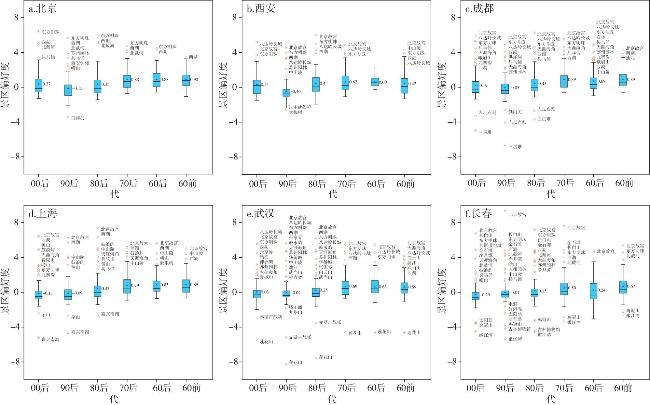
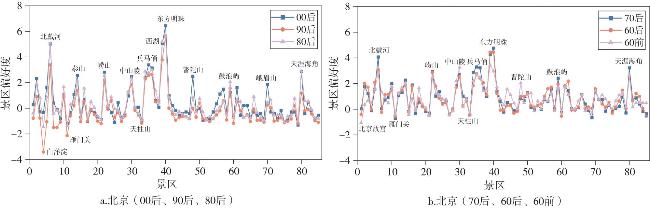
正确认识城市居民的景区偏好及其代际差异是提高旅游业精准服务能力的前提和基础。文章以北京、西安、成都、上海、武汉、长春6个城市为案例地,采用大样本问卷调查获得的136个高级别景区、516个到访率数据,通过构建景区偏好度指标,定量研究6代城市居民旅游景区偏好的代际差异。研究发现:①景区偏好及其代际差异均符合二八法则;②景区偏好具有代际传递效应,且呈现“3代一组”的特点;③景区偏好度主要与景区知名度相关,与O-D距离、景区性质及等级关系不大;④年龄越大的代群,景区到访率越高、出游空间越大,但2000年后出生的城市居民表现特殊。
吴晋峰 , 徐雪 , 任雪宁 . 城市居民旅游景区偏好的代际差异[J]. 经济地理, 2025 , 45(2) : 203 -212 . DOI: 10.15957/j.cnki.jjdl.2025.02.020
A precise comprehension of urban residents' preference degree for scenic spots and their intergenerational differences is a foundational premise for enhancing the precision service of the tourism industry. Taking Beijing, Xi'an, Chengdu, Shanghai, Wuhan, and Changchun as case cities, this paper constructs the index of preference degree for scenic spots and quantitatively analyzes the intergenerational differences of 6 generations of urban residents' preference on the basis of the 516 visiting rate data of 136 high-level scenic spots. The research yields the following insights: 1) Urban residents' preferences for scenic spots and their intergenerational differences adhere to the Pareto's Principle, 20% of scenic spots with high preference degree, 80% of scenic spots with medium and low preference degree, 20% of scenic spots do not have intergenerational difference in preference degree, 80% of scenic spots have intergenerational difference in preference degree. 2) Urban residents' preferences for scenic spots exhibit an intergenerational transmission effects, characterized by a "three generations in one group" pattern with the 70s as the boundary. 3) Urban residents' preference degree for scenic spots is primarily associated with the scenic spot popularity, with minimal correlation to O-D distance, scenic spot nature and grade. 4) Older generational groups demonstrate higher visitation rates and larger travel spaces, although urban residents born after the year 2000 exhibit unique behavioral patterns.
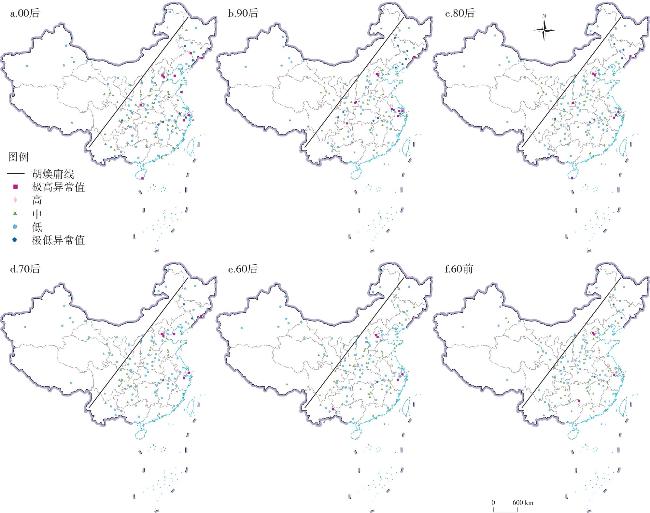
表1 景区到访率全局空间自相关显著性检验结果Tab.1 Results of the significance test for global spatial autocorrelation of visiting rates for scenic spots |
| 城市 | 00后 | 90后 | 80后 | 70后 | 60后 | 60前 | |
|---|---|---|---|---|---|---|---|
| 北京 | Moran's I | 0.36 | 0.35 | 0.36 | 0.32 | 0.29 | 0.30 |
| Z | 11.68 | 11.60 | 11.50 | 10.18 | 9.41 | 9.55 | |
| 西安 | Moran's I | 0.23 | 0.62 | 0.21 | 0.23 | 0.17 | 0.12 |
| Z | 7.11 | 5.74 | 6.52 | 7.14 | 5.17 | 3.87 | |
| 成都 | Moran's I | 0.45 | 0.38 | 0.38 | 0.40 | 0.38 | 0.23 |
| Z | 15.75 | 13.69 | 13.11 | 13.72 | 13.03 | 8.01 | |
| 上海 | Moran's I | 0.25 | 0.29 | 0.32 | 0.34 | 0.35 | 0.38 |
| Z | 8.42 | 9.65 | 10.31 | 10.65 | 11.07 | 11.94 | |
| 武汉 | Moran's I | 0.14 | 0.13 | 0.16 | 0.21 | 0.30 | 0.26 |
| Z | 4.32 | 4.36 | 5.13 | 6.51 | 8.81 | 7.85 | |
| 长春 | Moran's I | 0.62 | 0.59 | 0.51 | 0.46 | 0.44 | 0.23 |
| Z | 14.65 | 13.85 | 11.59 | 10.37 | 9.71 | 5.27 | |
注:P值均小于0.001。 |
表2 案例城市各代景区到访率中位数、平均值和标准差(单位:%)Tab.2 Median,mean and standard deviation of visiting rate for scenic spots by generation in case cities (unit:%) |
| 城市 | 00后 | 90后 | 80后 | 70后 | 60后 | 60前 | 标准差 | |||||||||||||
|---|---|---|---|---|---|---|---|---|---|---|---|---|---|---|---|---|---|---|---|---|
| M | m | M | m | M | m | M | m | M | m | M | m | M | m | |||||||
| 北京 | 12 | 18 | 10 | 15 | 13 | 19 | 21 | 27 | 23 | 28 | 28 | 30 | 6.32 | 5.68 | ||||||
| 西安 | 17 | 20 | 10 | 14 | 15 | 20 | 18 | 24 | 28 | 33 | 14 | 22 | 5.44 | 5.94 | ||||||
| 成都 | 11 | 17 | 10 | 15 | 12 | 19 | 19 | 26 | 17 | 24 | 23 | 30 | 4.71 | 5.46 | ||||||
| 上海 | 7 | 12 | 8 | 12 | 10 | 16 | 15 | 21 | 17 | 22 | 18 | 24 | 4.33 | 4.87 | ||||||
| 武汉 | 7 | 13 | 8 | 12 | 9 | 14 | 15 | 20 | 13 | 18 | 13 | 19 | 2.94 | 3.22 | ||||||
| 长春 | 6 | 10 | 7 | 12 | 8 | 13 | 10 | 16 | 9 | 14 | 18 | 20 | 3.83 | 3.34 | ||||||
| 标准差 | 3.64 | 3.62 | 1.39 | 1.29 | 2.41 | 2.58 | 3.7 | 3.48 | 6.25 | 6.26 | 4.95 | 4.48 | - | - | ||||||
表3 案例城市景区偏好度K均值聚类结果(单位:%)Tab.3 K-means clustering algorithm results of preference degree for scenic spots by generation in case cities(unit: %) |
| 案例 城市 | 类型 | 00后 占比 | 90后 占比 | 80后 占比 | 70后 占比 | 60后 占比 | 60前 占比 |
|---|---|---|---|---|---|---|---|
| 北京 | 高 | 11 | 22 | 13 | 10 | 14 | 24 |
| 中 | 25 | 74 | 31 | 43 | 33 | 45 | |
| 低 | 64 | 4 | 56 | 47 | 53 | 31 | |
| 西安 | 高 | 20 | 37 | 20 | 9 | 17 | 15 |
| 中 | 40 | 59 | 30 | 30 | 35 | 40 | |
| 低 | 40 | 4 | 50 | 61 | 48 | 45 | |
| 成都 | 高 | 5 | 11 | 12 | 10 | 10 | 9 |
| 中 | 23 | 31 | 20 | 34 | 41 | 27 | |
| 低 | 72 | 58 | 68 | 56 | 49 | 64 | |
| 上海 | 高 | 11 | 11 | 13 | 10 | 13 | 12 |
| 中 | 32 | 28 | 34 | 23 | 33 | 35 | |
| 低 | 57 | 61 | 53 | 67 | 54 | 53 | |
| 武汉 | 高 | 13 | 8 | 11 | 19 | 8 | 16 |
| 中 | 41 | 29 | 46 | 32 | 33 | 36 | |
| 低 | 46 | 64 | 43 | 49 | 59 | 48 | |
| 长春 | 高 | 15 | 13 | 11 | 15 | 14 | 17 |
| 中 | 49 | 39 | 35 | 29 | 33 | 32 | |
| 低 | 36 | 48 | 54 | 56 | 53 | 51 | |
| 6个案 例城市 合计 | 异常高 | 9 | 10 | 8 | 5 | 4 | 4 |
| 高 | 11 | 15 | 12 | 12 | 12 | 15 | |
| 中 | 32 | 38 | 29 | 30 | 33 | 34 | |
| 低 | 47 | 34 | 49 | 52 | 50 | 46 | |
| 异常低 | 1 | 3 | 2 | 1 | 1 | 1 | |
| 异常高+高 | 20 | 25 | 20 | 17 | 16 | 19 |
表4 景区偏好度与景区知名度斯皮尔曼相关系数显著性检验结果Tab.4 Results of significance test of Spearman correlation coefficient between the preference degree for scenic spots and the popularity degree of scenic spots |
| 代 | 北京 | 西安 | 成都 | 上海 | 武汉 | 长春 |
|---|---|---|---|---|---|---|
| 00后 | 0.698** | 0.565** | 0.589** | 0.758** | 0.470** | 0.567** |
| 90后 | 0.562** | 0.368** | 0.538** | 0.738** | 0.500** | 0.528** |
| 80后 | 0.730** | 0.729** | 0.567** | 0.725** | 0.607** | 0.605** |
| 70后 | 0.733** | 0.774** | 0.663** | 0.738** | 0.752** | 0.734** |
| 60后 | 0.748** | 0.717** | 0.723** | 0.791** | 0.578** | 0.706** |
| 60前 | 0.606** | 0.505** | 0.569** | 0.739** | 0.690** | 0.523** |
注: ** 表示在 0.01 级别(双尾)相关性显著。表5同。 |
表5 景区偏好度代际斯皮尔曼相关系数(北京)Tab.5 Spearman correlation coefficients of the preference degree for scenic spots by generation (Beijing) |
| 代 | 00后 | 90后 | 80后 | 70后 | 60后 | 60前 |
|---|---|---|---|---|---|---|
| 00后 | 1.000 | 0.999** | 1.000** | 1.000** | 0.999** | 0.999** |
| 90后 | 0.999** | 1.000 | 1.000** | 1.000** | 0.999** | 1.000** |
| 80后 | 1.000** | 1.000** | 1.000 | 1.000** | 0.999** | 1.000** |
| 70后 | 1.000** | 1.000** | 1.000** | 1.000 | 0.999** | 0.999** |
| 60后 | 0.999** | 0.999** | 0.999** | 0.999** | 1.000 | 0.999** |
| 60前 | 0.999** | 1.000** | 1.000** | 0.999** | 0.999** | 1.000 |
| [1] |
白凯, 马耀峰. 旅游者购物偏好行为研究:以西安入境旅游者为例[J]. 旅游学刊, 2007, 22(11):52-57.
|
| [2] |
梁江川, 张伟强. 基于活动偏好市场细分的旅游产品谱系开发:以开平碉楼世界文化遗产为例[J]. 旅游学刊, 2009, 24(9):36-42.
|
| [3] |
宋瑞, 杨晓琰. 促进旅游消费的有效途径:现象、规律与建议[J]. 河北大学学报:哲学社会科学版, 2024, 49(2):22-27.
|
| [4] |
韵江, 刘博. 距离产生美? ——代际差异视角下感知距离对游客行为意愿的影响机制研究[J]. 旅游学刊, 2023, 38(3):63-76.
|
| [5] |
吕兴洋, 骆晶晶, 唐孜彦. 红色旅游仪式感对青少年在线契合行为的影响研究[J]. 旅游学刊, 2023, 38(3):77-91.
|
| [6] |
许春晓, 唐敏. 代际差异视角下红色旅游政党认同行为的组态路径研究[J/OL]. 旅游科学,https://doi.org/10.16323/j.cnki.lykx.20240306.002.
|
| [7] |
胡其波, 黄丽满, 李军. 传统与新生何以融合并存——基于代际差异的旅游者真实性体验与忠诚度的影响关系研究[J]. 人文地理, 2023, 38(5):180-190.
|
| [8] |
杨玲. 旅游分享的代际差异及其影响因素[J]. 黑龙江科学, 2023, 14(7):1-6,11.
|
| [9] |
王晓庆. 国内外旅游偏好研究综述[J]. 现代城市研究, 2014 (1):110-115.
|
| [10] |
|
| [11] |
|
| [12] |
|
| [13] |
|
| [14] |
|
| [15] |
|
| [16] |
谷义江, 孙根年. 基于时间约束的北京市居民自驾游空间距离及目的地选择[J]. 经济地理, 2023, 43(11):229-239.
|
| [17] |
|
| [18] |
王朝辉, 汤陈松, 乔浩浩, 等. 基于数字足迹的乡村旅游流空间结构特征——以浙江省湖州市为例[J]. 经济地理, 2020, 40(3):225-233,240.
|
| [19] |
黄群芳, 陆玉麒, 陈晓艳. 旅游研究中的代际理论及其应用述评[J]. 热带地理, 2018, 38(1):25-33.
|
| [20] |
|
| [21] |
|
| [22] |
|
| [23] |
|
| [24] |
|
| [25] |
|
| [26] |
|
| [27] |
|
| [28] |
|
| [29] |
|
| [30] |
吴必虎, 唐俊雅, 黄安民, 等. 中国城市居民旅游目的地选择行为研究[J]. 地理学报, 1997(2):3-9.
|
| [31] |
张高军, 吴晋峰, 周靖超. 旅游目的地形象的代际差异比较——兼论代沟理论的3种不同学说[J]. 旅游学刊, 2017, 32(2):53-64.
|
| [32] |
吴晋峰, 石晓腾, 吴宝清. 基于城市居民累积出游经历的“吴曲线”变化研究[J]. 干旱区资源与环境, 2022, 36(12):172-183.
|
| [33] |
朱鹏亮, 李昭阳, 邵秀英. 传统村落游客感知价值代际差异研究——以碛口为例[J]. 干旱区资源与环境, 2021, 35(1):203-208.
|
| [34] |
|
| [35] |
吴宝清, 吴晋峰, 石晓腾, 等. 有多少人“慕名而来”?——旅游景区到访率与知名度的关系研究[J]. 旅游学刊, 2020, 35(1):78-94.
|
/
| 〈 |
|
〉 |