
外资主导下的汽车制造业空间分布特征及其影响因素——以广州为例
|
巫细波(1983—),男,广东五华人,副研究员。主要研究方向为区域经济、汽车产业、空间计量与GIS方法应用。E-mail:wuxibo @gz.gov.cn。 |
收稿日期: 2018-07-17
修回日期: 2019-02-10
网络出版日期: 2025-04-27
基金资助
广州市哲学社会科学规划课题(2017GZZK05)
广州市社会科学人文重点研究基地(广州国家中心城市研究基地)
Spatial Distribution Evolvement Characteristics and Influencing Factors of Automobile Manufacturing Industry under the Guidance of Foreign Investment:A Case Study of Guangzhou
Received date: 2018-07-17
Revised date: 2019-02-10
Online published: 2025-04-27
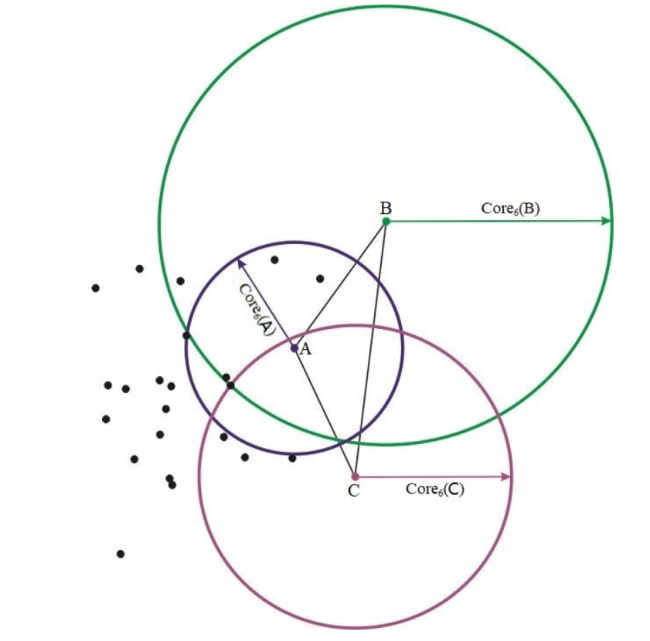
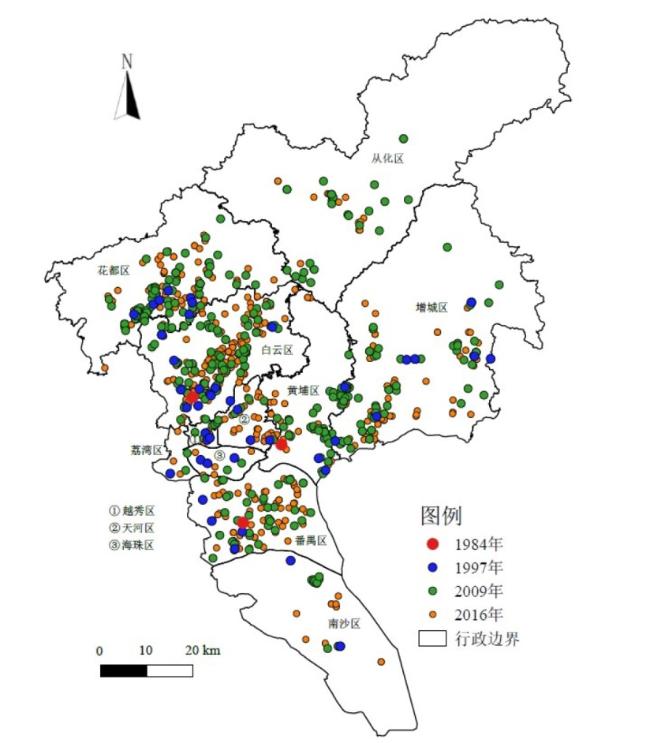
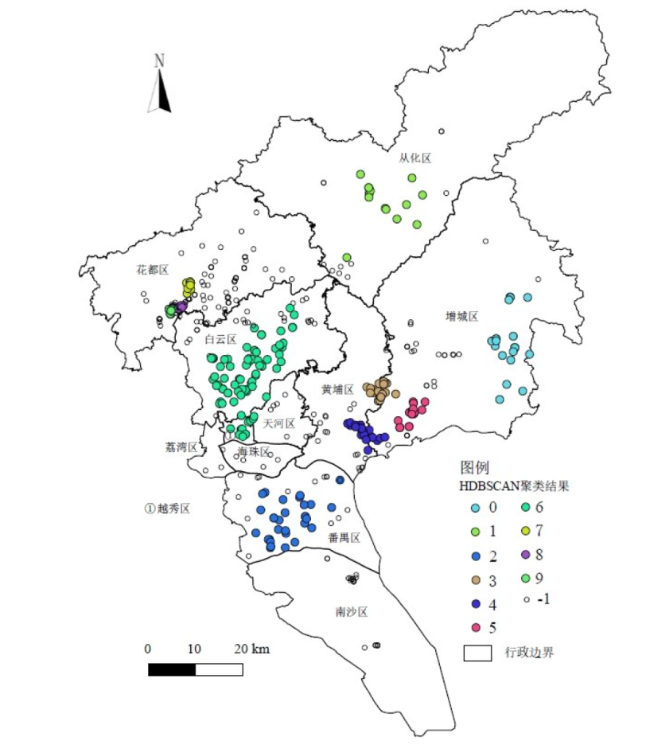
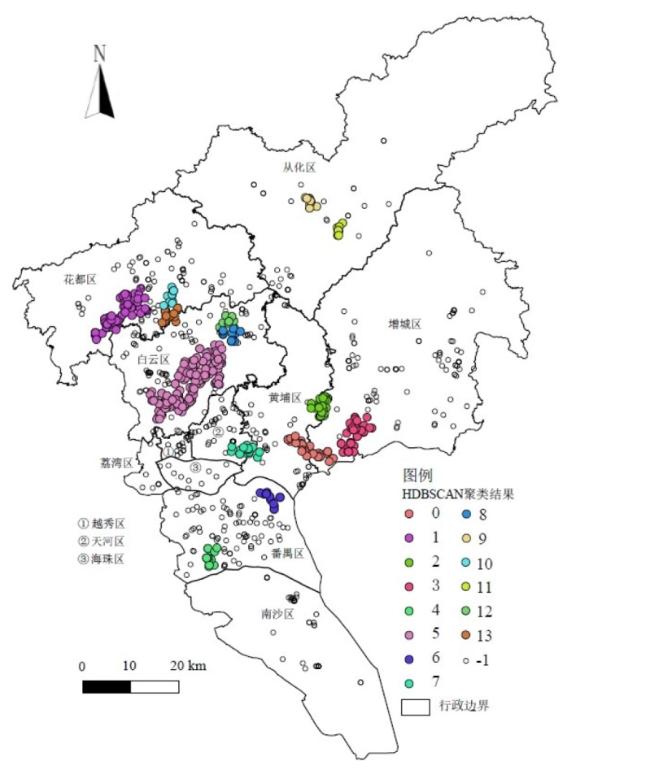
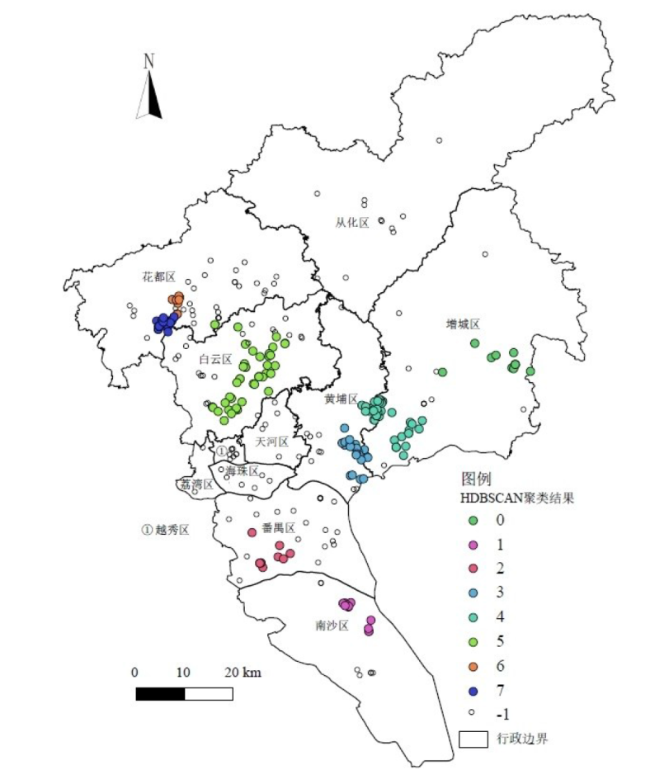
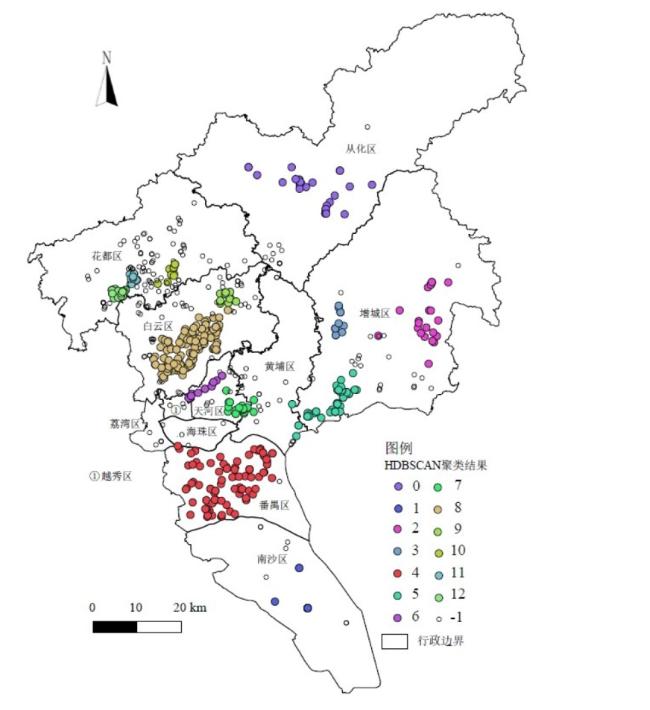
以1 069家广州汽车及零部件制造业企业为研究对象,采用GIS和HDBSCAN空间聚类方法分析其空间布局变化及特征,并采用负二项回归模型定量分析影响汽车制造业企业分布的因素,研究发现:①广州汽车制造业企业空间集聚特征显著,空间布局演变由近郊区往外围区域扩张;②由于长期过于依赖外资整车企业,导致广州汽车制造业产业链存在过于封闭的特征,对汽车零部件企业的辐射带动效应不足;③外资和内资汽车零部件企业在空间布局上存在明显差异,外资企业偏向围绕外资整车企业布局,而内资企业偏向沿交通干线布局;④广汽传祺、广汽客车等中国品牌对广州汽车零部件企业更具有辐射带动效应,有利于推动技术创新;⑤负二项回归模型显示整车带动、区位因素、集聚经济、人口密度等因素对汽车制造业企业空间布局有重要影响,而交通因素对广州汽车制造业企业布局影响不显著。
巫细波 . 外资主导下的汽车制造业空间分布特征及其影响因素——以广州为例[J]. 经济地理, 2019 , 39(7) : 119 -128 . DOI: 10.15957/j.cnki.jjdl.2019.07.014
Taking 1 069 automobile and parts manufacturing enterprises in Guangzhou as research object, this paper analyzes the spatial distribution evolution of Guangzhou automobile manufacturing industry and influencing factors by means of GIS, HDBSCAN spatial clustering and negative binomial regression model. It is concluded that: 1) Guangzhou's automobile manufacturing enterprises have significant spatial agglomeration characteristics, and their spatial layout evolves from suburban to peripheral areas. 2) Due to long-term overreliance on foreign companies, automobile manufacturing industry chain in Guangzhou is too closed, and the foreign-funded vehicle enterprises have insufficient radiation-induced effects on auto parts enterprises. 3) there are obvious differences in the spatial layout of foreign-funded and domestic-funded auto parts companies, foreign-funded enterprises tend to focus on the layout of foreign-funded vehicle companies, while domestic-funded enterprises tend to focus on the layout along the trunk line. 4) Chinese brand automobile companies including Guangzhou Automobile Group Motor and Guangzhou Automobile Group Autobus have more radiation-driving effects on Guangzhou automobile manufacturing industry and promote technological innovation. 5) It, based on the negative binomial regression model, shows that influencing factors such as driving effect of vehicle companies, location factors, agglomeration economy, and population density have an important impact on spatial layout of automobile manufacturing enterprises in Guangzhou. The traffic factor has no significant impact on layout of automobile manufacturing enterprises.
表1 1997—2016年广州各区汽车制造业企业数量Tab.1 Number of automobile manufacturing enterprises in Guangzhou in 1997-2016 |
| 区域 | 1997 | 2009 | 2016 | 2016年各区总数占比(%) |
|---|---|---|---|---|
| 越秀区 | 4 | 10 | 13 | 1.22 |
| 荔湾区 | 1 | 3 | 8 | 0.75 |
| 天河区 | 3 | 9 | 48 | 4.49 |
| 海珠区 | 3 | 6 | 11 | 1.03 |
| 白云区 | 13 | 100 | 300 | 28.06 |
| 黄埔区 | 5 | 65 | 88 | 8.23 |
| 番禺区 | 6 | 47 | 126 | 11.79 |
| 花都区 | 6 | 131 | 241 | 22.54 |
| 南沙区 | 1 | 16 | 36 | 3.37 |
| 增城区 | 7 | 71 | 143 | 13.38 |
| 从化区 | 0 | 27 | 55 | 5.14 |
| 总计 | 49 | 485 | 1 069 | - |
表2 1997—2016年广州汽车制造业企业平均最近邻指数Tab.2 The ANN index of Guangzhou's automobile manufacturing enterprises in 1997-2016 |
| 年份 | 样本平均距离 | 随机模式下的期望距离 | 平均最近邻指数 | Z值统计 | 显著性P值 |
|---|---|---|---|---|---|
| 1997 | 3 381.28 | 5 333.33 | 0.727 | -3.65 | 0.00 |
| 2009 | 816.56 | 1 974.74 | 0.413 | -24.71 | 0.00 |
| 2016 | 502.85 | 1 389.59 | 0.362 | -39.91 | 0.00 |
表3 变量及其统计信息描述Tab.3 Description of variables and its statistics |
| 变量 | 单位 | 样本数 | 均值 | 标准差 | 最小值 | 最大值 | 说明 |
|---|---|---|---|---|---|---|---|
| 汽车制造业企业数据(Y) | 家 | 166 | 6.44 | 15.61 | 0 | 125 | 各街镇汽车制造业企业数,有59个街镇数据为0 |
| 人口规模(X11) | 千人 | 166 | 76.52 | 55.08 | 3.4 | 391.3 | 根据最新一期2010年广州人口普查数据 |
| 人口密度(X12) | 百人/km2 | 166 | 170.57 | 206.73 | 0.4 | 956.6 | 根据最新一期2010年广州人口普查数据 |
| 道路长度(X21) | km | 166 | 9.46 | 7.01 | 0.47 | 40.34 | 数据来源于Open Street Map,时间为2017年1月,采用QGIS软件计算得到各街镇道路长度 |
| 道路密度(X22) | km/km2 | 166 | 122.49 | 138.91 | 4.489 | 739.74 | 同上 |
| 区位因素(X31) | - | 166 | 2.31 | 0.82 | 1 | 3 | 将广州166个街镇分成中心城区、近郊区及远郊区三类,分别赋值3、2、1 |
| 整车因素(X41) | - | 166 | 1.38 | 0.59 | 1 | 3 | 有整车企业街镇赋值3,整车企业临近街镇赋值2,其他则赋值1 |
| 公司企业数(X51) | 百家 | 166 | 12.34 | 13.32 | 0.09 | 85.5 | 从高德地图抓取公司企业POI数据并统计各街镇的数量,用于反映广州各街镇经济实力,数据抓取时间为2017年7月 |
注:OpenStreetMap数据网址为 http://download.geofabrik.de/asia/china.html;QGIS软件Processing Toolbox中“Vector Analysis Tools”中的“Count points in polygon”模块计算各街镇汽车制造业企业数量及公司企业数量;用“Sum line lengths”模块计算各街镇路路长度。 |
表4 三种回归模型结果对比Tab.4 Comparison of three regression model results |
| 变量及统计指标 | 泊松回归 | 零膨胀泊松回归 | 负二项回归 |
|---|---|---|---|
| X11 | 0.002*** (0.001) | 0.003*** (0.001) | 0.001 (0.003) |
| X12 | -0.004*** (0.001) | -0.005*** (0.001) | -0.002* (0.001) |
| X21 | 0.002*** (0.0003) | 0.002*** (0.0003) | 0.002 (0.001) |
| X22 | -0.013 (0.014) | 0.035* (0.018) | -0.034 (0.030) |
| X31 | -0.205*** (0.065) | -0.151** (0.065) | -0.440** (0.187) |
| X41 | 0.084 (0.060) | 0.062 (0.059) | 0.375** (0.171) |
| X51 | 0.015*** (0.003) | 0.008** (0.003) | 0.032*** (0.011) |
| Constant | 1.549*** (0.179) | 1.470*** (0.186) | 1.369*** (0.510) |
| Observations | 166 | 166 | 166 |
| Log Likelihood | -583.166 | -528.482 | -364.735 |
| theta | - | - | 1.122*** (0.195) |
| Akaike Inf. Crit. | 1 182.332 | - | 745.471 |
注:*p<0.1;**p<0.05;***p<0.01,括号内数据为对应系数的标准误。 |
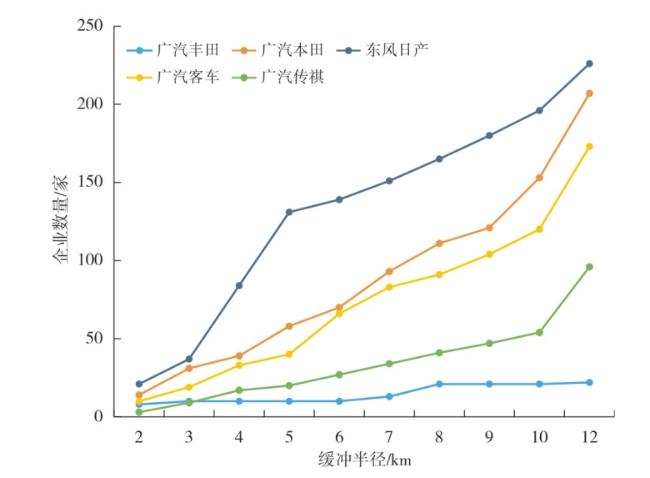
表5 广州整车企业的缓冲分析Tab.5 Buffer analysis of vehicle companies in Guangzhou |
| 缓冲半径 (km) | 汽车零部件 企业数量 | 外资企业 | 内资企业 | 缓冲区企业 数量占比(%) |
|---|---|---|---|---|
| 2 | 119 | 36 | 83 | 11.32 |
| 3 | 213 | 66 | 147 | 20.27 |
| 4 | 309 | 98 | 211 | 29.40 |
| 5 | 397 | 132 | 265 | 37.77 |
| 6 | 464 | 150 | 314 | 44.15 |
| 7 | 540 | 165 | 375 | 51.38 |
| 8 | 619 | 189 | 430 | 58.90 |
| 9 | 663 | 199 | 464 | 63.08 |
| 10 | 738 | 231 | 507 | 70.22 |
| 12 | 847 | 270 | 577 | 80.59 |
注:以整车企业为对象采用QGIS软件进行缓冲分析,计算不同缓冲区内汽车零部件企业数量及占比情况。 |
| [1] |
何婷婷. 我国汽车产业空间集聚的实证研究[J]. 汽车工业研究, 2008(3):28-33.
|
| [2] |
吴铮争, 吴殿廷, 袁俊, 等. 中国汽车产业地理集中及其影响因素研究[J]. 中国人口·资源与环境, 2008(1):116-121.
|
| [3] |
申明浩, 隋广军, 孙雷. 中国汽车产业集群发展的影响因素分析[J]. 科技管理研究, 2008(1):216-219.
|
| [4] |
王兆宇. 中国汽车制造业地理集中实证分析[J]. 西安建筑科技大学学报:社会科学版, 2009, 28(3):37-42.
|
| [5] |
白景锋, 周旗, 王海洋. 基于GIS的我国汽车产业空间布局与市场耦合分析[J]. 世界地理研究, 2011, 20(3):112-118.
|
| [6] |
赵浚竹, 孙铁山, 李国平, 等. 中国汽车制造业集聚与企业区位选择[J]. 地理学报, 2014(6):850-862.
|
| [7] |
虞虎, 陆林, 朱冬芳. 近10年中国汽车工业空间分布格局[J]. 安徽师范大学学报:自然科学版, 2012, 35(1):67-72.
|
| [8] |
丁娟, 李俊峰. 基于Web地理图片的中国入境游客POI空间格局[J]. 经济地理, 2015, 35(6):24-31.
|
| [9] |
吴芬芳, 熊卿. 大数据时代地理信息获取与服务方式的嬗变[J]. 测绘工程, 2015, 24(10):15-18.
|
| [10] |
焦汉科, 黄悦, 曹凯滨. 开源GIS研究及应用初探[J]. 测绘通报, 2016(S2):44-48.
|
| [11] |
张捷. 进化算法及智能数据挖掘若干问题研究[D]. 西安: 西安电子科技大学, 2013.
|
| [12] |
韩丽苹. 基于数据挖掘的我国区域矿产资源与能源开发利用现状分析研究[D]. 呼和浩特: 内蒙古科技大学, 2015.
|
| [13] |
林冬云. 基于空间聚类法的广州市海淀区朝阳区企业分布研究[D]. 北京: 北京师范大学, 2005.
|
| [14] |
夏云. 基于聚类方法的产业分布空间数据挖掘研究[D]. 南京: 东南大学, 2012.
|
| [15] |
|
| [16] |
杨帆, 徐建刚, 周亮. 基于DBSCAN空间聚类的广州市区餐饮集群识别及空间特征分析[J]. 经济地理, 2016, 36(10):110-116.
|
| [17] |
|
| [18] |
|
| [19] |
|
| [20] |
|
| [21] |
|
| [22] |
The hdbscan Clustering Library. Documentation of hdbscan Clustering Library 0.8.12[EB/OL]. http://hdbscan.readthedocs.io/en/latest, 2017-11-10.
|
| [23] |
胡良平. 过离散计数资料负二项分布模型回归分析[J]. 四川精神卫生, 2018, 31(5):399-404.
|
| [24] |
郭志刚, 巫锡炜. 泊松回归在生育率研究中的应用[J]. 中国人口科学, 2006(4):2-15,95.
|
| [25] |
张倩媛, 林晓, 朱惠红, 等. 基于零膨胀模型的江苏省AIDS 发病研究[J]. 数理医药学杂志, 2018, 31(6):791-793.
|
| [26] |
QGIS Project. QGIS User Guide[EB/OL]. https://docs.qgis.org/2.18/pdf/en/QGIS-2.18-UserGuide-en.pdf, 2017-10-23.
|
| [27] |
张永凯, 徐伟. 演化经济地理学视角下的产业空间演化及其影响因素分析[J]. 世界地理研究, 2014, 23(2):1-13.
|
| [28] |
巫细波. 新一轮汽车产业开放政策对我国汽车产业的影响及对策建议[J]. 对外经贸, 2018(8):57-60.
|
/
| 〈 |
|
〉 |