
中国“四纵四横”高铁对沿线站点城市可达性及其经济联系的影响
|
鄢慧丽(1980—),女,湖北襄阳人,博士,副教授,博士生导师。主要研究方向为旅游经济、区域经济等。E-mail:77430668@qq.com。 |
收稿日期: 2019-02-19
修回日期: 2019-11-03
网络出版日期: 2025-04-25
基金资助
国家自然科学基金项目(71461006)
国家自然科学基金项目(71461007)
国家自然科学基金项目(71761009)
海南省社会科学基金项目(HNSK〈YB〉19-06)
海南省社会科学基金项目(HNSK〈YB〉19-11)
海南省教育厅重点项目(hnky2019ZD-10)
华中师范大学中央高校基本科研业务费项目(CCNU19TS046)
The Effect of Chinese "Four Vertical and Four Horizontal" High-Speed Railways on the Accessibility and Economic Relations of the Cities along the Line
Received date: 2019-02-19
Revised date: 2019-11-03
Online published: 2025-04-25
鄢慧丽 , 王强 , 熊浩 , 余瑞林 . 中国“四纵四横”高铁对沿线站点城市可达性及其经济联系的影响[J]. 经济地理, 2020 , 40(1) : 57 -67 . DOI: 10.15957/j.cnki.jjdl.2020.01.007
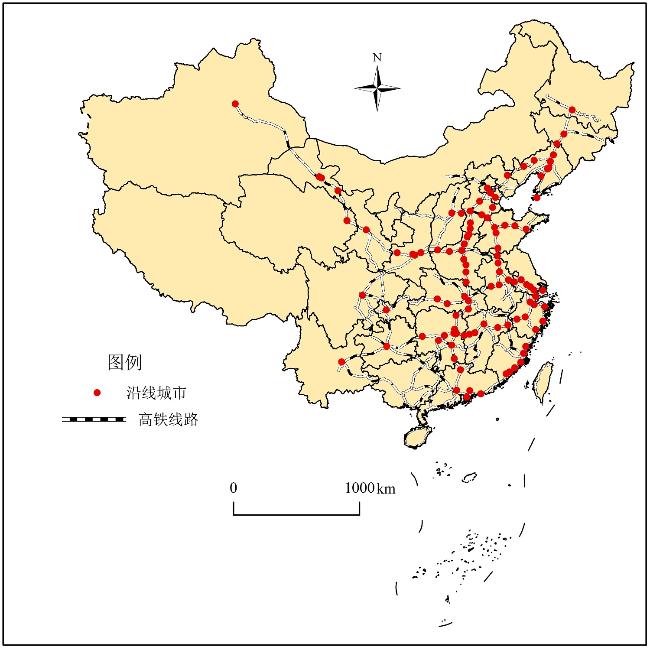
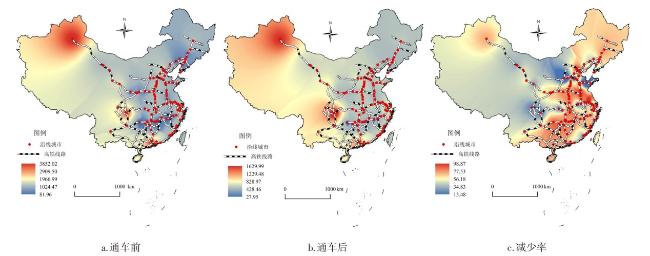
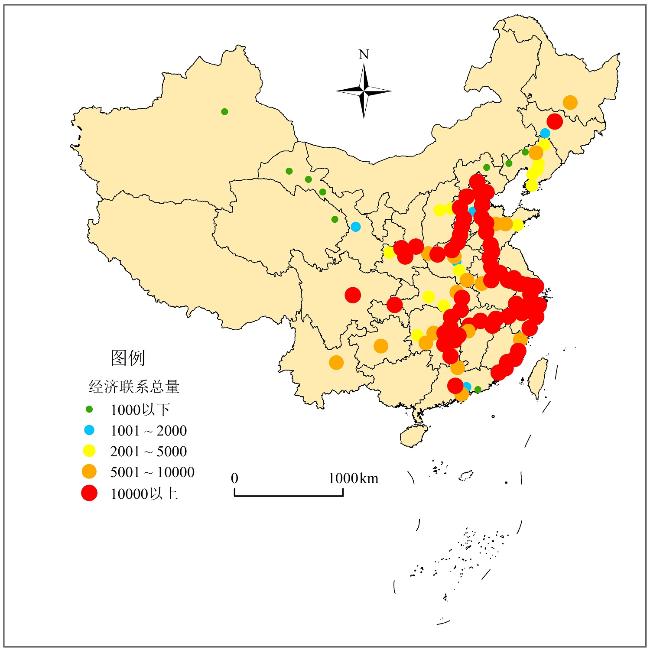
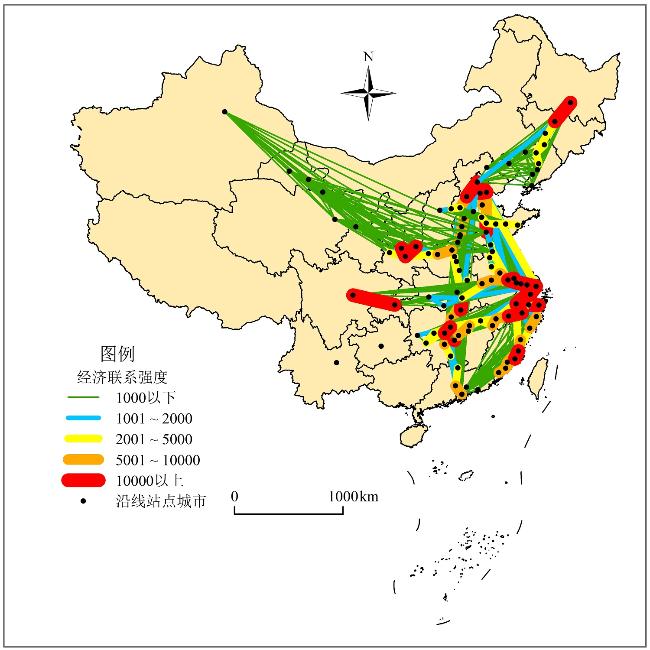
Under the background of the Belt and Road Initiative, high-speed railway takes an important role in speeding the regional development and globalization. In order to give a insight interpretation of the effect of high-speed railway on development of economic and give a reference for the planning and layout of high-speed railway, this paper focus on the research about the accessibility of cities and the spatial pattern of economic connection along the "four vertical and four horizontal" high-speed railway. The accessibility model and gravity model are proposed to analyze the accessibility of cities and the spatial pattern of economic connection, respectively. And the ArcGIS spatial analysis method is presented to compare these two indicators among different areas of China. Finally, three important conclusions are derived from the analysis. First, after the opening of "four vertical and four horizontal" high-speed rails, the overall regional accessibility get a great promotion, especially for the cities along the high-speed railways, which makes the passenger flow more balance. Furthermore, the accessibility of different areas are different. The accessibilities are increase from west to east. And the highest accessibility cities are located along the high-speed railway in North China and the middle and lower of Yangtze River. The lower accessibility cities are located along the high-speed railway in mountains and plateau of Midwest China. Second, the total quantity of economic connection of the cities along the "four vertical" high-speed railways in China are higher than those in the "four-horizontal" high-speed railway stations. And, the total quantity of economic connection of east is much higher than the quantity of the midlands and south of the cities along the high-speed railway. Third, the "four vertical and four horizontal" network of high-speed railway strengthens the economic connection of the second-and third-tier cities and forms a special pattern of the economic dependency of the adjacent cities and the central city.
表1 研究方法及意义解释Tab.1 The study model and meaning |
| 模型 | 模型说明 | 意义解释 | |
|---|---|---|---|
| 可达性测算 | 加权平均旅行时间[20]: | 式中:Tij表示i到j的平均旅行时间;Mj表示沿线站点城市j的权重,采用GDP(亿元)与人口(万人)几何平均值作为权重[20];n为沿线站点城市数量。 | 呈现物理意义上的可达性,直观表达某站点城市到达经济中心所需有效时间,Ai值越大,可达性程度低,反之则反。 |
| 交通流空间格局 | 赫希曼—赫芬达尔指数[17]: 集中化指数[17]: | 式中:ci为各站点城市每日交通流量占整个区域的比重,n含义同上。 | 运用HHI和CI,分析高铁网络对沿线站点城市交通流空间格局的影响。HHI和CI的数值介于0~1,趋于1时,表明高铁交通流趋于集中,而趋于0是,表示高铁交通流呈分散态势。 |
| 经济联系分析 | 经济联系强度[27]: 经济联系总量[27]: 经济联系隶属度[17]: | 式中:Qi和Qj为沿线站点城市i、j的国内旅游人数;Gi和Gj为沿线站点城市i、j的国内旅游收入;Dij为两城市之间最短旅行时间。 | 引力模型是测量沿线站点城市之间经济联系紧密与强弱的方法,本研究利用中国“四纵四横”高铁网络下各站点城市之间的最短旅行时间修正引力模型,测度沿线站点城市之间经济联系强度、联系总量及隶属度。 |
表2 中国“四纵四横”高铁沿线站点城市加权平均旅行时间Tab.2 Urban weighted average travel time for stations along the high-speed railway |
| 城市 | 加权平均旅行时间 | 城市 | 加权平均旅行时间 | 城市 | 加权平均旅行时间 | ||||||||
|---|---|---|---|---|---|---|---|---|---|---|---|---|---|
| 通车前 | 通车后 | 减少率(%) | 通车前 | 通车后 | 减少率(%) | 通车前 | 通车后 | 减少率(%) | |||||
| 四纵 | 京 沪 高 铁 | 北京 | 782.91 | 223.02 | 71.70 | 廊坊 | 582.94 | 166.92 | 71.37 | 泰安 | 330.01 | 106.11 | 67.85 |
| 德州 | 399.73 | 122.72 | 69.30 | 济南 | 422.25 | 126.43 | 70.06 | 蚌埠 | 182.62 | 59.51 | 67.41 | ||
| 徐州 | 323.14 | 100.01 | 69.05 | 宿州 | 241.16 | 73.04 | 69.71 | 常州 | 310.12 | 96.82 | 68.62 | ||
| 南京 | 578.72 | 184.62 | 68.10 | 镇江 | 157.31 | 58.23 | 99.08 | 枣庄 | 331.03 | 93.32 | 71.81 | ||
| 苏州 | 429.42 | 139.13 | 67.60 | 上海 | 3055.62 | 943.02 | 69.14 | 滁州 | 127.92 | 44.83 | 64.95 | ||
| 天津 | 621.73 | 193.33 | 68.90 | 沧州 | 460.34 | 139.13 | 69.78 | 无锡 | 371.73 | 123.01 | 66.91 | ||
| 平均值 | 539.37 | 166.29 | 69.17 | ||||||||||
| 京 广 高 铁 | 北京 | 1 016.12 | 394.14 | 61.21 | 保定 | 738.82 | 266.73 | 63.90 | 漯河 | 457.72 | 157.13 | 65.67 | |
| 邯郸 | 573.72 | 212.13 | 63.03 | 安阳 | 540.69 | 198.78 | 63.24 | 武汉 | 956.52 | 325.67 | 65.95 | ||
| 郑州 | 612.73 | 223.42 | 63.54 | 许昌 | 435.72 | 152.12 | 65.09 | 株洲 | 321.23 | 109.91 | 65.78 | ||
| 信阳 | 430.42 | 141.43 | 67.14 | 孝感 | 384.62 | 126.73 | 67.05 | 广州 | 3 883.31 | 1 359.62 | 65.00 | ||
| 岳阳 | 359.63 | 121.72 | 66.15 | 长沙 | 791.21 | 276.32 | 65.08 | 驻马店 | 423.41 | 141.24 | 66.64 | ||
| 郴州 | 237.91 | 82.23 | 65.44 | 韶关 | 263.92 | 91.33 | 65.39 | 咸宁 | 309.04 | 99.13 | 67.92 | ||
| 石家庄 | 658.32 | 245.33 | 62.73 | 邢台 | 594.43 | 220.42 | 62.92 | 衡阳 | 288.83 | 100.14 | 65.33 | ||
| 鹤壁 | 513.41 | 185.43 | 63.88 | 新乡 | 499.62 | 183.01 | 63.37 | 深圳 | 3 388.81 | 1 187.54 | 64.96 | ||
| 平均值 | 778.34 | 275.07 | 64.27 | ||||||||||
| 京 哈 高 铁 | 北京 | 757.52 | 214.51 | 71.68 | 承德 | 287.43 | 123.42 | 57.06 | 四平 | 205.12 | 72.41 | 64.70 | |
| 朝阳 | 177.42 | 83.27 | 53.07 | 阜新 | 165.72 | 79.43 | 52.07 | 鞍山 | 177.51 | 71.02 | 59.99 | ||
| 哈尔滨 | 465.72 | 175.12 | 62.40 | 长春 | 328.41 | 117.02 | 64.37 | 大连 | 753.32 | 291.04 | 61.37 | ||
| 沈阳 | 449.92 | 152.24 | 66.16 | 辽阳 | 107.02 | 46.32 | 56.72 | 铁岭 | 156.51 | 59.83 | 61.77 | ||
| 营口 | 128.72 | 52.84 | 58.95 | 平均值 | 320.03 | 118.34 | 63.02 | ||||||
| 杭 福 深 高 铁 | 杭州 | 896.32 | 381.91 | 57.39 | 绍兴 | 704.91 | 303.22 | 56.98 | 福州 | 536.32 | 206.91 | 61.42 | |
| 温州 | 570.13 | 219.14 | 61.56 | 宁德 | 400.83 | 145.13 | 63.79 | 漳州 | 185.62 | 102.31 | 44.88 | ||
| 泉州 | 363.13 | 147.24 | 59.45 | 厦门 | 592.13 | 240.01 | 59.47 | 莆田 | 506.83 | 191.12 | 62.29 | ||
| 惠州 | 538.14 | 227.91 | 57.65 | 深圳 | 3 771.01 | 1 572.23 | 58.31 | 汕尾 | 151.93 | 71.82 | 52.73 | ||
| 宁波 | 742.73 | 299.01 | 59.74 | 台州 | 598.71 | 241.82 | 59.61 | 平均值 | 754.20 | 310.70 | 58.80 | ||
| 四横 | 沪 昆 高 铁 | 上海 | 526.32 | 199.91 | 62.02 | 嘉兴 | 245.43 | 89.93 | 63.36 | 鹰潭 | 94.53 | 35.93 | 61.99 |
| 衢州 | 156.82 | 56.63 | 63.89 | 上饶 | 119.03 | 44.51 | 62.61 | 萍乡 | 105.41 | 37.43 | 64.49 | ||
| 新余 | 117.01 | 41.34 | 64.67 | 宜春 | 103.61 | 37.41 | 63.89 | 邵阳 | 125.43 | 37.03 | 70.48 | ||
| 湘潭 | 140.14 | 52.01 | 62.87 | 娄底 | 79.03 | 27.74 | 64.90 | 南昌 | 245.53 | 83.51 | 65.99 | ||
| 杭州 | 274.43 | 102.21 | 62.68 | 金华 | 174.33 | 62.34 | 64.24 | 长沙 | 575.12 | 204.41 | 64.46 | ||
| 怀化 | 87.23 | 27.91 | 68.00 | 昆明 | 101.23 | 46.35 | 54.21 | 贵阳 | 133.81 | 58.76 | 56.09 | ||
| 平均值 | 189.14 | 69.19 | 63.42 | ||||||||||
| 青 太 高 铁 | 青岛 | 395.61 | 275.32 | 30.41 | 潍坊 | 246.13 | 184.83 | 24.91 | 石家庄 | 295.42 | 228.63 | 22.61 | |
| 德州 | 104.41 | 86.73 | 16.93 | 衡水 | 84.74 | 74.51 | 12.07 | 阳泉 | 96.23 | 78.31 | 18.62 | ||
| 太原 | 508.53 | 438.64 | 13.74 | 淄博 | 242.64 | 184.12 | 24.12 | 济南 | 270.71 | 205.04 | 24.26 | ||
| 平均值 | 249.38 | 195.13 | 21.76 | ||||||||||
| 沪 汉 蓉 高 铁 | 上海 | 773.01 | 438.14 | 43.32 | 无锡 | 530.71 | 297.43 | 43.96 | 合肥 | 427.43 | 239.22 | 44.03 | |
| 南京 | 521.73 | 294.13 | 43.62 | 六安 | 355.61 | 206.14 | 42.03 | 宜昌 | 255.93 | 138.73 | 45.79 | ||
| 荆州 | 281.43 | 145.32 | 48.36 | 重庆 | 2968.53 | 1633.3 | 44.98 | 武汉 | 605.43 | 314.72 | 48.02 | ||
| 苏州 | 547.31 | 307.42 | 43.83 | 常州 | 509.61 | 283.84 | 44.30 | 成都 | 1220.41 | 657.73 | 46.11 | ||
| 平均值 | 749.76 | 413.01 | 44.91 | ||||||||||
| 徐 兰 新 高 铁 | 郑州 | 390.91 | 142.73 | 63.49 | 兰州 | 962.61 | 477.83 | 50.36 | 徐州 | 323.12 | 101.23 | 68.67 | |
| 洛阳 | 236.93 | 80.32 | 66.10 | 西宁 | 817.91 | 343.12 | 58.05 | 泰安 | 330.01 | 106.11 | 67.85 | ||
| 三门峡 | 141.13 | 51.72 | 63.35 | 张掖 | 547.72 | 238.14 | 56.52 | 乌鲁木齐 | 3 229.12 | 1 188.54 | 63.19 | ||
| 渭南 | 78.01 | 31.22 | 59.98 | 酒泉 | 460.62 | 207.65 | 54.92 | 咸阳 | 82.62 | 34.03 | 58.81 | ||
| 西安 | 650.51 | 229.13 | 64.78 | 嘉峪关 | 382.53 | 198.73 | 48.05 | 宝鸡 | 169.52 | 67.93 | 59.93 | ||
| 平均值 | 586.89 | 233.23 | 60.26 | ||||||||||
表3 中国“四纵四横”高铁可达性改善程度Tab.3 Improvement degree of accessibility in high-speed railways |
| 高铁名称 | Ai(min) | Ai 减少率/% | Pi | Pi 增加率/% | 可达性改 善程度 | |||
|---|---|---|---|---|---|---|---|---|
| 通车前 | 通车后 | 通车前 | 通车后 | |||||
| 四纵 | 京沪高铁 | 539.37 | 166.29 | 69.17 | 159.18 | 460.29 | 189.17 | 114.39 |
| 京哈高铁 | 320.03 | 118.34 | 63.02 | 57.11 | 139.14 | 143.65 | 95.15 | |
| 京广高铁 | 778.34 | 275.07 | 64.27 | 83.11 | 225.22 | 171.00 | 104.83 | |
| 杭福深高铁 | 754.20 | 310.70 | 58.80 | 48.65 | 118.61 | 143.83 | 91.96 | |
| 四横 | 沪昆高铁 | 198.09 | 71.27 | 64.02 | 62.07 | 162.61 | 161.98 | 101.98 |
| 沪汉蓉高铁 | 749.76 | 413.01 | 44.91 | 124.40 | 248.06 | 99.41 | 66.82 | |
| 青太高铁 | 249.38 | 195.13 | 21.76 | 38.10 | 60.55 | 58.91 | 35.80 | |
| 徐兰新高铁 | 586.89 | 233.23 | 60.26 | 36.88 | 75.26 | 104.08 | 79.20 | |
表4 中国“四纵四横”高铁沿线站点城市赫希曼—赫芬达尔指数和集中化指数Tab.4 China's Hesseman-Huffendale index and centralization index for high-speed railways |
| 高铁 | 常规铁路 | |||||
|---|---|---|---|---|---|---|
| HHI | CI | HHI | CI | |||
| 四纵 | 京沪高铁沿线站点城市 | 0.169 | 0.051 | 0.129 | 0.032 | |
| 京哈高铁沿线站点城市 | 0.142 | 0.045 | 0.157 | 0.064 | ||
| 京广高铁沿线站点城市 | 0.145 | 0.073 | 0.158 | 0.081 | ||
| 杭福深高铁沿线站点城市 | 0.207 | 0.071 | 0.283 | 0.099 | ||
| 四横 | 沪昆高铁沿线站点城市 | 0.103 | 0.022 | 0.119 | 0.052 | |
| 沪汉蓉高铁沿线站点城市 | 0.173 | 0.091 | 0.121 | 0.042 | ||
| 青太高铁沿线站点城市 | 0.205 | 0.046 | 0.214 | 0.102 | ||
| 徐兰新高铁沿线站点城市 | 0.274 | 0.096 | 0.201 | 0.054 | ||
| [1] |
|
| [2] |
文嫮, 韩旭. 高铁对中国城市可达性和区域经济空间格局的影响[J]. 人文地理, 2017, 32(1):99-108.
|
| [3] |
丁秋贤, 朱丽霞, 张辉, 等. 高速铁路对沿线站点城市可达性及经济联系的影响——以汉宜高速铁路为例[J]. 华中师范大学学报:自然科学版, 2015, 49(6):952-957.
|
| [4] |
钟业喜, 黄洁, 文玉钊. 高铁对中国城市可达性格局的影响分析[J]. 地理科学, 2015, 35(4):387-395.
|
| [5] |
王丽, 曹有挥, 仇方道. 高铁开通前后站区产业空间格局变动及驱动机制——以沪宁城际南京站为例[J]. 地理科学, 2017, 37(1):19-27.
|
| [6] |
于涛, 陈昭, 朱鹏宇. 高铁驱动中国城市郊区化的特征与机制研究——以京沪高铁为例[J]. 地理科学, 2012, 32(9):1041-1 046.
|
| [7] |
丁嵩, 李红. 国外高速铁路空间经济效应研究进展及启示[J]. 人文地理, 2014, 29(1):9-14.
|
| [8] |
|
| [9] |
|
| [10] |
|
| [11] |
|
| [12] |
王垚, 年猛. 高速铁路带动了区域经济发展吗?[J]. 上海经济研究, 2014(2):82-91.
|
| [13] |
方大春, 孙明月. 高速铁路对长三角城市群经济发展影响评估——基于DID模型的实证研究[J]. 华东经济管理, 2016, 30(2):42-47.
|
| [14] |
|
| [15] |
孟德友, 陆玉麒. 高速铁路对河南沿线站点城市可达性及经济联系的影响[J]. 地理科学, 2011, 31(5):537-543.
|
| [16] |
冯长春, 谢旦杏, 马学广, 等. 基于城际轨道交通流的珠三角城市区域功能多中心研究[J]. 地理科学, 2014, 34(6):648-655.
|
| [17] |
穆成林, 陆林, 黄剑锋, 等. 高铁网络下的长三角旅游交通格局及联系研究[J]. 经济地理, 2015, 35(12):193-202.
|
| [18] |
王姣娥, 丁金学. 高速铁路对中国城市空间结构的影响研究[J]. 国际城市规划, 2011, 26(6):49-54.
|
| [19] |
邹卓君, 郑伯红. 高铁站区与城郊产业园区协同发展研究——以京沪、京广高铁沿线站点城市为例[J]. 经济地理, 2017, 37(3):136-143.
|
| [20] |
姜博, 初楠臣, 修春亮, 等. 高速铁路对欠发达地区可达性影响的空间差异——以哈大与郑西高铁为例[J]. 人文地理, 2017, 32(2):88-94.
|
| [21] |
侯雪, 刘苏, 张文新, 等. 高铁影响下的京津城际出行行为研究[J]. 经济地理, 2011, 31(9):1573-1 579.
|
| [22] |
|
| [23] |
|
| [24] |
许春晓, 姜漫. 城市居民出游的高铁选乘行为意向的形成机理——以长沙市为例[J]. 人文地理, 2014, 29(1):122-128.
|
| [25] |
|
| [26] |
倪维秋, 廖茂林. 高速铁路对中国省会城市经济联系的空间影响[J]. 中国人口·资源与环境, 2018, 28(3):160-168.
|
| [27] |
郭建科, 王绍博, 李博, 等. 哈大高铁对东北城市经济联系的空间影响[J]. 地理科学, 2016, 36(4):521-529.
|
| [28] |
林上, 冯雷. 日本高速铁路建设及其社会经济影响[J]. 城市与区域规划研究, 2011, 9(3):132-156.
|
| [29] |
|
| [30] |
汪德根. 旅游地国内客源市场空间结构的高铁效应[J]. 地理科学, 2013, 33(7):797-805.
|
| [31] |
|
| [32] |
|
| [33] |
王欣, 邹统钎. 高速铁路网对我国区域旅游产业发展与布局的影响[J]. 经济地理, 2010, 30(7):1189-1 194.
|
| [34] |
|
| [35] |
汪德根, 陈田, 陆林, 等. 区域旅游流空间结构的高铁效应及机理——以中国京沪高铁为例[J]. 地理学报, 2015, 70(2):214-233.
|
| [36] |
汪德根. 京沪高铁对主要站点旅游流时空分布影响[J]. 旅游学刊, 2014, 29(1):75-82.
|
| [37] |
|
| [38] |
汪德根. 武广高铁对沿线都市圈可达性影响及旅游空间优化[J]. 城市发展研究, 2014, 21(9):110-117.
|
| [39] |
李保超, 王朝辉, 李龙, 等. 高速铁路对区域内部旅游可达性影响——以皖南国际文化旅游示范区为例[J]. 经济地理, 2016, 36(9):182-191.
|
| [40] |
丁金学, 金凤君, 王姣娥, 等. 高铁与民航的竞争博弈及其空间效应——以京沪高铁为例[J]. 经济地理, 2013, 33(5):104-110.
|
| [41] |
王姣娥, 胡浩. 中国高铁与民航的空间服务市场竞合分析与模拟[J]. 地理学报, 2013, 68(2):175-185.
|
| [42] |
|
| [43] |
焦敬娟, 王姣娥, 金凤君, 等. 高速铁路对城市网络结构的影响研究——基于铁路客运班列分析[J]. 地理学报, 2016, 71(2):265-280.
|
/
| 〈 |
|
〉 |