
2010—2016年中国多维贫困动态分析——基于中国家庭跟踪调查(CFPS)数据的实证研究
|
李东(1986—),男,河南濮阳人,博士研究生。主要研究方向为反贫困领域。E-mail:lidong@pku.edu.cn。 |
收稿日期: 2019-10-21
修回日期: 2020-01-07
网络出版日期: 2025-04-25
基金资助
国家社会科学基金重大项目(19ZDA001)
国家社会科学基金重大委托项目(2018XZD08)
Dynamic Analysis of Multidimensional Poverty in China from 2010 to 2016:Based on Chinese Family Panel Studies(CFPS)
Received date: 2019-10-21
Revised date: 2020-01-07
Online published: 2025-04-25
随着中国反贫困实践的深入推进,收入维度下中国农村贫困状况得到大幅改善。但是一方面通过收入贫困线测度的贫困发生率不能完全反映出中国反贫困政策的实施效果,另一方面导致地方政府过度追求脱贫数量,而忽视脱贫质量。从多维的角度对中国的贫困状况进行测度,有助于有效克服以上两个问题。文章沿用全球多维贫困指数的分析框架,基于CFPS的历年抽样调查数据,对中国总体多维贫困状况的动态变化进行了研究,发现中国的多维贫困指数和多维贫困发生率均呈现逐年下降的趋势,但是贫困强度的变化却不明显;整体上贫困人口的生活水平在逐步提高,但是适龄儿童辍学率却出现了大幅上升;另外,安全饮用水和炊用燃料对于总体贫困的贡献也较高。
李东 , 孙东琪 . 2010—2016年中国多维贫困动态分析——基于中国家庭跟踪调查(CFPS)数据的实证研究[J]. 经济地理, 2020 , 40(1) : 41 -49 . DOI: 10.15957/j.cnki.jjdl.2020.01.005
With the deepening of anti-poverty practice in China, rural poverty has been greatly improved under the income dimension. However, the poverty incidence rate measured by income poverty line cannot fully reflect the implementation effect of China's anti-poverty policies, and it leads the local governments to excessively pursue the number of poverty alleviation while neglecting the quality. Fortunately, measuring the poverty situation in China from the multidimensional perspective can effectively overcome the above two problems. Using the analytical framework of the global multidimensional poverty index and based on the annual sample survey data of CFPS, this paper studies the dynamic changes of the overall multidimensional poverty situation in China, and finds that both the multidimensional poverty index and the incidence of multidimensional poverty in China are decreasing year by year, but the change of poverty intensity is not obvious. Overall, the living standards of the poor are improving, but the dropout rate of school-age children has risen sharply. Safe drinking water and cooking fuel also contributed significantly.
表1 中国多维贫困指数的维度、指标、贫困线和权重Tab.1 Dimension, index, poverty line and weight of China's MPI |
| 维度 | 指标 | 贫困标准 | 权重 |
|---|---|---|---|
| 教 育 | 上学年限 | 家庭成员中无人完成五年的学业,也没有成员完成小学学业 | 1/6 |
| 儿童入学率 | 任何一个7~15岁的孩子在理应完成8年级学业的年龄还没有上学 | 1/6 | |
| 健 康 | 儿童死亡情况 | 家中有儿童死亡 | 1/6 |
| 营养状况 | 任何一个70岁以下的家庭成员出现营养不良 | 1/6 | |
| 生 活 标 准 | 用电情况 | 家庭尚未通电 | 1/15 |
| 卫生设施 | 家庭没有私人厕所,无论是室内还是室外,水厕或是旱厕 | 1/15 | |
| 改善饮用水 | 家庭无法获得改善的饮用水,这里定义为井水/泉水、自来水或矿物水/纯净水/过滤水 | 1/15 | |
| 生活燃料 | 使用粪、木头或木炭做饭 | 1/15 | |
| 财产状况 | 家庭不拥有以下财产中的一项以上:电视、移动电话、自行车(机动)、摩托车或冰箱,也不拥有汽车或类似车辆* | 1/15 |
注:*CFPS中没有统计家庭拥有自行车、电动车和冰箱的信息,因此在后续计算中不包含此三项信息;同时本文将类似车辆定为拖拉机。 |
表2 中国多维贫困指数变动情况:2010—2016年Tab.2 Changes in China's multidimensional poverty index:2010-2016 |
| 年份 | 变量 | M0 | 置信区间(95%) | H(%) | 置信区间(95%) | A(%) | 置信区间(95%) |
|---|---|---|---|---|---|---|---|
| 2010 | MPI | 0.035 | [0.027,0.042] | 8.2 | [6.7,9.7] | 42.4 | [41.3,43.5] |
| MPI* | 0.036 | [0.034,0.039] | 8.5 | [8.0,9.0] | 42.5 | [39.9,45.2] | |
| Severity | 0.007 | [0.004,0.011] | 1.3 | [0.8,1.9] | 57.2 | [56.0,58.4] | |
| Severity* | 0.009 | [0.007,0.010] | 1.6 | [1.3,1.8] | 57 | [48.4,65.6] | |
| 2012 | MPI | 0.023 | [0.016,0.030] | 5.4 | [4.1,6.8] | 43 | [40.2,45.8] |
| MPI* | 0.029 | [0.027,0.031] | 6.9 | [6.3,7.4] | 42.7 | [39.3,46.1] | |
| Severity | 0.006 | [0.001,0.011] | 1 | [0.1,1.8] | 58.8 | [47.3,70.4] | |
| Severity* | 0.007 | [0.006,0.009] | 1.2 | [1.0,1.4] | 58.9 | [45.5,70.1] | |
| 2014 | MPI | 0.017 | [0.013,0.020] | 4 | [3.2,4.9] | 41.3 | [40.1,42.5] |
| MPI* | 0.015 | [0.013,0.016] | 3.6 | [3.2,4.0] | 41.0 | [36.3,45.8] | |
| Severity | 0.0017 | [0.544,0.594] | 0.3 | [0.1,0.5] | 56.9 | [54.4,59.4] | |
| Severity* | 0.0014 | [0.0009,0.002] | 0.3 | [0.15,0.36] | 58.2 | [33.9,82.5] | |
| 2016 | MPI* | 0.014 | [0.012,0.015] | 3.3 | [2.9,3.8] | 40.7 | [35.5,45.9] |
| Severity* | 0.0015 | [0.0008,0.002] | 0.2 | [0.13,0.36] | 58.5 | [30.5,86.5] |
注:标*的数据为本文根据CFPS的数据重新计算所得。 |
表3 MPI、H和A的年度变化统计分析表Tab.3 Statistical analysis of annual changes in MPI, H and A |
| 统计量 | 2010—2012年 | 2012—2014年 | 2014—2016年 | |||||
|---|---|---|---|---|---|---|---|---|
| 绝对值 | t值 | 绝对值 | t值 | 绝对值 | t值 | |||
| H(%) | 1.700 | 4.385* | 3.300 | 9.659* | 0.300 | 0.811 | ||
| A | 0.200 | -0.087 | 1.700 | 0.557 | 0.400 | 0.101 | ||
| MPI | 0.007 | 4.172* | 0.015 | 9.934* | 0.001 | 0.895 | ||
注:“*”表示在 =0.001的水平上显著。 |
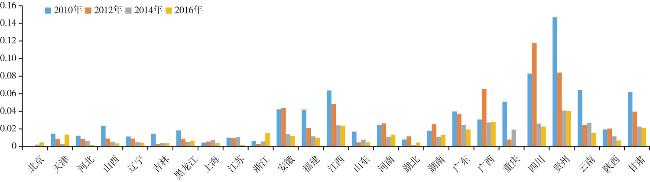
图1 中国多维贫困发生率(H)分省统计(2010—2016)Fig.1 The incidence of multidimensional poverty in China (H) by province (2010-2016) |
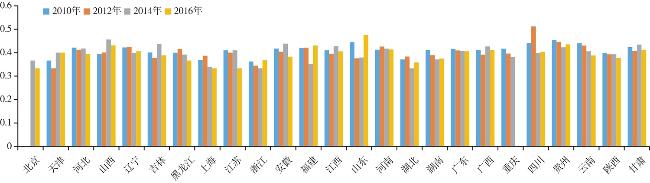
图2 中国多维贫困强度(A)分省统计图(2010—2016)Fig.2 The intensity of multidimensional poverty in China (A) by province (2010-2016) |
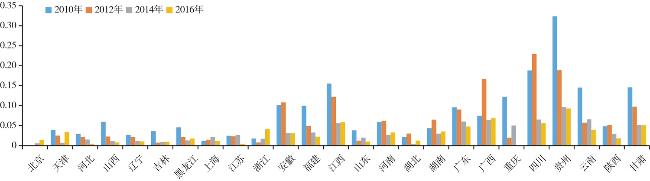
图3 中国多维贫困指数分省统计图(2010—2016)Fig.3 China's multidimensional poverty index by province (2010-2016) |
表4 多维贫困指数按地域进行分解Tab.4 Decomposition of China's multidimensional poverty index by region |
| 地区 | 年份 | 人口占比(%) | MPI | H(%) | A(%) |
|---|---|---|---|---|---|
| 东部 | 2010 | 41.17 | 0.019 | 4.58 | 41.58 |
| 2012 | 40.48 | 0.015 | 3.78 | 40.79 | |
| 2014 | 41.20 | 0.011 | 2.84 | 39.38 | |
| 2016 | 37.84 | 0.008 | 2.08 | 40.01 | |
| 中部 | 2010 | 29.16 | 0.025 | 6.23 | 40.81 |
| 2012 | 29.93 | 0.023 | 5.63 | 41.03 | |
| 2014 | 30.60 | 0.010 | 2.39 | 41.65 | |
| 2016 | 29.97 | 0.011 | 2.81 | 40.22 | |
| 西部 | 2010 | 29.67 | 0.071 | 16.29 | 43.52 |
| 2012 | 29.59 | 0.055 | 12.36 | 44.27 | |
| 2014 | 28.20 | 0.025 | 5.96 | 41.91 | |
| 2016 | 32.20 | 0.022 | 5.31 | 41.20 |
表5 多维贫困指数按城乡进行分解Tab.5 Decomposition of China's multidimensional poverty index according to urban and rural areas |
| 地区 | 年份 | 人口比例(%) | MPI | H(%) | A(%) |
|---|---|---|---|---|---|
| 城 | 2010 | 43.1 | 0.014 | 3.49 | 40.61 |
| 2012 | 42.0 | 0.011 | 2.73 | 39.28 | |
| 2014 | 45.6 | 0.008 | 2.02 | 38.33 | |
| 2016 | 43.5 | 0.006 | 1.75 | 36.66 | |
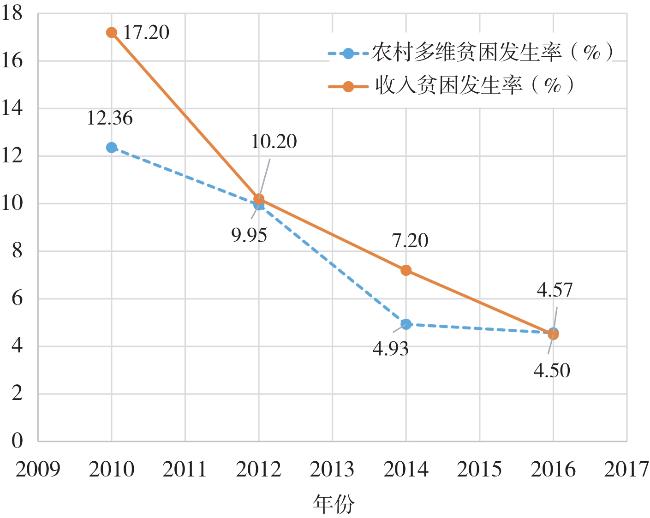
| 乡 | 2010 | 56.9 | 0.053 | 12.36 | 42.92 |
| 2012 | 58.0 | 0.043 | 9.95 | 43.40 | |
| 2014 | 54.4 | 0.021 | 4.93 | 41.97 | |
| 2016 | 56.5 | 0.019 | 4.57 | 41.88 |
表6 多维贫困指数按维度和指标进行分解Tab.6 Decomposition of China's multidimensional poverty index by dimensions and indicators |
| 项目 | 2010 | 2012 | 2014 | 2016 | |
|---|---|---|---|---|---|
| 维度贡献 | 健康(%) | 30.82 | 34.84 | 52.30 | 49.98 |
| 教育(%) | 26.57 | 24.10 | 22.55 | 25.28 | |
| 生活水平(%) | 42.61 | 41.05 | 25.14 | 24.74 | |
| 指标贡献 | 营养(%) | 24.21 | 27.46 | 34.67 | 33.75 |
| 儿童死亡(%) | 6.61 | 7.39 | 17.63 | 16.22 | |
| 上学年限(%) | 19.52 | 13.49 | 7.60 | 5.18 | |
| 适龄儿童入学率(%) | 7.05 | 10.62 | 14.96 | 20.10 | |
| 电(%) | 0.34 | 0.24 | 0.11 | 0.01 | |
| 安全饮水(%) | 12.23 | 12.03 | 7.18 | 7.86 | |
| 卫生设施(%) | 7.52 | 11.61 | 4.10 | 3.52 | |
| 炊用燃料(%) | 14.57 | 13.65 | 11.69 | 10.55 | |
| 家庭财产(%) | 7.95 | 3.53 | 2.06 | 2.80 | |
| [1] |
|
| [2] |
|
| [3] |
王小林,
|
| [4] |
李佳路. 农户多维度贫困测量——以S省30个国家扶贫开发工作重点县为例[J]. 财贸经济, 2010(10):63-68.
|
| [5] |
|
| [6] |
陈辉, 张全红. 基于多维贫困测度的贫困精准识别及精准扶贫对策——以粤北山区为例[J]. 广东财经大学学报, 2016(3):64-71.
|
| [7] |
|
| [8] |
|
| [9] |
杨慧敏, 罗庆, 许家伟. 中国农村贫困的动态发展及影响因素分析——基于CHNS数据[J]. 经济经纬, 2016(5):42-47.
|
| [10] |
蒋翠侠, 许启发, 李亚琴. 中国家庭多维贫困的统计测度[J]. 统计与决策, 2011(22):94-97.
|
| [11] |
|
| [12] |
郭建宇, 吴国宝. 基于不同指标及权重选择的多维贫困测量——以山西省贫困县为例[J]. 中国农村经济, 2012(2):12-20.
|
| [13] |
|
| [14] |
|
| [15] |
中华人民共和国国家统计局. 中华人民共和国2016年国民经济和社会发展统计公报[N]. 经济日报,2017-03-01(005).
|
/
| 〈 |
|
〉 |