
连片特困区旅游扶贫效率评价及影响因素——来自罗霄山片区的经验证据
|
陈超凡(1989—),男,福建福州人,博士,讲师。主要研究方向为发展经济与产业经济。E-mail:chaofanc@bnu.edu.cn。 |
收稿日期: 2019-04-19
修回日期: 2019-09-12
网络出版日期: 2025-04-25
基金资助
农业农村部发展规划司项目(125E0201)
Tourism-Oriented Poverty Alleviation Efficiency and Its Determinants of Chinese Contiguous Destitute Area-Empirical Evidence from Luoxiao Mountain Area
Received date: 2019-04-19
Revised date: 2019-09-12
Online published: 2025-04-25
以罗霄山片区为研究对象,运用DEA模型及Malmquist指数对2010—2014年罗霄山片区20个县(市、区)的旅游扶贫效率进行测度,并通过GMM动态面板模型实证检验了旅游扶贫效率的影响因素。研究表明:罗霄山片区旅游扶贫综合效率整体处于较低水平,但随着国家和地方政府对旅游产业的支持力度不断增强,多数贫困县(市、区)的旅游扶贫效率都呈现改善态势,说明旅游扶贫仍具较大潜力。从影响因素来看,财政支持、基础设施建设、产业化扶贫对改善罗霄山片区旅游扶贫效率有积极影响,而教育培训水平较低和金融支持能力不足制约了该片区旅游扶贫效率的提升。
陈超凡 , 王赟 . 连片特困区旅游扶贫效率评价及影响因素——来自罗霄山片区的经验证据[J]. 经济地理, 2020 , 40(1) : 226 -233 . DOI: 10.15957/j.cnki.jjdl.2020.01.025
Contiguous destitute areas are main battlefields of poverty alleviation of China in the new period. The paper takes Luoxiao Mountain Area as the research object, and applies DEA model and Malmquist index to measure the tourism-oriented poverty alleviation efficiency (TPAE) of 20 counties in Luoxiao Mountain Area from 2010-2014. On this basis, the determinants of TPAE are empirically tested by dynamic panel data model. The research shows that, the overall level of TPAE in Luoxiao Mountain Area is relatively low. As the policy support of national and local government to tourism industry increase gradually, TPAE in many poor counties presents improving situation, which shows that tourism-oriented poverty alleviation still has great potential. Seen from the determinants of TPAE, fiscal support, infrastructure construction and industrialization poverty alleviation have positive effect on TPAE, while relatively low education level and insufficient financial support restrain the improvement of TPAE in this area.
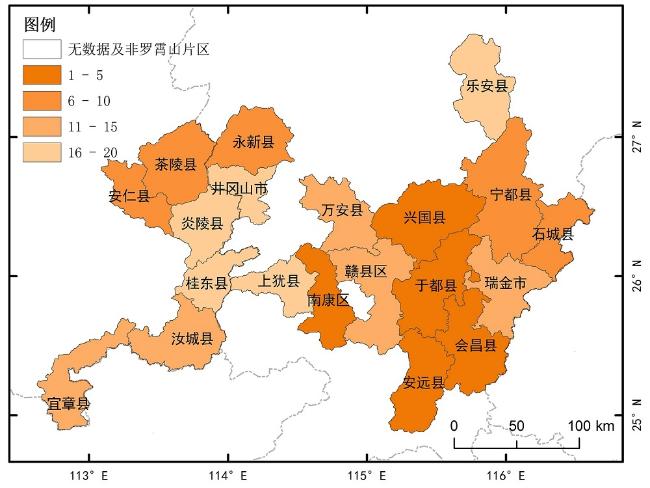
表1 2010—2014年罗霄山片区各县旅游扶贫效率Tab.1 Tourism-oriented poverty alleviation efficiency of 20 countries in 2010-2014 |
| 县(市、区) | 2010 | 2011 | 2012 | 2013 | 2014 | 综合效率均值 | 纯技术效率均值 | 规模效率均值 |
|---|---|---|---|---|---|---|---|---|
| 赣县区 | 0.155 | 0.145 | 0.221 | 0.297 | 0.198 | 0.203 | 1.000 | 0.203 |
| 上犹县 | 0.093 | 0.285 | 0.298 | 0.285 | 0.243 | 0.241 | 0.262 | 0.912 |
| 安远县 | 0.570 | 0.577 | 0.179 | 0.224 | 0.275 | 0.365 | 0.461 | 0.818 |
| 宁都县 | 0.273 | 0.258 | 0.329 | 0.336 | 0.414 | 0.322 | 0.346 | 0.928 |
| 于都县 | 0.422 | 0.414 | 0.425 | 0.610 | 0.901 | 0.554 | 0.557 | 0.995 |
| 兴国县 | 0.409 | 0.359 | 0.383 | 0.392 | 0.386 | 0.386 | 0.406 | 0.952 |
| 会昌县 | 0.982 | 1.000 | 1.000 | 1.000 | 1.000 | 0.996 | 1.000 | 0.996 |
| 石城县 | 0.217 | 0.131 | 0.120 | 0.140 | 0.141 | 0.150 | 0.198 | 0.765 |
| 瑞金市 | 0.123 | 0.108 | 0.109 | 0.117 | 0.122 | 0.116 | 0.119 | 0.971 |
| 南康区 | 1.000 | 1.000 | 1.000 | 1.000 | 1.000 | 1.000 | 1.000 | 1.000 |
| 万安县 | 0.182 | 0.193 | 0.255 | 0.283 | 0.365 | 0.256 | 0.343 | 0.780 |
| 永新县 | 0.403 | 0.400 | 0.328 | 0.227 | 0.608 | 0.393 | 0.543 | 0.808 |
| 井冈山市 | 0.020 | 0.017 | 0.020 | 0.024 | 0.028 | 0.022 | 1.000 | 0.022 |
| 乐安县 | 0.047 | 0.197 | 0.234 | 0.181 | 0.186 | 0.169 | 0.189 | 0.870 |
| 茶陵县 | 0.393 | 0.340 | 0.218 | 0.393 | 0.430 | 0.355 | 1.000 | 0.355 |
| 炎陵县 | 0.055 | 0.054 | 0.063 | 0.067 | 0.076 | 0.063 | 0.540 | 0.168 |
| 宜章县 | 0.118 | 0.107 | 0.102 | 0.121 | 0.114 | 0.112 | 0.857 | 0.133 |
| 汝城县 | 0.127 | 0.076 | 0.069 | 0.073 | 0.074 | 0.084 | 0.091 | 0.928 |
| 桂东县 | 0.117 | 0.116 | 0.111 | 0.126 | 0.104 | 0.115 | 0.134 | 0.862 |
| 安仁县 | 0.291 | 0.301 | 0.369 | 0.298 | 0.213 | 0.294 | 0.325 | 0.925 |
| 平均值 | 0.300 | 0.304 | 0.292 | 0.310 | 0.344 | 0.310 | 0.518 | 0.720 |
注:限于篇幅,本表未列出各年份纯技术效率、规模效率的数值,仅列出各年份均值。 |
图1 2010年旅游扶贫综合效率排名分布Fig.1 Ranks distribution of comprehensive efficiency of tourism-oriented poverty alleviation in 2010 |
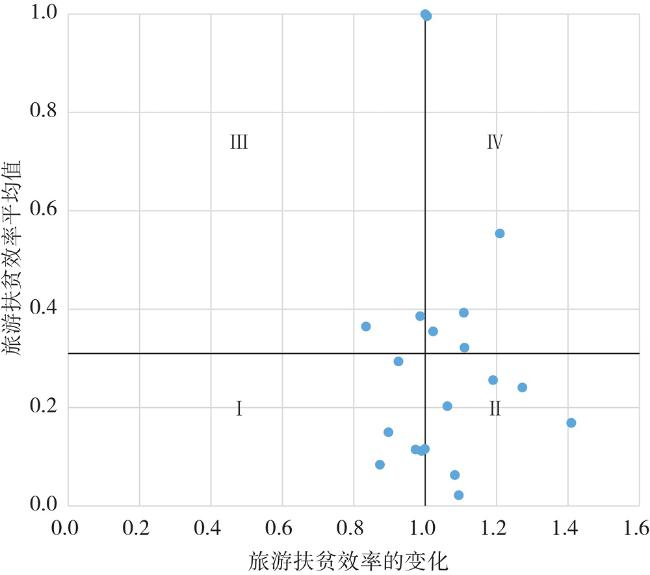
表2 罗霄山片区旅游扶贫效率的变化情况Tab.2 Change of tourism-oriented poverty alleviation efficiency in Luoxiao Mountain Area |
| 年份 | effch | pech | sech | techch | MI |
|---|---|---|---|---|---|
| 2010—2011 | 1.043 | 1.114 | 0.936 | 0.931 | 0.971 |
| 2011—2012 | 0.984 | 0.893 | 1.102 | 0.831 | 0.818 |
| 2012—2013 | 1.082 | 0.929 | 1.164 | 0.909 | 0.983 |
| 2013—2014 | 1.069 | 1.175 | 0.910 | 0.862 | 0.922 |
| 平均变化 | 1.045 | 1.028 | 1.028 | 0.883 | 0.924 |
表3 罗霄山片区各县旅游扶贫效率的变化情况Tab.3 Change of tourism-oriented poverty alleviation efficiency in different counties |
| 县(市、区) | effch | pech | sech | techch | MI |
|---|---|---|---|---|---|
| 赣县区 | 1.062 | 1.000 | 1.062 | 0.886 | 0.941 |
| 上犹县 | 1.272 | 1.236 | 1.029 | 0.872 | 1.109 |
| 安远县 | 0.834 | 0.794 | 1.050 | 0.887 | 0.740 |
| 宁都县 | 1.110 | 1.106 | 1.003 | 0.869 | 0.964 |
| 于都县 | 1.209 | 1.207 | 1.001 | 0.897 | 1.084 |
| 兴国县 | 0.986 | 0.969 | 1.018 | 0.883 | 0.870 |
| 会昌县 | 1.005 | 1.000 | 1.005 | 0.898 | 0.902 |
| 石城县 | 0.897 | 0.861 | 1.043 | 0.885 | 0.794 |
| 瑞金市 | 0.999 | 0.983 | 1.016 | 0.887 | 0.886 |
| 南康区 | 1.000 | 1.000 | 1.000 | 0.869 | 0.869 |
| 万安县 | 1.190 | 1.149 | 1.036 | 0.872 | 1.038 |
| 永新县 | 1.108 | 1.089 | 1.017 | 0.876 | 0.971 |
| 井冈山市 | 1.094 | 1.000 | 1.094 | 0.867 | 0.948 |
| 乐安县 | 1.409 | 1.317 | 1.069 | 0.901 | 1.270 |
| 茶陵县 | 1.022 | 1.000 | 1.022 | 0.865 | 0.884 |
| 炎陵县 | 1.083 | 1.066 | 1.016 | 0.867 | 0.939 |
| 宜章县 | 0.990 | 1.074 | 0.922 | 0.872 | 0.864 |
| 汝城县 | 0.873 | 0.862 | 1.014 | 0.900 | 0.786 |
| 桂东县 | 0.973 | 0.935 | 1.041 | 0.905 | 0.881 |
| 安仁县 | 0.925 | 0.928 | 0.997 | 0.893 | 0.827 |
表4 基于DIF-GMM动态面板模型的旅游扶贫效率影响因素回归结果Tab.4 Result of determinants of tourism-oriented poverty alleviation efficiency(DIF-GMM) |
| 变量 | effit | peit | seit | |||||
|---|---|---|---|---|---|---|---|---|
| (1) | (2) | (3) | (4) | (5) | (6) | |||
| effi,t-1 | 0.3243*(1.69) | -0.1273(-0.61) | ||||||
| pei,t-1 | 0.0002(1.00) | -0.0012(-0.02) | ||||||
| sei,t-1 | 0.5400***(4.21) | 0.5463(1.01) | ||||||
| ln(fs)it | 0.0573**(2.17) | 0.1619**(1.97) | 0.0452**(2.12) | 0.0659*(1.71) | 0.0169(0.46) | 0.0362*(1.61) | ||
| ln(ic)it | 0.0030(0.32) | 0.1312**(2.00) | 0.0099(0.87) | 0.0092**(2.78) | 0.0126***(3.02) | 0.0134**(1.88) | ||
| ln(ed)it | -0.0393(-1.39) | -0.0245**(-2.44) | -0.0024(-0.35) | |||||
| ln(mb)it | 0.0428*(1.87) | 0.0145(0.70) | 0.0141(0.17) | |||||
| ln(is)it | 0.0135(0.52) | -0.0254*(-1.64) | -0.0213*(-1.68) | |||||
| Sargan test | 0.381 | 0.385 | 0.431 | 0.498 | 0.335 | 0.467 | ||
| AR(2) | 0.245 | 0.433 | 0.540 | 0.667 | 0.861 | 0.553 | ||
| Wald-test-p | 0.000 | 0.000 | 0.000 | 0.000 | 0.001 | 0.000 | ||
注:***、**、*分别表示在1%、5%、10%水平下统计显著。Sargan检验是用来判别矩条件是否存在过度识别的问题,以确定工具变量是否有效;AR(2)为残差二阶序列相关检验;Wald为系数联合显著性检验。表5同。 |
表5 基于SYS-GMM动态面板模型的旅游扶贫效率影响因素回归结果Tab.5 Result of determinants of tourism-oriented poverty alleviation efficiency(SYS-GMM) |
| 变量 | effit | peit | seit | |||||
|---|---|---|---|---|---|---|---|---|
| (1) | (2) | (3) | (4) | (5) | (6) | |||
| effi,t-1 | -0.1432(-1.28) | -0.0405(-0.49) | ||||||
| pei,t-1 | 0.3192(3.53) | 0.3184**(3.24) | ||||||
| sei,t-1 | 0.0762(0.83) | 0.1879**(2.02) | ||||||
| ln(fs)it | 0.1334***(3.38) | 0.0994**(2.23) | 0.2124***(3.38) | 0.2052**(2.07) | 0.1240***(2.42) | 0.0540*(1.71) | ||
| ln(ic)it | 0.0908**(1.96) | 0.0887***(2.85) | 0.1789***(2.75) | 0.1817**(1.98) | 0.0496(1.16) | 0.0486**(2.16) | ||
| ln(ed)it | -0.0255***(-3.11) | -0.0268(-1.45) | 0.0192(0.72) | |||||
| ln(mb)it | 0.0328(1.19) | 0.0234(0.66) | 0.0349(1.28) | |||||
| ln(is)it | 0.0206**(2.22) | 0.0083(0.23) | 0.0434*(1.81) | |||||
| Sargan test | 0.876 | 0.776 | 0.739 | 0.765 | 0.594 | 0.522 | ||
| AR(2) | 0.796 | 0.762 | 0.648 | 0.671 | 0.583 | 0.631 | ||
| Wald-test-p | 0.000 | 0.001 | 0.000 | 0.000 | 0.000 | 0.000 | ||
| [1] |
|
| [2] |
|
| [3] |
|
| [4] |
|
| [5] |
|
| [6] |
冯灿飞. 贫困型旅游地文化变迁的动因及规范研究[J]. 特区经济, 2006(5):200-201.
|
| [7] |
赵建军. 旅游对目的地居民文化影响评价体系及其实证研究[D]. 长沙: 湖南大学, 2007.
|
| [8] |
李佳, 钟林生, 成升魁. 中国旅游扶贫研究进展[J]. 中国人口·资源与环境, 2009, 19(3):156-162.
|
| [9] |
|
| [10] |
隆学文, 马礼. 坝上旅游扶贫效应分析与对策研究——以丰宁县大滩为例[J]. 首都师范大学学报:自然科学版, 2004, 25(1):74-80.
|
| [11] |
|
| [12] |
|
| [13] |
曹妍雪, 马蓝. 基于三阶段DEA的我国民族地区旅游扶贫效率评价[J]. 华东经济管理, 2017, 31(9):91-97.
|
| [14] |
黄渊基. 连片特困地区旅游扶贫效率评价及时空分异——以武陵山湖南片区20个县(市、区)为例[J]. 经济地理, 2017, 37(11):229-235.
|
| [15] |
孙春雷, 张明善. 精准扶贫背景下旅游扶贫效率研究——以湖北大别山区为例[J]. 中国软科学, 2018(4):65-73.
|
| [16] |
龙祖坤, 杜倩文, 周婷. 武陵山区旅游扶贫效率的时间演进与空间分异[J]. 经济地理, 2015, 35(10):210-217.
|
| [17] |
|
| [18] |
程名望, 史清华, 徐剑侠. 中国农村劳动力转移动因与障碍的一种解释[J]. 经济研究, 2006(4):68-78.
|
| [19] |
|
/
| 〈 |
|
〉 |