
区域旅游发展空间差异变化对经济发展平衡性的影响
|
马丽君(1981—),男,山东临沂人,博士,副教授,博士生导师。主要研究方向为旅游经济运行。E-mail:ljmaljly@163.com。 |
收稿日期: 2019-04-11
修回日期: 2019-10-18
网络出版日期: 2025-04-25
基金资助
国家自然科学基金项目(41871123)
湖南省社会科学基金项目(17YBA370)
湖南省社会科学评审委员会课题(XSP18YBZ071)
The Impact of Spatial Differences in Regional Tourism Development on the Balance of Economic Development
Received date: 2019-04-11
Revised date: 2019-10-18
Online published: 2025-04-25
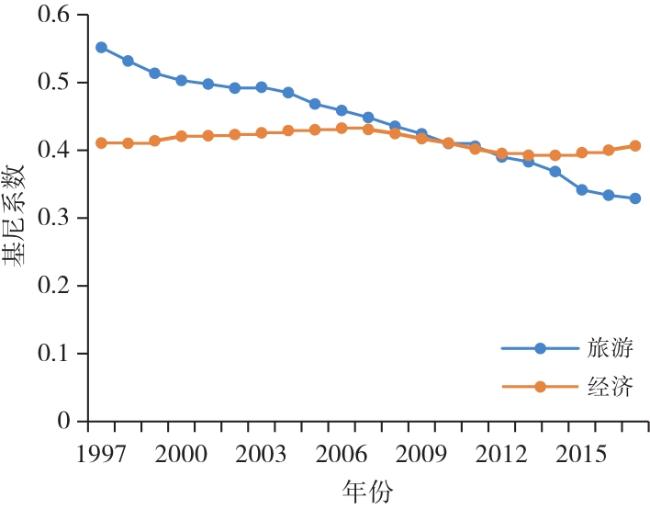
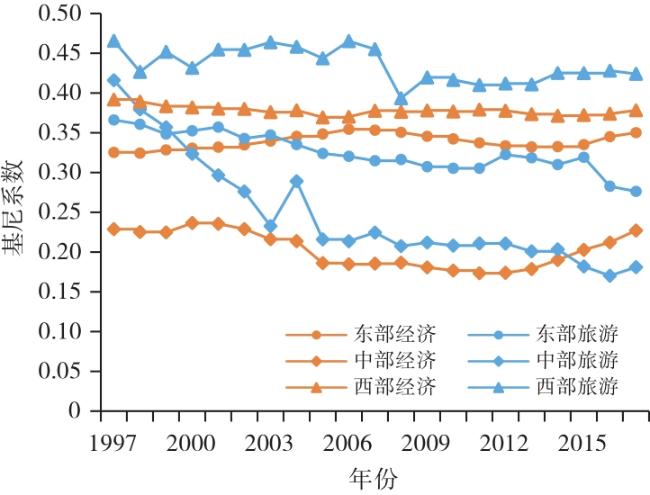
文章收集近20年相关数据,利用基尼系数、重心模型、格兰杰因果关系检验等方法,考察旅游发展空间差异变化对经济发展平衡性的影响,结果发现:①近20年来旅游增长速度要高于经济增长速度,西部省区旅游总收入占GDP比重较高,且旅游增长速度远大于经济增长速度,东部省区旅游总收入占GDP比重较低,且旅游增长速度与经济增长速度相差较小。②31省区旅游发展的空间差异和经济发展的不平衡性整体呈减小趋势,尤其旅游发展的区域不平衡明显减小。旅游与经济发展的平衡性有一定的同步性,但在不同区域两者的同步性强弱不同。③旅游发展的空间差异变化会影响到区域经济发展的平衡性,近20年的数据表明,我国大陆31个省区、中部和西部地区,旅游发展的不平衡性与经济发展的不平衡性呈正相关关系,随着旅游发展区域差异的减小,31个省区、中部、西部的旅游发展促进了区域经济发展的平衡,但对东部地区区域经济发展的平衡性无显著影响。
马丽君 , 张家凤 . 区域旅游发展空间差异变化对经济发展平衡性的影响[J]. 经济地理, 2020 , 40(1) : 197 -203 . DOI: 10.15957/j.cnki.jjdl.2020.01.022
This paper collects relevant data for nearly 20 years, using this ways that Gini coefficient, Gravity center model, and the Granger causality test,examines the impact of tourism development on promoting the balance of regional economic development. The results are as follows:1)The growth rate of tourism has been higher than economics in the past 20 years.The total tourism revenue of the western provinces accounts for a higher proportion of the gross national product, and the growth rate of tourism is much greater than the rate of economic growth. The total tourism revenue of the eastern provinces accounts for a small proportion of the gross national product, and there is a small difference between the growth rate of tourism and the rate of economic growth.2) The imbalance of tourism development and the imbalance of economic development in 31 provinces have shown a decreasing trend, especially in tourism development. The balance between tourism and economic development has a certain degree of synchronization, but in different regions, the synchronization of both is different. 3) The balance of tourism development will affect the balance of regional economic development, The data of the past 20 years show that there is a positive correlation between the imbalance of tourism development and the imbalance of economic development in 31 provinces, central and western regions of China Mainland. With the reduction of regional differences in tourism development, tourism development in 31 provinces, central and western regions has promoted the balance of regional economic development. However, it has no significant impact on the balance of regional economic development in the eastern region.
表1 1997—2017年31个省区旅游和经济发展概况表Tab.1 Economic and tourism growth in 31 provinces of China from 1997 to 2017 |
| 省份 | 经济增长率 | 旅游增长率 | 旅游总收入占GDP的比率 | 旅游与经济增长速度比 | ||
|---|---|---|---|---|---|---|
| 1997 | 2007 | 2017 | ||||
| 贵州 | 0.144887 | 0.290184 | 0.042754 | 0.189014 | 0.525582 | 2.002830 |
| 西藏 | 0.144521 | 0.267803 | 0.033775 | 0.141793 | 0.289456 | 1.853039 |
| 宁夏 | 0.142402 | 0.246642 | 0.012850 | 0.037930 | 0.080407 | 1.732012 |
| 陕西 | 0.142089 | 0.211501 | 0.063672 | 0.087852 | 0.219811 | 1.488511 |
| 北京 | 0.138650 | 0.108586 | 0.315388 | 0.234410 | 0.179806 | 0.783166 |
| 天津 | 0.137608 | 0.135397 | 0.198996 | 0.150112 | 0.191031 | 0.983933 |
| 内蒙 | 0.136591 | 0.288139 | 0.015422 | 0.064925 | 0.213628 | 2.109502 |
| 重庆 | 0.134605 | 0.198784 | 0.053420 | 0.108011 | 0.169641 | 1.476795 |
| 青海 | 0.130243 | 0.283308 | 0.010026 | 0.062226 | 0.144366 | 2.175226 |
| 江苏 | 0.129207 | 0.174126 | 0.059504 | 0.108729 | 0.134992 | 1.347651 |
| 广东 | 0.126931 | 0.136653 | 0.111247 | 0.080006 | 0.133238 | 1.076593 |
| 江西 | 0.126226 | 0.233222 | 0.046263 | 0.084777 | 0.311148 | 1.847654 |
| 安徽 | 0.124373 | 0.217837 | 0.042100 | 0.078413 | 0.225189 | 1.751481 |
| 湖南 | 0.123601 | 0.239021 | 0.026602 | 0.080121 | 0.207357 | 1.933811 |
| 浙江 | 0.122179 | 0.176580 | 0.066642 | 0.108993 | 0.180092 | 1.445257 |
| 四川 | 0.121627 | 0.223320 | 0.038996 | 0.115875 | 0.241294 | 1.836105 |
| 河南 | 0.121098 | 0.164063 | 0.068121 | 0.089802 | 0.150062 | 1.354795 |
| 山东 | 0.120615 | 0.192053 | 0.034576 | 0.063876 | 0.126590 | 1.592281 |
| 福建 | 0.119807 | 0.178703 | 0.053637 | 0.108940 | 0.157380 | 1.491591 |
| 海南 | 0.119365 | 0.130600 | 0.147533 | 0.139371 | 0.181957 | 1.094123 |
| 湖北 | 0.118912 | 0.172818 | 0.056205 | 0.070040 | 0.150974 | 1.453327 |
| 吉林 | 0.118688 | 0.295105 | 0.010594 | 0.067002 | 0.229384 | 2.486393 |
| 新疆 | 0.117970 | 0.262126 | 0.013068 | 0.058825 | 0.166846 | 2.221972 |
| 云南 | 0.116791 | 0.213373 | 0.073361 | 0.118432 | 0.418734 | 1.826964 |
| 山西 | 0.116499 | 0.253282 | 0.031612 | 0.102103 | 0.357979 | 2.174113 |
| 广西 | 0.115172 | 0.186778 | 0.074051 | 0.075754 | 0.273597 | 1.621731 |
| 甘肃 | 0.114949 | 0.249348 | 0.018858 | 0.017522 | 0.205819 | 2.169205 |
| 河北 | 0.110861 | 0.193182 | 0.038052 | 0.041844 | 0.170751 | 1.742561 |
| 上海 | 0.110110 | 0.091387 | 0.213108 | 0.164663 | 0.149096 | 0.829961 |
| 辽宁 | 0.095870 | 0.174103 | 0.046537 | 0.118584 | 0.198012 | 1.816032 |
| 黑龙江 | 0.088876 | 0.166462 | 0.027769 | 0.060660 | 0.117840 | 1.872969 |
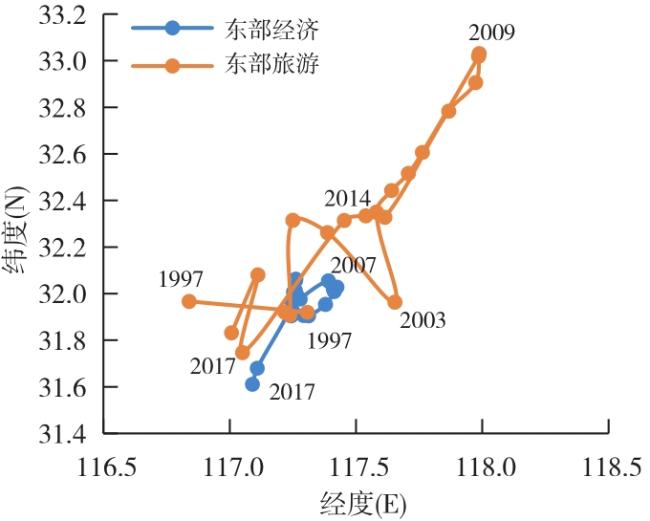
图4 东部地区旅游和经济重心变化Fig.4 The evolution of tourism and economic gravity centers in the eastern region from 1997 to 2017 |
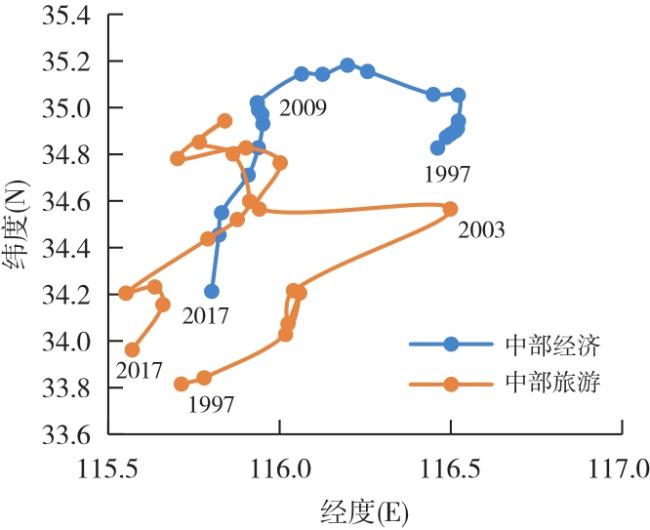
图5 中部地区旅游和经济重心演变Fig.5 The evolution of tourism and economic gravity centers in the central region from 1997 to 2017 |
表2 格兰杰因果关系的检验结果Tab.2 Results of Granger causality test |
| 关系 | 检验的F值 | 显著水平 | 结论 |
|---|---|---|---|
| Tt→Te | 3.897964 | 0.04817727 | 存在Granger因果关系 |
| Et→Ee | 0.824104 | 0.54513611 | 不存在Granger因果关系 |
| dlnMt→dlnMe | 3.956845 | 0.04250814 | 存在Granger因果关系 |
| Wt→We | 4.335246 | 0.06665356 | 存在Granger因果关系 |
注:1.Tt、Et、Mt、Wt分别代表全国31省区的旅游、东部旅游、中部旅游、西部旅游的时间序列,Te、Ee、Me、We分别代表全国31省区经济、东部经济、中部经济、西部经济的时间序列;2.dlnMt是序列Mt的一阶差分形式;3.显著水平选择10%为检验标准。 |
表3 回归方程结果Tab.3 Results of regression equation |
| 关系 | 地区 | Sig. | coefficients | constant | |
|---|---|---|---|---|---|
| 旅游→经济 | 全国31省区 | 0.003 | 0.381 | 0.124 | 0.359 |
| 中部 | 0.057 | 0.178 | 0.199 | 0.008 | |
| 西部 | 0.432 | 0.033 | 0.047 | 0.357 |
| [1] |
|
| [2] |
|
| [3] |
|
| [4] |
|
| [5] |
|
| [6] |
苏建军, 张毓, 孙根年. 中国旅游消费对经济增长的拉动效应与贡献度分析[J]. 消费经济, 2016, 32(1):34-40.
|
| [7] |
隋建利, 刘碧莹. 中国旅游发展与宏观经济增长的非线性时变因果关系——基于非线性马尔科夫区制转移因果模型[J]. 经济管理, 2017, 39(8):24-41.
|
| [8] |
衣传华. “锦上添花”还是“雪中送炭”:旅游发展对经济增长的影响[J]. 华东经济管理, 2017, 31(12):108-113.
|
| [9] |
张攀, 杨进, 周星. 中国旅游业发展与区域经济增长——254个地级市的面板数据[J]. 经济管理, 2014, 36(6):116-126.
|
| [10] |
庞丽, 王铮, 刘清春. 我国入境旅游和经济增长关系分析[J]. 地域研究与开发, 2006(3):51-55.
|
| [11] |
周文丽. 旅游对我国区域经济增长及其敛散性的影响——基于1997年—2010年省际面板数据的实证分析[J]. 旅游科学, 2012, 26(5):54-64.
|
| [12] |
王军军, 杜英, 王建平, 等. 旅游产业的溢出效应及其集群化测度研究——基于山西省11个地市的实证分析[J]. 统计与信息论坛, 2016, 31(4):74-79.
|
| [13] |
乔玮. 用投入产出模型分析旅游对上海经济的影响[J]. 经济地理, 2006, 26(S2):63-66.
|
| [14] |
张世兵. 湖南省入境旅游发展与经济增长的关系研究[J]. 经济地理, 2013, 33(7):182-186.
|
| [15] |
马仁锋, 倪欣欣, 张文忠, 等. 浙江旅游经济时空差异的多尺度研究[J]. 经济地理, 2015, 35(7):176-182.
|
| [16] |
赵磊. 旅游发展与经济增长——来自中国的经验证据[J]. 旅游学刊, 2015, 30(4):33-49.
|
| [17] |
马兴超, 马树才. 旅游发展对城乡收入差距的影响效应与机制研究——基于浙江省52个县的面板数据分析[J]. 华东经济管理, 2017, 31(1):13-22.
|
| [18] |
戴平生, 王冲. 入境旅游是否改善区域收入的不平等?[J]. 旅游学刊, 2018, 33(7):18-27.
|
| [19] |
陈秀琼, 黄福才. 中国入境旅游的区域差异特征分析[J]. 地理学报, 2006, 61(12):1271-1 280.
|
| [20] |
马丽君, 郭留留, 龙茂兴, 等. 1994年来中国入境旅游与对外贸易重心演变及其相关分析[J]. 经济地理, 2015, 35(11):198-204.
|
/
| 〈 |
|
〉 |