
中国文化产业效率的时空分异与影响因素
|
王家庭(1974—),男,山东诸城人,博士,副教授,硕士生导师,研究方向为城市与区域经济、土地与房地产经济、区域教育与文化产业发展等。E-mail:nkwangjt@nankai.edu.cn |
收稿日期: 2020-04-16
网络出版日期: 2025-04-25
基金资助
中央高校基本科研业务费专项资金资助项目(63192309)
Spatio-temporal Differentiation of Chinese Cultural Industry Efficiency and Its Influencing Factors
Received date: 2020-04-16
Online published: 2025-04-25
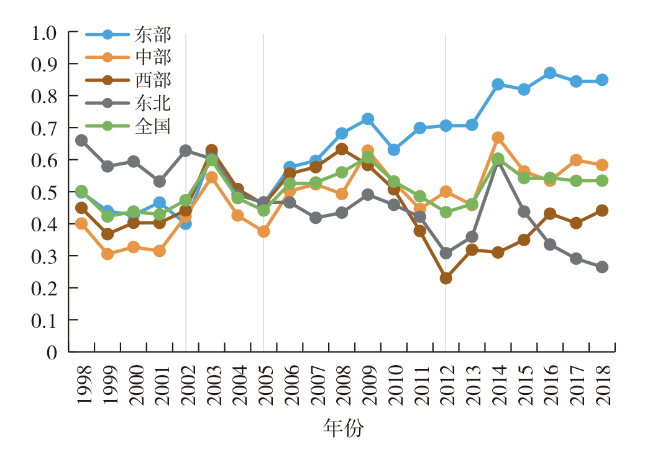
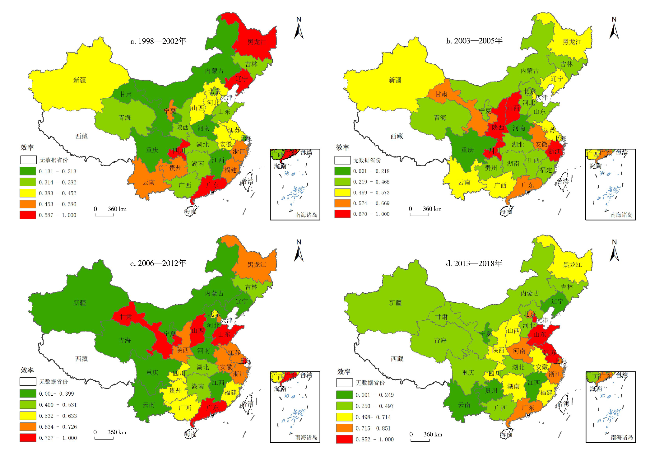
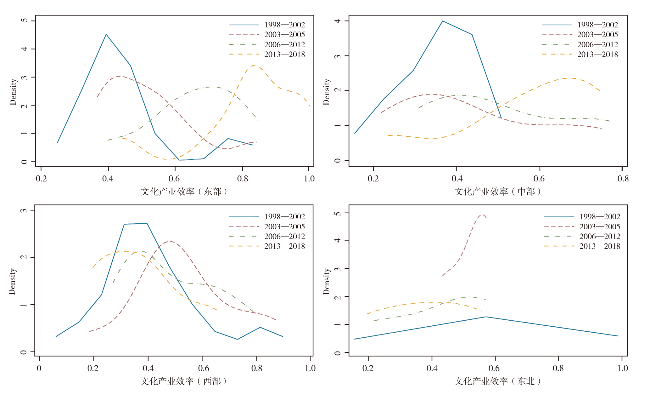
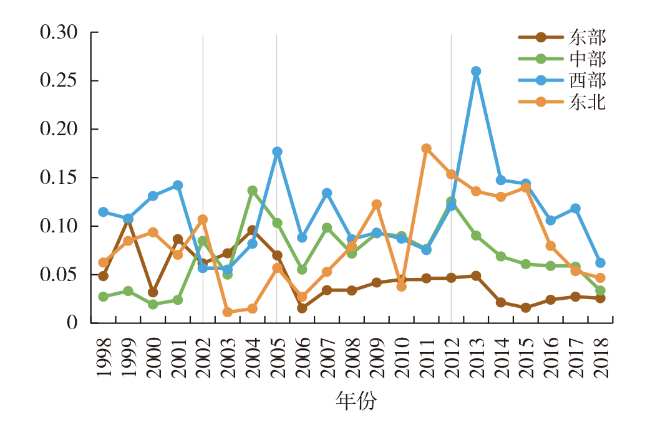
在推动文化产业建设国民经济支柱性产业的背景下,提高文化产业效率是实现这一目标的重要环节。文章使用SBM模型、核密度估计法和泰尔指数对1998—2018年中国文化产业效率进行测算和时空演进分析,并运用Tobit模型对文化产业效率的影响因素进行识别。结果显示:①中国文化产业效率总体呈现波动上涨的趋势,其变动可对应为文化产业初步发展、试点改革、试点改革推广和深化改革四个阶段。②中国文化产业效率在空间上表现出东高西低的分布格局,且高效率的省份不断集中。③2012年以前,中国文化产业效率的空间差异主要来自于区域内差异,而2012年以后,区域间差异开始产生更大的影响。④文化单位数量、文化市场潜力、文化产业基础设施和人力资本等因素共同作用,对中国文化产业效率产生着正向显著的影响。
王家庭 , 梁栋 . 中国文化产业效率的时空分异与影响因素[J]. 经济地理, 2021 , 41(4) : 82 -92 . DOI: 10.15957/j.cnki.jjdl.2021.04.011
Improving the efficiency of cultural industry is an important part to promote the cultural industry to be a pillar industry of national economy. This paper uses SBM model,kernel density estimation method and Theil index to measure and analyze the spatial and temporal evolution of the efficiency of China's cultural industry from 1998 to 2018,and then applies Tobit model to identify the influencing factors of the efficiency of cultural industry. The results show that: 1) The overall efficiency of China's cultural industry shows a trend of fluctuating rise,which can be divided into four stages: initial development,pilot reform,promotion of pilot reform and deepening reform. 2) China's cultural industry efficiency shows the characteristics of increasement from the west to the east,and the provinces with high efficiency are constantly concentrated. 3) Before 2012,the spatial differences of China's cultural industry efficiency mainly came from the intra-regional differences; the inter-regional differences began to have a greater impact on the spatial differences of China's cultural industry efficiency after 2012. 4) The number of cultural units,the potential of cultural market,the infrastructure of cultural industry and human capital have a positive and significant impact on the efficiency of China's cultural industry.
表1 文化产业效率影响因素解释变量的描述性统计Tab.1 Descriptive statistics of explanatory variables of influencing factors of cultural industry efficiency |
| 解释变量 | 变量符号 | 最大值 | 最小值 | 均值 | 标准差 |
|---|---|---|---|---|---|
| 文化单位数量 | 8 060.000 | 91.000 | 588.019 | 848.300 | |
| 文化市场潜力 | 5 049.400 | 26.915 | 914.861 | 887.626 | |
| 文化产业基础设施 | 78.000 | 0.022 | 26.080 | 22.201 | |
| 文化事业发展 | 183.556 | 1.110 | 28.247 | 31.484 | |
| 人力资本 | 1.603 | 0.004 | 0.089 | 0.098 |
表2 文化产业发展四阶段中各省市文化产业效率均值Tab.2 The average value of cultural industry efficiency in each region in the four stages during the development of cultural industry |
| 省份 | 1998—2002 | 2003—2005 | 2006—2012 | 2012—2018 |
|---|---|---|---|---|
| 北京 | 0.362 | 0.368 | 0.532 | 0.833 |
| 天津 | 0.414 | 0.530 | 0.634 | 0.966 |
| 河北 | 0.432 | 0.414 | 0.399 | 0.443 |
| 山西 | 0.421 | 0.751 | 0.771 | 0.478 |
| 内蒙古 | 0.293 | 0.426 | 0.398 | 0.396 |
| 辽宁 | 0.738 | 0.579 | 0.218 | 0.195 |
| 吉林 | 0.331 | 0.433 | 0.499 | 0.389 |
| 黑龙江 | 0.941 | 0.796 | 0.655 | 0.576 |
| 上海 | 0.295 | 0.515 | 0.849 | 0.811 |
| 江苏 | 0.390 | 0.568 | 0.667 | 0.938 |
| 浙江 | 0.491 | 0.845 | 0.726 | 0.835 |
| 安徽 | 0.452 | 0.646 | 0.725 | 0.682 |
| 福建 | 0.476 | 0.425 | 0.594 | 0.714 |
| 江西 | 0.210 | 0.367 | 0.309 | 0.235 |
| 山东 | 0.369 | 0.416 | 0.776 | 1.000 |
| 河南 | 0.295 | 0.218 | 0.311 | 0.328 |
| 湖北 | 0.382 | 0.369 | 0.460 | 0.397 |
| 湖南 | 0.366 | 0.342 | 0.487 | 0.610 |
| 广东 | 0.704 | 0.648 | 0.761 | 0.851 |
| 广西 | 0.339 | 0.525 | 0.598 | 0.380 |
| 四川 | 0.131 | 0.184 | 0.271 | 0.497 |
| 重庆 | 0.828 | 0.880 | 0.625 | 0.621 |
| 贵州 | 0.466 | 0.468 | 0.563 | 0.230 |
| 云南 | 0.586 | 0.560 | 0.398 | 0.249 |
| 陕西 | 0.373 | 0.790 | 0.725 | 0.661 |
| 甘肃 | 0.313 | 0.670 | 0.799 | 0.425 |
| 青海 | 0.330 | 0.419 | 0.352 | 0.389 |
| 宁夏 | 0.481 | 0.455 | 0.348 | 0.352 |
| 新疆 | 0.401 | 0.484 | 0.370 | 0.330 |
表3 中国文化产业效率的泰尔指数Tab.3 The Theil index decomposition value of the efficiency of cultural industry in China |
| 年份 | 区域间 差距 | 区域间 贡献度 | 区域内 差距 | 区域内 贡献度 | 泰尔 指数 |
|---|---|---|---|---|---|
| 1998 | 0.011 | 0.130 | 0.071 | 0.870 | 0.081 |
| 1999 | 0.018 | 0.164 | 0.092 | 0.836 | 0.111 |
| 2000 | 0.014 | 0.155 | 0.076 | 0.846 | 0.089 |
| 2001 | 0.013 | 0.118 | 0.095 | 0.883 | 0.108 |
| 2002 | 0.010 | 0.120 | 0.071 | 0.880 | 0.081 |
| 1998—2002 | 0.013 | 0.137 | 0.081 | 0.863 | 0.094 |
| 2003 | 0.001 | 0.025 | 0.055 | 0.975 | 0.057 |
| 2004 | 0.002 | 0.023 | 0.089 | 0.977 | 0.092 |
| 2005 | 0.003 | 0.027 | 0.116 | 0.973 | 0.120 |
| 2003—2005 | 0.002 | 0.025 | 0.087 | 0.975 | 0.089 |
| 2006 | 0.002 | 0.044 | 0.053 | 0.956 | 0.055 |
| 2007 | 0.005 | 0.053 | 0.088 | 0.947 | 0.093 |
| 2008 | 0.011 | 0.148 | 0.065 | 0.852 | 0.076 |
| 2009 | 0.007 | 0.087 | 0.077 | 0.913 | 0.084 |
| 2010 | 0.006 | 0.081 | 0.068 | 0.919 | 0.074 |
| 2011 | 0.037 | 0.339 | 0.072 | 0.661 | 0.109 |
| 2012 | 0.107 | 0.550 | 0.088 | 0.450 | 0.195 |
| 2006—2012 | 0.025 | 0.186 | 0.073 | 0.814 | 0.098 |
| 2013 | 0.060 | 0.336 | 0.118 | 0.664 | 0.178 |
| 2014 | 0.079 | 0.528 | 0.070 | 0.472 | 0.149 |
| 2015 | 0.064 | 0.489 | 0.067 | 0.511 | 0.131 |
| 2016 | 0.059 | 0.507 | 0.057 | 0.493 | 0.116 |
| 2017 | 0.065 | 0.521 | 0.060 | 0.479 | 0.125 |
| 2018 | 0.060 | 0.608 | 0.039 | 0.392 | 0.099 |
| 2013—2018 | 0.064 | 0.498 | 0.069 | 0.502 | 0.133 |
| 均值 | 0.030 | 0.241 | 0.076 | 0.759 | 0.106 |
表4 中国文化产业效率影响因素的回归结果Tab.4 The regression results of factors influencing the efficiency of China's cultural industry |
| 变量 | 全国 | 东部 | 中部 | 西部 | 东北 |
|---|---|---|---|---|---|
| 4.95E-05*** (3.78) | 1.34E-05* (1.81) | 2.03E-05* (1.74) | 1.82E-04** (2.19) | 2.74E-04* (1.83) | |
| 5.77E-05* (1.93) | 8.05E-05* (1.76) | 2.64E-05 (0.83) | 6.97E-05 (1.11) | 2.33E-06 (0.02) | |
| 0.007***(2.61) | 0.003**(2.05) | 0.008***(3.24) | -0.0042 (-1.56) | 0.007** (2.33) | |
| 0.002 (0.72) | 0.001 (0.84) | 0.007 (1.09) | 5.22E-04* (1.83) | 0.012*** (4.28) | |
| 0.294** (2.25) | 0.571 (1.17) | 1.705* (1.73) | 0.259* (1.85) | 2.586 (1.52) | |
| 0.414*** (15.90) | 0.410*** (8.26) | 0.380*** (5.40) | 0.433*** (9.84) | 0.865*** (5.92) | |
| 609 | 189 | 126 | 231 | 63 |
注:括号内数值为z统计量,***、**和*分别表示在1%、5%和10%的显著性水平下显著。 |
| [1] |
李文军, 李巧明. 改革开放40年我国文化产业发展历程及其取向[J]. 改革, 2018(12):54-64.
|
| [2] |
霍步刚. 国外文化产业发展比较研究[D]. 大连: 东北财经大学, 2009.
|
| [3] |
王家庭, 唐瑭. 新时代中国文化产业新旧动能转换的初步探索[J]. 同济大学学报:社会科学版, 2019, 30(5):32-40.
|
| [4] |
王家庭, 张容. 基于三阶段DEA模型的中国31省市文化产业效率研究[J]. 中国软科学, 2009(9):75-82.
|
| [5] |
马萱, 郑世林. 中国区域文化产业效率研究综述与展望[J]. 经济学动态, 2010(3):83-86.
|
| [6] |
何里文, 袁晓玲, 邓敏慧. 中国文化产业全要素生产率变动、区域差异分析——基于Malmquist生产力指数的分析[J]. 经济问题探索, 2012(9):71-77.
|
| [7] |
戴俊骋, 孙东琪, 张欣亮. 中国区域文化产业发展空间格局[J]. 经济地理, 2018, 38(9):122-129.
|
| [8] |
|
| [9] |
王家庭, 梁栋. 中国文化制造业绿色全要素生产率测度及其影响因素研究[J]. 西安交通大学学报:社会科学版, 2020, 40(5):53-65.
|
| [10] |
|
| [11] |
|
| [12] |
马跃如, 白勇, 程伟波. 基于SFA的我国文化产业效率及影响因素分析[J]. 统计与决策, 2012(8):97-101.
|
| [13] |
赵琼, 姜惠宸. 文化产业上市公司效率评价及影响因素分析——基于DEA模型的分析框架[J]. 经济问题, 2014(9):52-58,71.
|
| [14] |
曾荣平, 蔡爱斌. 我国文化产业效率区域差异影响因素再解析[J]. 文化产业研究, 2019(4):287-302.
|
| [15] |
雷宏振, 李芸. 文化产业发展效率时空差异及影响因素分析[J]. 当代经济管理, 2020, 42(6):50-56.
|
| [16] |
|
| [17] |
|
| [18] |
叶世绮, 颜彩萍, 莫剑芳. 确定DEA指标体系的B-D方法[J]. 暨南大学学报:自然科学与医学版, 2004(3):249-255.
|
| [19] |
蒋萍, 王勇. 全口径中国文化产业投入产出效率研究——基于三阶段DEA模型和超效率DEA模型的分析[J]. 数量经济技术经济研究, 2011, 28(12):69-81.
|
| [20] |
王恕立, 胡宗彪. 中国服务业分行业生产率变迁及异质性考察[J]. 经济研究, 2012, 47(4):15-27.
|
| [21] |
鲁小伟, 毕功兵. 基于主成分分析法的区域文化产业效率评价[J]. 统计与决策, 2014(1):63-65.
|
| [22] |
曾燕萍, 康玮. 中国文化服务业企业全要素生产率变动及其影响因素研究——基于DEA-Malmquist指数法的分析[J]. 上海经济研究, 2019(5):63-72.
|
| [23] |
陈诗一. 中国工业分行业统计数据估算:1980—2008[J]. 经济学(季刊), 2011(3):735-776.
|
| [24] |
|
| [25] |
袁海, 吴振荣. 中国省域文化产业效率测算及影响因素实证分析[J]. 软科学, 2012, 26(3):72-77.
|
| [26] |
|
| [27] |
范志杰. 发展文化事业促进文化产业政策研究[D]. 北京: 财政部财政科学研究所, 2013.
|
| [28] |
戴钰. 湖南省文化产业集聚及其影响因素研究[J]. 经济地理, 2013, 33(4):114-119.
|
/
| 〈 |
|
〉 |