
西藏县域综合经济实力变化与政策思路探析
|
卜洁文(1989—),女,陕西西安人,博士研究生,研究方向为公共管理。E-mail:bjw13@mails.tsinghua.edu.cn |
收稿日期: 2020-10-29
网络出版日期: 2025-04-25
基金资助
国家社会科学基金重大项目(20ZDA042)
Spatio-temporal Evolution of the Comprehensive Economic Strength of Tibet Autonomous Region at the County Level and Its Policy Suggestions
Received date: 2020-10-29
Online published: 2025-04-25
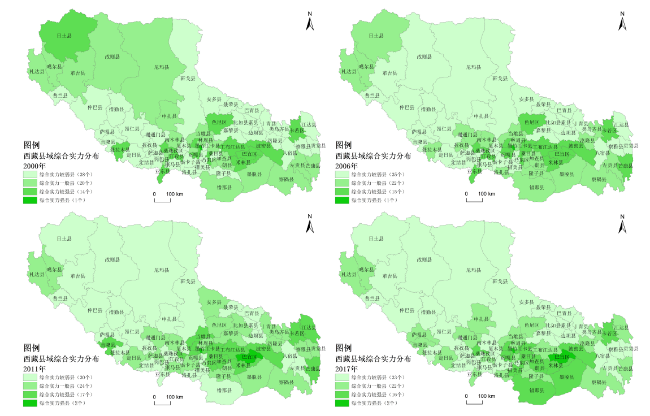
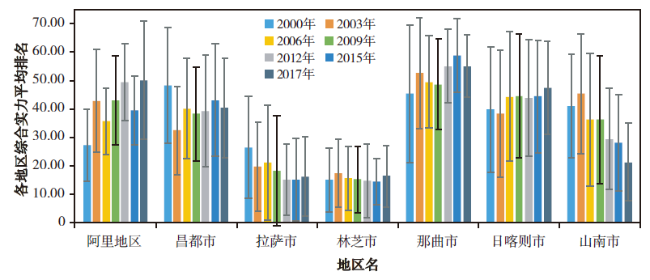
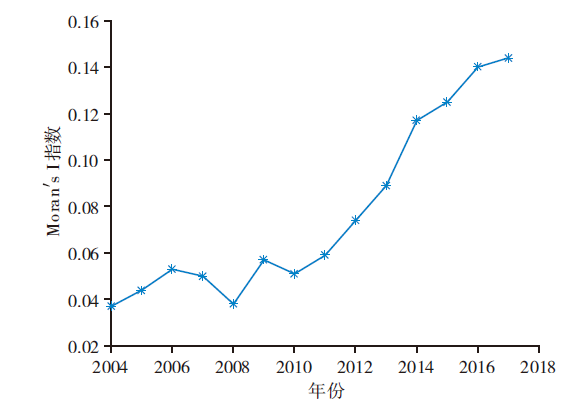
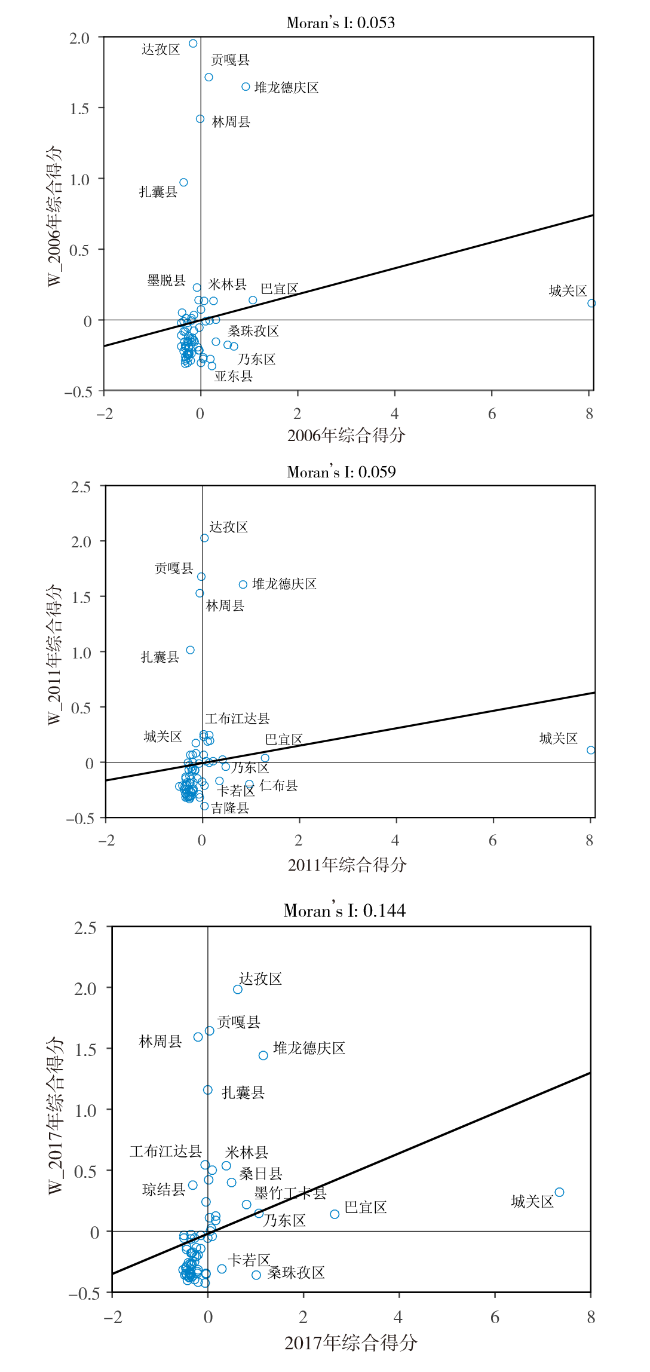
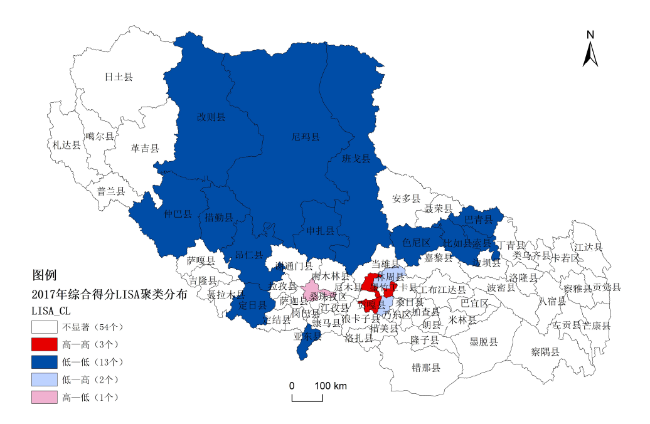
西藏是全国唯一的省级集中连片特困地区。文章采用2000—2017年西藏县域综合实力指标面板数据,运用主成分分析和空间自相关分析等方法和相关软件,分析西藏县域综合实力的时空演化特征。结果表明:西藏县域间综合实力差距有逐渐拉大的趋势,且自2004年开始综合实力空间分布表现出较显著的空间正相关性(空间集聚)。局部空间自相关分析结果显示,高—高聚集和低—低聚集的二元分布是西藏县域空间分布的显著特征,且已初步形成以城关区和巴宜区两个地区强县为主导的“强县经济圈”。根据西藏县域时空分异特征,探讨西藏后续发展的政策思路及建议。
关键词: 西藏; 县域综合实力; 探索性数据分析(ESDA); 主成分分析
卜洁文 . 西藏县域综合经济实力变化与政策思路探析[J]. 经济地理, 2021 , 41(4) : 66 -73 . DOI: 10.15957/j.cnki.jjdl.2021.04.009
The Tibet Autonomous Region is the only provincial-level contiguous destitute area in China. This paper utilizes the panel data of counties in Tibet Autonomous Region from 2000 to 2017,and analyzes the spatio-temporal evolution features of its comprehensive strength applying the methods of principal component analysis and spatial autocorrelation analysis as well as relevant tools. The results show that the gap of comprehensive strength among the Tibetan counties is gradually widening. The spatial distribution of comprehensive strength of each county shows positive spatial autocorrelation (spatial agglomeration). In terms of local spatial autocorrelation,the results show that the binary distribution of high-high aggregation and low-low aggregation is a prominent feature of the spatial distribution of the Tibetan counties. The 'strong-economic circle' dominated by two strong counties (Chengguan District and Bayi District) has been initially formed. Based on the features of the spatio-temporal distribution in the Tibet Autonomous Region,the policy ideas and suggestions for the follow-up development of the Tibet Autonomous Region are discussed.
表1 主成分及累计方差贡献率Tab.1 Principal component and cumulative variance contribution rate |
| 成分 | 初始特征值 | 提取载荷平方和 | 旋转载荷平方和 | ||||||||
|---|---|---|---|---|---|---|---|---|---|---|---|
| 总计 | 方差 % | 累积 % | 总计 | 方差 % | 累积 % | 总计 | 方差 % | 累积 % | |||
| 1 | 5.598 | 62.206 | 62.206 | 5.598 | 62.206 | 62.206 | 4.228 | 46.975 | 46.975 | ||
| 2 | 1.371 | 15.231 | 77.436 | 1.371 | 15.231 | 77.436 | 2.135 | 23.726 | 70.701 | ||
| 3 | 0.915 | 10.165 | 87.601 | 0.915 | 10.165 | 87.601 | 1.521 | 16.900 | 87.601 | ||
| 4 | 0.517 | 5.748 | 93.350 | ||||||||
| 5 | 0.252 | 2.795 | 96.145 | ||||||||
| 6 | 0.183 | 2.035 | 98.180 | ||||||||
| 7 | 0.106 | 1.180 | 99.360 | ||||||||
| 8 | 0.048 | 0.531 | 99.891 | ||||||||
| 9 | 0.010 | 0.109 | 100.000 | ||||||||
表2 成分矩阵、成分旋转矩阵和得分系数矩阵Tab.2 Component matrix,rotational component matrix and score coefficient matrix |
| 指标 | 成分矩阵 | 成分旋转矩阵 | 得分系数矩阵 | ||||||||
|---|---|---|---|---|---|---|---|---|---|---|---|
| 1 | 2 | 3 | 1 | 2 | 3 | 1 | 2 | 3 | |||
| GDP | 0.799 | 0.443 | 0.091 | 0.413 | 0.655 | 0.494 | -0.071 | 0.286 | 0.219 | ||
| 第二产业产值 | 0.952 | -0.245 | -0.099 | 0.935 | 0.287 | 0.140 | 0.258 | -0.075 | -0.021 | ||
| 财政预算收入 | 0.929 | -0.134 | 0.200 | 0.786 | 0.550 | 0.034 | 0.133 | 0.204 | -0.160 | ||
| 地区存贷款总额 | 0.515 | 0.548 | 0.464 | 0.033 | 0.842 | 0.267 | -0.252 | 0.602 | 0.014 | ||
| 第二产业占比 | 0.689 | -0.119 | 0.501 | 0.505 | 0.665 | -0.204 | 0.010 | 0.436 | -0.364 | ||
| 人均GDP | 0.919 | 0.088 | -0.172 | 0.757 | 0.361 | 0.423 | 0.150 | -0.033 | 0.207 | ||
| 人均储蓄存款余额 | 0.903 | -0.206 | -0.284 | 0.920 | 0.140 | 0.267 | 0.286 | -0.220 | 0.121 | ||
| 在校学生 | 0.792 | -0.478 | -0.166 | 0.938 | 0.056 | -0.037 | 0.339 | -0.219 | -0.110 | ||
| 每千人医疗及福利院床位 | 0.405 | 0.709 | -0.502 | 0.099 | 0.129 | 0.945 | -0.067 | -0.153 | 0.739 | ||
表3 2017年西藏自治区县域综合实力得分(前20名)Tab.3 Comprehensive strength score in Tibetan counties (Top 20) in 2017 |
| 区县名 | 得分 | 排名 | 区县名 | 得分 | 排名 |
|---|---|---|---|---|---|
| 城关区 | 4.6319 | 1 | 加查县 | 0.1050 | 11 |
| 巴宜区 | 1.6696 | 2 | 波密县 | 0.0999 | 12 |
| 堆龙德庆区 | 0.7253 | 3 | 错那县 | 0.0571 | 13 |
| 乃东区 | 0.6711 | 4 | 墨脱县 | 0.0558 | 14 |
| 桑珠孜区 | 0.6331 | 5 | 措美县 | 0.0460 | 15 |
| 墨竹工卡县 | 0.5108 | 6 | 曲水县 | 0.0356 | 16 |
| 达孜区 | 0.3883 | 7 | 朗县 | 0.0243 | 17 |
| 桑日县 | 0.3146 | 8 | 贡嘎县 | 0.0208 | 18 |
| 米林县 | 0.2396 | 9 | 曲松县 | -0.0017 | 19 |
| 卡若区 | 0.1801 | 10 | 当雄县 | -0.0037 | 20 |
| [1] |
孙久文, 张静, 李承璋, 等. 我国集中连片特困地区的战略判断与发展建议[J]. 管理世界, 2019, 35(10):150-159,185.
|
| [2] |
杨龙, 徐伍达, 张伟宾, 等. 西藏作为特殊集中连片贫困区域的多维贫困测量——基于“一江两河”地区农户家计调查[J]. 西藏研究, 2014(1):69-77.
|
| [3] |
李俊清, 向娟. 民族地区贫困成因及其治理[J]. 中国行政管理, 2018(10):59-63.
|
| [4] |
周猛. 西藏牧区县域欠发达原因剖析——以改则县为例[J]. 农村经济, 2012(12):41-46.
|
| [5] |
周猛. 集中连片特困牧区的致贫因素探析与对策研究——以改则县为例[J]. 西部发展评论,2013:175-185.
|
| [6] |
徐伍达. 西藏打赢深度贫困地区脱贫攻坚战的路径选择[J]. 西南民族大学学报:人文社科版, 2018(5):57-62.
|
| [7] |
蒲柯竹, 美郎宗贞. 西藏区域经济发展差异实证研究[J]. 西藏大学学报:社会科学版, 2019(4):155-163.
|
| [8] |
田茂德, 毛阳海. 西藏区域经济差异问题分析[J]. 中国集体经济, 2014(8):33-34.
|
| [9] |
邓青春. 2000年以来西藏区域经济差异演变分析及对策[J]. 四川林勘设计, 2010(1):8-12.
|
| [10] |
陈朴, 杨本锋. 西藏三大经济区差异和协调发展的实证分析[J]. 西藏研究, 2010(1):83-98.
|
| [11] |
李国斌. 西藏区域经济增长σ收敛空间实证研究[J]. 西藏科技, 2018(3):21-24.
|
| [12] |
陈利, 朱喜刚, 李小虎. 云南省区域经济差异时空演变特征[J]. 经济地理, 2014, 34(8):15-22.
|
| [13] |
白雪, 杜宾宾, 姜亚莉. 基于县域单元的广东省经济空间差异及演化研究[J]. 水土保持研究, 2019(5):296-303.
|
| [14] |
张安驰, 范从来. 空间自相关性与长三角区域一体化发展的整体推进[J]. 现代经济探讨, 2019(8):15-24.
|
| [15] |
张利国, 鲍丙飞, 杨胜苏. 我国农业可持续发展空间探索性分析[J]. 经济地理, 2019, 39(11):159-164.
|
| [16] |
冉泽泽. 基于ESDA的经济空间差异实证研究——以丝绸之路经济带中国西北段核心节点城市为例[J]. 经济地理, 2017, 37(5):28-34.
|
| [17] |
蔡芳芳, 濮励杰, 张健, 等. 基于ESDA的江苏省县域经济发展空间模式解析[J]. 经济地理, 2012, 32(3):22-28.
|
| [18] |
何晓群. 应用多元统计分析[M]. 北京: 中国统计出版社, 2010.
|
| [19] |
|
| [20] |
|
/
| 〈 |
|
〉 |