
省域环境全要素生产率时空差异及其影响因素
|
赵娜(1980—),女,陕西渭南人,博士,副教授,硕士生导师,研究方向为财税政策与环境污染。E-mail:georgina_z1980@126.com |
收稿日期: 2020-05-27
网络出版日期: 2025-04-25
基金资助
教育部人文社会科学研究青年基金项目(18YJC790229)
陕西省软科学一般项目(2021KRM067)
陕西省哲学社会科学重大理论与现实问题研究项目(2021ND0313)
西安外国语大学2018年“青年优秀人才支持计划”
Spatial-temporal Differences of Environmental Total Factor Productivity and Its Influencing Factors in China
Received date: 2020-05-27
Online published: 2025-04-25
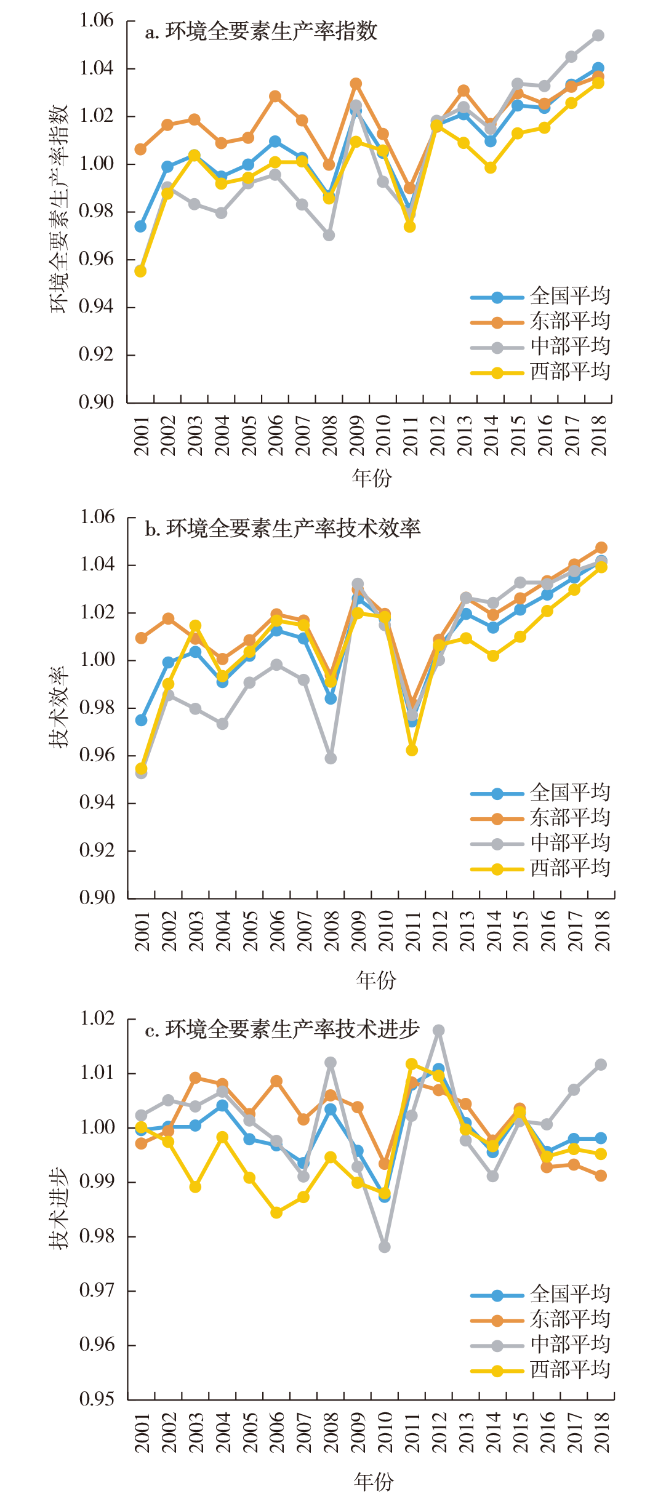
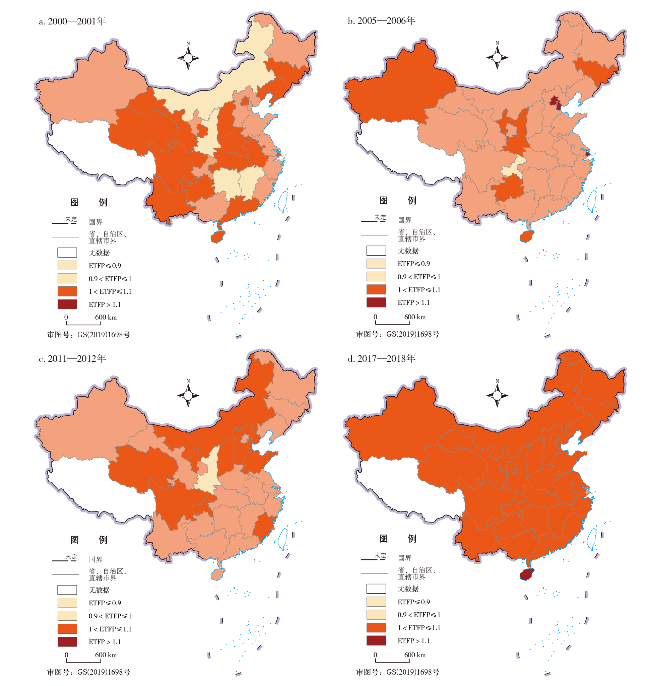
运用非径向、非角度的SBM方向性距离函数和Malmquist-Luenberger指数估算我国30个省域2001—2018年的环境全要素生产率,在此基础上从时间和空间两个维度分析其演变特征。结果表明:中国环境全要素生产率主要受到技术效率的拉动并在样本期内以0.8%的速度增长,技术进步没有改善。西部地区环境全要素生产率一直落后于东部和中部地区,2012年之前,东部地区环境全要素生产率位居前列,2012年之后,东部和中部地区环境全要素生产率交替领先其他地区。省域间环境全要素生产率差距不断缩小,截至2018年已有29个省域环境全要素生产率处于较高水平。进一步分析其影响因素发现:产业结构对环境全要素生产率存在负向影响,外商直接投资、财政分权,以及研发投入对环境全要素生产率有着显著的促进作用。
关键词: 环境全要素生产率; 产业结构; 外商直接投资; SBM方向性距离函数; Malmquist-Luenberger指数
赵娜 , 李光勤 , 何建宁 . 省域环境全要素生产率时空差异及其影响因素[J]. 经济地理, 2021 , 41(4) : 100 -107 . DOI: 10.15957/j.cnki.jjdl.2021.04.013
In this paper,the non-radial and non-angular SBM directional distance function and Malmquist-Luenberger index are used to estimate the environmental total factor productivity (ETFP) in 30 provinces of China from 2001 to 2018. On this basis,its development characteristics are analyzed from spatial and temporal dimensions. The results show that China's ETFP is mainly driven by technical efficiency. And it grows at a rate of 0.8% during the sample period. However,the technological progress has not improved. The ETFP of the western region has been lagging behind the eastern and central regions. Before 2012, the ETFP of the eastern region was in the lead. After 2012,the ETFP of the eastern and central regions alternately got ahead of other regions. The gap of ETFP between provinces has been narrowing. There are 29 provinces with higher ETFP by the end of 2018. Further analysis of the influencing factors of ETFP shows that: Industrial structure has a negative impact on ETFP,foreign direct investment,fiscal decentralization,and R&D investment has a significant role in promoting ETFP.
表1 2001—2018年中国省级环境全要素生产率指数及其分解Tab.1 Environmental Total Factor Productivity Index and its decomposition in China from 2001 to 2018 |
| 省区 | 技术进步指数 | 技术效率指数 | 环境全要素生产率 |
|---|---|---|---|
| 北京 | 1.008 | 1.050 | 1.057 |
| 天津 | 1.000 | 1.034 | 1.033 |
| 河北 | 1.000 | 1.001 | 1.001 |
| 山西 | 1.006 | 1.008 | 1.014 |
| 内蒙古 | 0.988 | 1.021 | 1.010 |
| 辽宁 | 1.002 | 1.003 | 1.005 |
| 吉林 | 0.997 | 1.013 | 1.010 |
| 黑龙江 | 1.013 | 1.004 | 1.017 |
| 上海 | 1.001 | 1.055 | 1.056 |
| 江苏 | 1.000 | 1.002 | 1.002 |
| 浙江 | 1.003 | 1.003 | 1.006 |
| 安徽 | 0.995 | 1.013 | 1.007 |
| 福建 | 1.004 | 1.003 | 1.007 |
| 江西 | 0.998 | 0.987 | 0.985 |
| 山东 | 1.000 | 1.004 | 1.004 |
| 河南 | 1.004 | 1.005 | 1.009 |
| 湖北 | 1.001 | 1.006 | 1.006 |
| 湖南 | 0.996 | 0.986 | 0.982 |
| 广东 | 1.000 | 1.000 | 1.000 |
| 广西 | 1.000 | 1.000 | 1.000 |
| 海南 | 1.000 | 1.034 | 1.034 |
| 重庆 | 0.993 | 1.007 | 1.000 |
| 四川 | 1.000 | 1.000 | 1.001 |
| 贵州 | 1.004 | 1.015 | 1.020 |
| 云南 | 1.000 | 1.000 | 1.000 |
| 陕西 | 1.000 | 0.964 | 0.964 |
| 甘肃 | 1.000 | 1.001 | 1.001 |
| 青海 | 0.999 | 1.002 | 1.001 |
| 宁夏 | 0.989 | 1.017 | 1.006 |
| 新疆 | 0.981 | 1.032 | 1.013 |
| 平均值 | 0.999 | 1.009 | 1.008 |
| 东部平均 | 1.002 | 1.017 | 1.019 |
| 中部平均 | 1.001 | 1.003 | 1.004 |
| 西部平均 | 0.996 | 1.005 | 1.000 |
表2 环境全要素生产率影响因素回归结果Tab.2 Regression results of influencing factors of Environmental Total Factor Productivity |
| 模型(1) | 模型(2) | 模型(3) | 模型(4) | 模型(5) | 模型(6) | |
|---|---|---|---|---|---|---|
| stru | -0.029*(0.085) | -0.029***(0.001) | -0.033***(0.000) | -0.028***(0.000) | -0.027***(0.002) | -0.024***(0.002) |
| fdi | -0.000*(0.094) | 0.003*(0.085) | 0.002(0.156) | 0.002*(0.056) | 0.002*(0.072) | |
| fd | 0.098***(0.000) | 0.092***(0.000) | 0.059***(0.001) | 0.068***(0.001) | ||
| rd | 0.005***(0.006) | 0.005***(0.006) | 0.005***(0.008) | |||
| pgdp | 0.005*(0.091) | -0.032(0.395) | ||||
| pgdp2 | 0.002(0.322) | |||||
| 常数项 | 0.120***(0.000) | 0.120***(0.000) | 0.164***(0.000) | 0.173***(0.000) | 0.110**(0.019) | 0.287(0.121) |
| σu | 0.012***(0.000) | 0.012***(0.000) | 0.008***(0.000) | 0.008***(0.000) | 0.008***(0.000) | 0.007***(0.000) |
| σe | 0.024***(0.000) | 0.024***(0.000) | 0.023***(0.000) | 0.022***(0.000) | 0.022***(0.000) | 0.022***(0.000) |
| 样本量 | 540 | 540 | 540 | 540 | 540 | 540 |
| Wald检验 | 11.01*** | 10.99*** | 103.38*** | 113.91*** | 118.54*** | 120.88*** |
注:***、**和*分别表示在1%、5%和10%的水平下显著,括号内数据为各统计量的p值。 |
| [1] |
|
| [2] |
|
| [3] |
|
| [4] |
|
| [5] |
杨俊, 邵汉华. 环境约束下的中国工业增长状况研究——基于Malmquist-Luenberger指数的实证分析[J]. 数量经济技术经济研究, 2009, 26(9):64-78.
|
| [6] |
赵萌. 中国煤炭企业的全要素生产率增长[J]. 统计研究, 2011, 28(8):55-62.
|
| [7] |
肖攀, 李连友, 唐李伟, 等. 中国城市环境全要素生产率及其影响因素分析[J]. 管理学报, 2013, 10(11):1681-1689.
|
| [8] |
李小胜, 余芝雅, 安庆贤. 中国省际环境全要素生产率及其影响因素分析[J]. 中国人口·资源与环境, 2014, 24(10):17-23.
|
| [9] |
王冰, 程婷. 我国中部城市环境全要素生产率的时空演变——基于Malmquist-Luenberger生产率指数分解方法[J]. 长江流域资源与环境, 2019, 28(1):48-59.
|
| [10] |
余泳泽. 中国省际全要素生产率动态空间收敛性研究[J]. 世界经济, 2015, 38(10):30-55.
|
| [11] |
李春米, 毕超. 中国西部地区环境全要素生产率增长研究[J] 兰州大学学报:社会科学版, 2015, 43(4):48-59.
|
| [12] |
|
| [13] |
|
| [14] |
张军, 吴桂英, 张吉鹏. 中国省际物质资本存量估算:1952—2000[J]. 经济研究, 2004(10):35-44.
|
| [15] |
单豪杰. 中国资本存量K的再估算:1952-2006年[J]. 数量经济技术经济研究, 2008, 25(10):17-31.
|
| [16] |
吴延兵. 财政分权促进技术创新吗?[J]. 当代经济科学, 2019, 41(3):13-25.
|
| [17] |
台航, 张凯强, 孙瑞. 财政分权与企业创新激励[J]. 经济科学, 2018(1):52-68.
|
| [18] |
杨世迪, 韩先锋, 宋文飞. 对外直接投资影响了中国绿色全要素生产率吗[J]. 山西财经大学学报, 2017, 39(4):14-26.
|
/
| 〈 |
|
〉 |