
吉林省人口年龄结构变化对区域经济影响研究
|
谷国锋(1966—),男,吉林农安人,教授,博士生导师。主要研究方向为区域经济增长与可持续发展。E-mail:gugf@nenu.edu.cn。 |
收稿日期: 2018-04-23
修回日期: 2018-08-20
网络出版日期: 2025-04-25
基金资助
国家社会科学基金一般项目(16BJL032)
The Impact of Population Age Structure Change on Regional Economy
Received date: 2018-04-23
Revised date: 2018-08-20
Online published: 2025-04-25
谷国锋 , 吴英哲 . 吉林省人口年龄结构变化对区域经济影响研究[J]. 经济地理, 2019 , 39(1) : 47 -55 . DOI: 10.15957/j.cnki.jjdl.2019.01.006
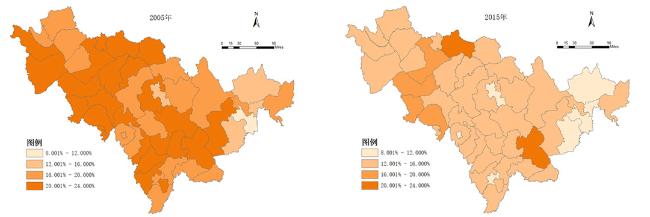
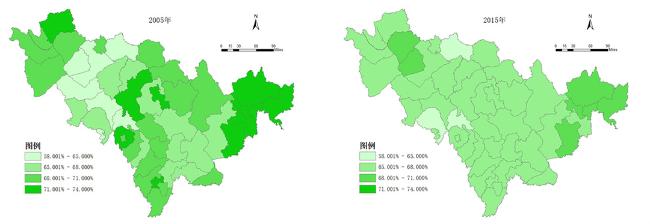
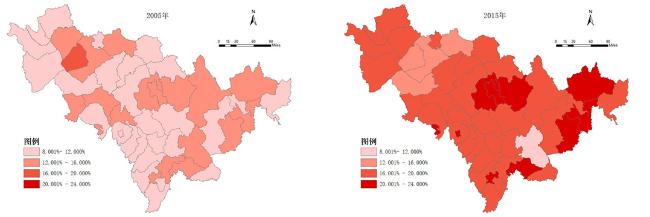
Population fertility policy is one of the important factors leading to changes in the age structure of the population in the region and has a strong lag. It strongly implements the family planning policy in Jilin Province, which has a significant effect on the suppression of population growth, but it also makes its age structure problem more prominent than other provinces. Based on the ESDA analysis method, this paper analyzes the temporal and spatial characteristics of the age structure of 47 administrative units in Jilin Province from 2005 to 2015. The results show that, since 2005, the proportion of juvenile in Jilin Province has continuously shrunk, and the concentration of working-age population has weakened. The attractiveness of core cities to the working-age has decreased, and the proportion of the elderly in the province has continuously increased with the acceleration of aging process. This paper analyzes the influence of age structure change on regional economy by the method of the spatial econometric model, SLX model and SDM model. The results of the measurement analysis show that: Currently, the increase of the birth rate and the proportion of juvenile will enhance the economic growth. In the short term, the increase in the proportion of the elderly have a positive effect on the regional economy, while the increase in mortality rate will have a negative effect on the economic growth, but the degree of impact is small.
表1 吉林省人口年龄结构变动Tab.1 Population age structure change in Jilin Province |
| 年份 | 0~17岁人口 | 18~60岁人口 | 60岁以上人口 | |||||
|---|---|---|---|---|---|---|---|---|
| 数量/万人 | 占比/% | 数量/万人 | 占比/% | 数量/万人 | 占比/% | |||
| 2005 | 520.43 | 19.496 | 1 833.72 | 68.695 | 315.22 | 11.809 | ||
| 2006 | 509.39 | 19.011 | 1 849.20 | 69.013 | 320.91 | 11.976 | ||
| 2007 | 495.22 | 18.368 | 1 864.83 | 69.169 | 336.00 | 12.463 | ||
| 2008 | 480.11 | 17.713 | 1 885.26 | 69.552 | 345.19 | 12.735 | ||
| 2009 | 473.17 | 17.399 | 1 883.04 | 69.243 | 363.26 | 13.358 | ||
| 2010 | 469.45 | 17.235 | 1 878.42 | 68.963 | 375.94 | 13.802 | ||
| 2011 | 460.24 | 16.880 | 1 872.41 | 68.673 | 393.89 | 14.447 | ||
| 2012 | 456.93 | 16.914 | 1 839.20 | 68.081 | 405.37 | 15.005 | ||
| 2013 | 404.57 | 15.104 | 1 830.44 | 68.337 | 443.52 | 16.558 | ||
| 2014 | 398.72 | 14.926 | 1 803.00 | 67.495 | 469.58 | 17.579 | ||
| 2015 | 392.08 | 14.728 | 1 770.61 | 66.512 | 499.39 | 18.759 | ||
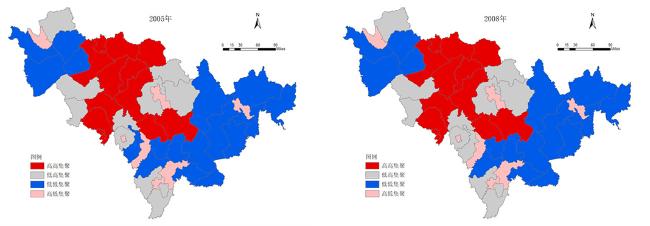
表2 2005—2015年吉林省适龄劳动人口全局Moran指数及其检验Tab.2 Moran’s index and its test of the working-agein Jilin Province from 2005 to 2015 |
| 时间 | 2005 | 2006 | 2007 | 2008 | 2009 | 2010 | 2010 | 2011 | 2012 | 2013 | 2014 | 2015 |
|---|---|---|---|---|---|---|---|---|---|---|---|---|
| Moran’s I | 0.134 | 0.124 | 0.125 | 0.125 | 0.131 | 0.131 | 0.131 | 0.127 | 0.122 | 0.137 | 0.140 | 0.141 |
| P值 | 0.041 | 0.054 | 0.058 | 0.061 | 0.043 | 0.048 | 0.048 | 0.056 | 0.064 | 0.042 | 0.045 | 0.045 |
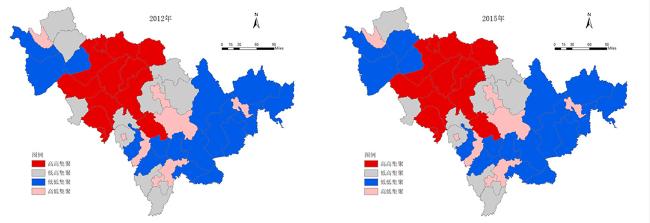
图4 吉林省2005和2008年适龄劳动人口Moran散点空间分布图Fig.4 Spatial distribution of Moran dispersion for the working-age in Jilin Province in 2005 and 2008 |
表3 空间计量模型估计结果Tab.3 The estimation results of spatial econometric model |
| 邻接矩阵 | 地理距离 | |||||
|---|---|---|---|---|---|---|
| OLS | SLM | SDM | SLM | SDM | ||
| A | 0.0967*** | 0.1611*** | 0.1876*** | 0.1565*** | 0.1845*** | |
| (3.8223) | (6.7105) | (7.4879) | (6.4269) | (7.5891) | ||
| K | 0.8401*** | 0.8905*** | 0.8316*** | 0.9078*** | 0.8196*** | |
| (24.4398) | (26.1988) | (23.2167) | (26.6756) | (23.4242) | ||
| PY | 0.0260*** | 0.0271*** | 0.0109*** | 0.0292*** | 0.0071* | |
| (6.7831) | (7.4708) | (2.8809) | (7.9756) | (1.8108) | ||
| PO | 0.0140*** | 0.0344*** | 0.0271*** | 0.0367*** | 0.0198*** | |
| (2.8332) | (6.0087) | (5.0146) | (6.3436) | (3.4985) | ||
| b | 0.0147** | 0.0201*** | 0.0142** | 0.0234*** | 0.0112* | |
| (2.4658) | (3.4042) | (2.3433) | (3.9517) | (1.8519) | ||
| m | -0.0162*** | -0.0121*** | -0.0083*** | -0.0123*** | -0.0071** | |
| (-5.1214) | (-3.4980) | (-2.6041) | (-3.4905) | (-2.2171) | ||
| W·A | -0.1518*** | -0.1974*** | ||||
| (-3.8058) | (-3.6249) | |||||
| W·K | -0.2407*** | -0.0398 | ||||
| (-3.3783) | (-0.3840) | |||||
| W·PY | 0.0215*** | 0.0530*** | ||||
| (3.4618) | (4.9844) | |||||
| W·PO | 0.0039 | 0.0206 | ||||
| (0.3670) | (1.3176) | |||||
| W·b | 0.0187** | 0.0597*** | ||||
| (2.1489) | (3.8290) | |||||
| W·m | 0.0030 | 0.0102 | ||||
| (0.4875) | (1.0820) | |||||
| W·dep.var | 0.1466*** | 0.2835*** | 0.0917** | 0.1297* | ||
| (4.2495) | (5.4900) | (2.0138) | (1.7732) | |||
| R2 | 0.8009 | 0.8434 | 0.8730 | 0.8395 | 0.8710 | |
| LOG-L | 18.0275 | 78.6815 | 128.8961 | 73.2753 | 129.4951 | |
注:***、**、*分别表示在1%、5%与10%的显著性水平下显著;Log-L为对数似然值。 |
| [1] |
蔡昉. 人口转变、人口红利及经济增长的持续性——兼论充分就业如何促进经济增长[J]. 人口研究, 2004(2):2-9.
|
| [2] |
|
| [3] |
|
| [4] |
|
| [5] |
|
| [6] |
|
| [7] |
|
| [8] |
|
| [9] |
|
| [10] |
|
| [11] |
|
| [12] |
|
| [13] |
蒋云赟. 我国人口结构变动对国民储蓄的影响的代际分析[J]. 经济科学, 2009(1):30-38.
|
| [14] |
王颖, 倪超. OECD国家人口转变与经济增长关系研究[J]. 中国人口·资源与环境, 2013(5):106-112.
|
| [15] |
刘凯豪, 刘渝琳. 破解中国经济增长之谜——来自人口结构变化的解释[J]. 经济科学, 2013(3):5-21.
|
| [16] |
于婷婷, 宋玉祥, 浩飞龙, 等. 东北地区人口结构对经济增长的影响[J]. 经济地理, 2016, 36(10):26-32.
|
| [17] |
于庆国. 吉林省人口年龄结构与经济关系实证分析[J]. 产业与科技论坛, 2017, 16(13):113-115.
|
| [18] |
沈体雁, 冯田, 孙铁山., 空间计量经济学[M]. 北京: 北京大学出版社, 2010.
|
| [19] |
武剑, 杨爱婷. 基于ESDA和CSDA的京津冀区域经济空间结构实证分析[J]. 中国软科学, 2010(3):111-119.
|
| [20] |
国家统计局. 人口[EB/OL]. 2013-10-29.
|
/
| 〈 |
|
〉 |