
山东省污染密集型产业时空演变特征及影响机理
|
王亚平(1985—),女,山东青岛人,博士研究生。主要研究方向为区域可持续发展。E-mail:422758824@qq.com。 |
收稿日期: 2018-01-17
修回日期: 2018-06-20
网络出版日期: 2025-04-25
基金资助
国家自然科学基金项目(41871121)
国家自然科学基金项目(41501124)
山东省自然科学基金项目(ZR2015DQ008)
中国博士后基金面上项目(40411592)
山东省高等学校科技计划项目(J15LH07)
Spatio-Temporal Evolution and Influencing Mechanism of Pollution-Intensive Industriesin in Shandong Province
Received date: 2018-01-17
Revised date: 2018-06-20
Online published: 2025-04-25
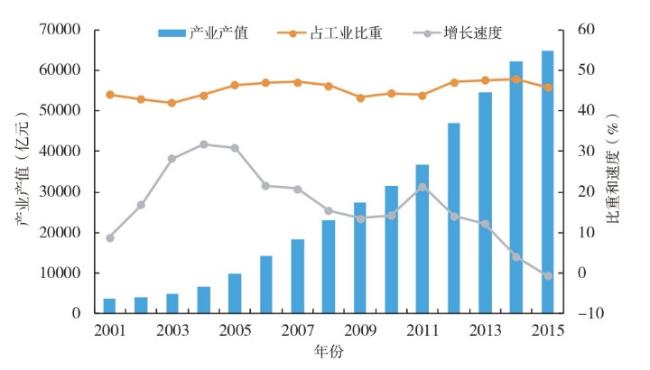
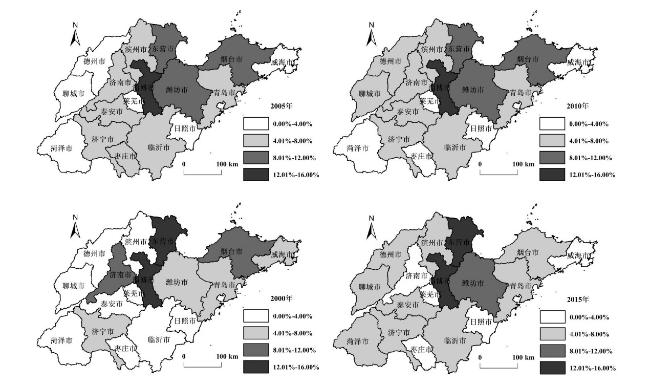
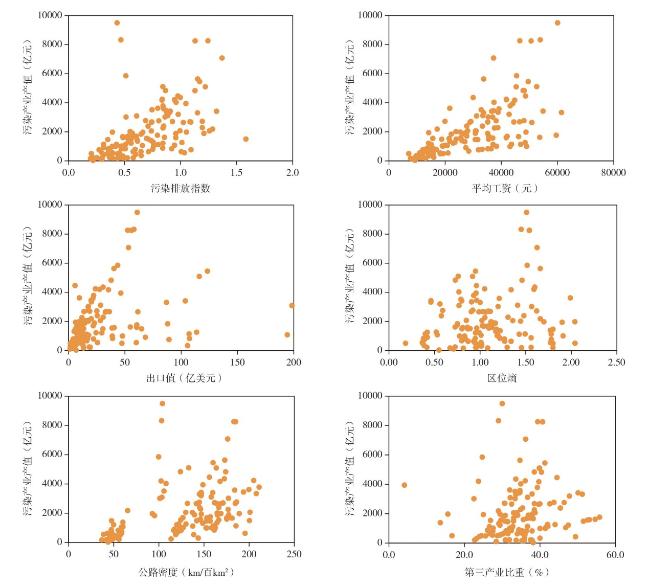
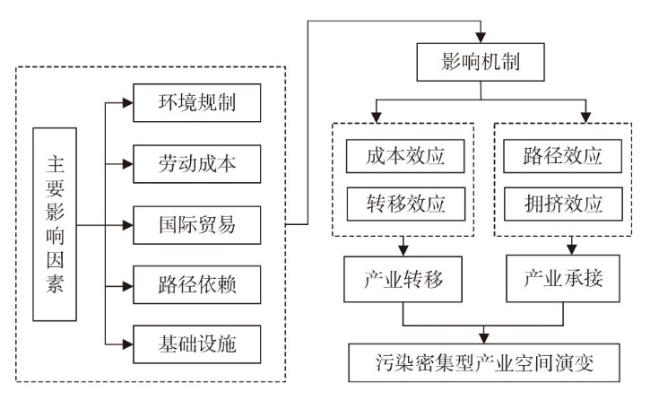
文章运用偏离—份额分析、基尼系数、区位熵以及面板回归模型探索山东省污染密集型产业时空格局演变特征及驱动机理,得出以下结论:①2000—2015年,污染密集型产业产值占山东省工业总产值的比重为42.06%~47.85%,发展趋势整体呈“S型”增长曲线,增长速度呈先上升后波动下降的趋势,其中有色金属冶炼和压延加工业、医药制造业、化学原料和化学制品制造业等行业增长幅度最大。②近15年来,山东省污染密集型产业的基尼系数呈先上升后下降的“倒U型”曲线,产业呈先集聚后扩散的态势,产业细分行业的集聚和扩散态势呈现出明显的行业差异。山东省省会济南市以及东部经济发达地区的污染密集型产业产值占工业总产值比重呈逐年下降趋势,西部和南部的德州、聊城、滨州、菏泽和临沂等经济欠发达地区污染密集型产业产值占工业总产值比重呈逐年上升趋势,省域内部存在污染密集型产业转移现象。③环境规制、劳动成本、国际贸易、路径依赖和基础设施等是山东省污染密集型产业空间演变的影响因素。
王亚平 , 曹欣欣 , 程钰 , 任建兰 . 山东省污染密集型产业时空演变特征及影响机理[J]. 经济地理, 2019 , 39(1) : 130 -139 . DOI: 10.15957/j.cnki.jjdl.2019.01.016
The spatial evolution of the pollution-intensive industries has become an important factor affecting the sustainable development of the region. Scientific analysis of the spatial evolution and influencing mechanism of the pollution-intensive industries is of great significance for adjusting the overall layout of the pollution-intensive industries and promoting the sustainable development of the region. The study explored the spatial-temporal evolution characteristics and driving mechanism of pollution-intensive industries in Shandong Province using shift-share analysis, Gini coefficient, location quotient and panel regression model. The conclusions are as follows: (1) From 2000 to 2015, the pollution-intensive industries accounted for 42.06%-47.85% of the industrial output value of Shandong Province and its development overall presented the trend of S-shaped growth curve. The growth rate increased firstly and then decreased.The higher growth rate industries are the non-ferrous metal smelting and rolling processing industry, pharmaceutical industry, chemical raw materials and chemical products manufacturing industry; (2) In the past 15 years, the Gini coefficient of pollution-intensive industries in Shandong Province showed an inverted "U" curve which firstly increased and then decreased, indicating that the industries showed the trend that is firstly clustered and then diffused and it had a significant difference among the subdivision industries. The proportion of the pollution-intensive industries in the industrial output value had been declining year by year in Jinan City and the economically developed areas of eastern Shandong Province. In contrast, it rose year by year in in less developed areas of the western and southern Shandong Province, such as Dezhou, Liaocheng, Binzhou, Heze and Linyi, it showed the phenomenon of the transfer of polluting industries; (3) Environmental regulation, labor cost, international trade, path dependence and infrastructure are the factors that influence the spatial evolution of pollution-intensive industries in Shandong Province.
表1 山东省污染密集型产业分类Tab.1 The classification of pollution-intensive industries in Shandong Province |
| 行业 | 污染综合指数 |
|---|---|
| 采掘业 | 0.322 |
| 黑色金属冶炼及压延加工业 | 0.319 |
| 化学原料及化学制品制造业 | 0.302 |
| 非金属矿物制品业 | 0.255 |
| 造纸及纸制品业 | 0.224 |
| 纺织业 | 0.192 |
| 化学纤维制造业 | 0.112 |
| 有色金属冶炼及压延加工业 | 0.080 |
| 医药制造业 | 0.072 |
| 石油加工、炼焦及核燃料加工业 | 0.071 |
表2 山东省污染密集型产业偏离份额分析/亿元Tab.2 Shift-share analysis of thepollution-intensive industries in Shandong Province/100 million yuan |
| 行业 | bio | Bit | Ni | Pi | Di | Gi |
|---|---|---|---|---|---|---|
| 采掘业 | 807.08 | 4 730.90 | 5 033.11 | 2 630.81 | -3 740.09 | 3 923.82 |
| 纺织业 | 642.80 | 9 019.03 | 3 741.69 | 958.77 | 3 675.78 | 8 376.23 |
| 造纸和纸制品业 | 239.42 | 2 554.87 | 1 323.15 | 658.24 | 334.06 | 2 315.45 |
| 石油加工、炼焦和核燃料加工业 | 468.85 | 7 179.75 | 3 194.63 | -114.12 | 3 630.40 | 6 710.91 |
| 化学原料和化学制品制造业 | 493.64 | 17 032.43 | 8 311.94 | -1 197.68 | 9 424.53 | 16 538.79 |
| 医药制造业 | 101.46 | 4 266.59 | 2 563.71 | -1 061.22 | 2 662.65 | 4 165.14 |
| 化学纤维制造业 | 114.25 | 262.95 | 639.64 | -63.63 | -427.31 | 148.69 |
| 非金属矿物制品业 | 455.53 | 8 065.64 | 5 904.86 | 1 612.02 | 93.23 | 7 610.10 |
| 黑色金属冶炼和压延加工业 | 226.23 | 4 655.08 | 6 181.56 | -3 491.39 | 1 738.68 | 4 428.85 |
| 有色金属冶炼和压延加工业 | 115.02 | 6 680.49 | 5 241.83 | -2 526.61 | 3 850.25 | 6 565.47 |
表3 2000—2015年山东省污染密集型产业基尼系数Tab.3 The Gini coefficient of the pollution-intensive industries in Shandong Province |
| 地区 | 2000 | 2002 | 2004 | 2006 | 2008 | 2010 | 2012 | 2015 |
|---|---|---|---|---|---|---|---|---|
| 山东省 | 0.3893 | 0.4050 | 0.5038 | 0.3179 | 0.3140 | 0.2982 | 0.3311 | 0.2833 |
表4 2000—2015年山东省不同污染密集型行业基尼系数Tab.4 The Gini coefficient of different pollution-intensive industries in Shandong Province |
| 行业 | 2000 | 2005 | 2010 | 2015 |
|---|---|---|---|---|
| 采掘业 | 0.7655 | 0.6765 | 0.6002 | 0.6274 |
| 纺织业 | 0.3839 | 0.4218 | 0.4303 | 0.5154 |
| 造纸和纸制品业 | 0.3758 | 0.4090 | 0.4130 | 0.4339 |
| 石油加工、炼焦和核燃料加工业 | 0.7544 | 0.6562 | 0.6008 | 0.6656 |
| 化学原料和化学制品制造业 | 0.3928 | 0.4376 | 0.4600 | 0.4659 |
| 医药制造业 | 0.5804 | 0.4023 | 0.3956 | 0.4436 |
| 化学纤维制造业 | 0.6615 | 0.8013 | 0.7042 | 0.5384 |
| 非金属矿物制品业 | 0.5147 | 0.5137 | 0.4029 | 0.3957 |
| 黑色金属冶炼和压延加工业 | 0.7184 | 0.5583 | 0.5219 | 0.4405 |
| 有色金属冶炼和压延加工业 | 0.7630 | 0.6839 | 0.7035 | 0.6479 |
表5 山东省各地市污染密集型产业区位熵与占总污染密集型产业比重Tab.5 The location entropy and proportion of different pollution-intensive industries ineach city of Shandong Province |
| 地区 | 区位熵 | 变化值 | 比重值/% | 变化值/% | ||||||
|---|---|---|---|---|---|---|---|---|---|---|
| 2000 | 2005 | 2010 | 2015 | 2000 | 2005 | 2010 | 2015 | |||
| 济南市 | 1.06 | 1.01 | 0.81 | 0.75 | -0.31 | 8.67 | 7.38 | 4.27 | 2.72 | -5.95 |
| 青岛市 | 0.39 | 0.53 | 0.59 | 0.46 | 0.07 | 6.57 | 7.55 | 7.49 | 5.13 | -1.43 |
| 淄博市 | 1.41 | 1.66 | 1.66 | 1.54 | 0.13 | 13.75 | 15.26 | 15.30 | 12.73 | -1.02 |
| 枣庄市 | 1.29 | 1.34 | 1.18 | 1.04 | -0.25 | 3.55 | 4.43 | 3.98 | 2.57 | -0.97 |
| 东营市 | 2.09 | 1.77 | 1.59 | 1.51 | -0.58 | 14.37 | 9.70 | 11.43 | 14.65 | 0.28 |
| 烟台市 | 0.89 | 0.80 | 0.79 | 0.76 | -0.13 | 10.88 | 10.40 | 9.56 | 7.88 | -3.01 |
| 潍坊市 | 0.95 | 0.95 | 1.00 | 0.95 | 0.00 | 7.90 | 8.49 | 8.98 | 8.41 | 0.52 |
| 济宁市 | 1.34 | 1.22 | 1.12 | 1.06 | -0.28 | 6.07 | 5.83 | 5.14 | 4.07 | -2.00 |
| 泰安市 | 1.09 | 1.27 | 1.15 | 0.92 | -0.17 | 3.29 | 4.45 | 5.16 | 4.27 | 0.99 |
| 威海市 | 0.44 | 0.37 | 0.39 | 0.42 | -0.02 | 5.17 | 3.50 | 2.06 | 1.94 | -3.22 |
| 日照市 | 0.62 | 0.67 | 0.84 | 0.83 | 0.21 | 0.73 | 1.21 | 2.16 | 1.54 | 0.81 |
| 莱芜市 | 1.82 | 1.80 | 1.91 | 2.04 | 0.22 | 2.69 | 3.41 | 2.73 | 1.78 | -0.91 |
| 临沂市 | 0.77 | 0.93 | 1.02 | 0.96 | 0.19 | 3.05 | 4.44 | 5.60 | 6.89 | 3.83 |
| 德州市 | 1.02 | 1.01 | 0.89 | 0.93 | -0.09 | 2.93 | 3.90 | 4.08 | 5.84 | 2.91 |
| 聊城市 | 0.70 | 0.96 | 1.12 | 1.05 | 0.35 | 2.03 | 3.19 | 5.38 | 6.54 | 4.51 |
| 滨州市 | 1.41 | 1.56 | 1.48 | 1.46 | 0.05 | 3.65 | 6.12 | 6.51 | 7.45 | 3.81 |
| 菏泽市 | 1.05 | 0.96 | 1.22 | 1.21 | 0.16 | 1.03 | 1.46 | 3.69 | 5.52 | 4.49 |
表6 山东省17地市污染密集型产业偏离—份额分析Tab.6 Shift-share analysis on pollution-intensive industries in 17 cities of Shandong Province |
| 城市 | bio | Bit | Ni | Pi | Di | Gi | 城市 | bio | Bit | Ni | Pi | Di | Gi | |
|---|---|---|---|---|---|---|---|---|---|---|---|---|---|---|
| 济南 | 317.55 | 1 763.84 | 5 587.57 | 1 934.76 | -4 141.28 | 3 381.05 | 威海 | 189.36 | 1 260.33 | 3 331.99 | -320.82 | -2 261.03 | 750.14 | |
| 青岛 | 240.70 | 3 328.75 | 4 235.41 | 582.59 | -1 147.36 | 3 670.64 | 日照 | 26.85 | 998.68 | 472.40 | -3 180.41 | 499.43 | -2 208.58 | |
| 淄博 | 503.68 | 8 253.09 | 8 862.77 | 5 209.95 | -1 113.36 | 12 959.36 | 莱芜 | 98.46 | 1 977.88 | 1 732.54 | -1 920.27 | 146.87 | -40.86 | |
| 枣庄 | 129.91 | 1 669.04 | 2 285.90 | -1 366.91 | -746.77 | 172.22 | 临沂 | 111.85 | 4 464.40 | 1 968.16 | -1 684.65 | 2 384.39 | 2 667.90 | |
| 东营 | 526.48 | 9 497.14 | 9 264.03 | 5 611.22 | -293.38 | 14 581.87 | 德州 | 107.36 | 3 786.52 | 1 889.04 | -1 763.77 | 1 790.12 | 1 915.39 | |
| 烟台 | 398.81 | 5 107.91 | 7 017.39 | 3 364.58 | -2 308.29 | 8 073.68 | 聊城 | 74.37 | 4 239.73 | 1 308.70 | -2 344.12 | 2 856.66 | 1 821.24 | |
| 潍坊 | 289.33 | 5 454.73 | 5 091.04 | 1 438.23 | 74.36 | 6 603.63 | 滨州 | 133.60 | 4 831.82 | 2 350.89 | -1 301.92 | 2 347.33 | 3 396.30 | |
| 济宁 | 222.59 | 2 642.05 | 3 916.72 | 263.91 | -1 497.26 | 2 683.37 | 菏泽 | 37.79 | 3 580.12 | 664.91 | -2 987.90 | 2 877.42 | 554.43 | |
| 泰安 | 120.39 | 2 770.88 | 2 118.36 | -1 534.45 | 532.13 | 1 116.04 |
表7 选取指标说明Tab.7 Instruction on selected indicators |
| 影响因素 | 指标 | 符号 | 作用方向 | 说明 |
|---|---|---|---|---|
| 污染密集型产业 | 污染密集型产业产值 | Y | 产业产值能够最直接体现污染密集型产业在空间上的增长演变特征,能够较好地分析污染密集型产业空间演变机理 | |
| 环境规制 | 污染排放指数 | X1 | + | 污染物排放指数低说明地区环境规制较强,高强度的环境规制会提高污染密集型产业发展成本,抑制污染密集型产业发展 |
| 劳动成本 | 平均工资水平 | X2 | +/- | 劳动收益与成本变化对劳动力集聚的影响 |
| 国际贸易 | 海关出口值 | X3 | + | 反映国际贸易对污染密集型产业空间演变的影响 |
| 路径依赖 | 污染密集型产业区位熵 | X4 | + | 通过污染密集型产业在某地的集聚程度来反映地区的路径依赖 |
| 基础设施 | 公路密度 | X5 | + | 地区基础设施的完善程度是否会引起污染密集型产业的集聚 |
| 产业结构 | 第三产业比重 | X6 | - | 反映地区产业结构层次和水平,探索较高的第三产业是否会抑制污染密集型产业的发展 |
表8 固定效应模型分析结果Tab.8 The results of estimate based on fixed effects model |
| 解释变量 | 参数估计值 | t统计量 |
|---|---|---|
| lnX1 | 0.2578**(0.1016) | 2.54 |
| lnX2 | 0.9333***(0.1375) | 6.79 |
| lnX3 | 0.4251***(0.0784) | 5.42 |
| lnX4 | 1.3156***(0.1416) | 9.29 |
| lnX5 | 0.1751**(0.9667) | 1.81 |
| lnX6 | -0.1531(0.2578) | -0.51 |
| Adj R2 | 0.9333 | |
| F | 9.99 |
注:***、**、*分别表示在1%、5%、10%的水平下显著。 |
| [1] |
樊杰, 周侃, 陈东. 生态文明建设中优化国土开发格局的经济地理学研究创新与应用实践[J]. 经济地理, 2013, 33(1):1-8.
|
| [2] |
刘纪元, 邓祥征, 刘卫东. 中国西部绿色发展概念框架[J]. 中国人口·资源与环境, 2013, 23(10):1-7.
|
| [3] |
|
| [4] |
石敏俊, 逄瑞, 郑丹, 等. 中国制造业产业结构演进的区域分异与环境效应[J]. 经济地理, 2017, 39(10):108-115.
|
| [5] |
李燕, 贺灿飞, 朱彦刚. 我国劳动密集型产业地理分布研究[J]. 地理与地理信息科学, 2010, 26(1):66-72.
|
| [6] |
龚建建, 沈可挺. 中国高耗能产业及环境污染区域分布[J]. 数量经济技术经济研究, 2011, 28(2):20-36.
|
| [7] |
桂黄宝. 我国高技术产业创新效率及其影响因素空间计量分析[J]. 经济地理, 2014, 34(6):100-107.
|
| [8] |
刘鹗. 石化产业空间组织的演进机理与模式[M]. 北京: 科学出版社, 2013.
|
| [9] |
贺灿飞, 朱彦刚. 中国资源密集型产业地理分布研究——以石油加工业和黑色金属产业为例[J]. 自然资源学报, 2010, 25(3):487-500.
|
| [10] |
程晓娟, 韩庆兰, 金春光. 基于PCA-DEA组合模型的中国煤炭产业生态效率研究[J]. 资源科学, 2013, 35(6):1292-1 299.
|
| [11] |
贺灿飞, 潘峰华. 中国制造业地理集聚的成因与趋势[J]. 南方经济, 2011, 29(6):38-52.
|
| [12] |
毛梁琦, 董锁成, 王菲, 等. 中国省区间制造业空间格局演变[J]. 地理学报, 2013, 68(4):435-448.
|
| [13] |
王俊松. 长三角制造业空间格局演化及影响因素[J]. 地理研究, 2014, 33(12):2312-2 324.
|
| [14] |
|
| [15] |
|
| [16] |
|
| [17] |
李斌, 彭星. 环境规制工具的空间异质效应研究——基于政府职能视角的空间计量分析[J]. 产业经济研究, 2013, 12(6):38-46.
|
| [18] |
|
| [19] |
赵细康. 环境保护与产业国际竞争力——理论与实证分析[M]. 北京: 中国社会科学出版社,2003:26-32.
|
| [20] |
|
| [21] |
|
| [22] |
沈静, 魏成. 环境管制影响下的佛山陶瓷产业区位变动机制[J]. 地理学报, 2012, 67(4):467-478.
|
| [23] |
周沂, 贺灿飞, 刘颖. 中国污染密集型产业地理分布研究[J]. 自然资源学报, 2015, 30(7):1183-1 196.
|
| [24] |
崔建鑫, 赵海霞. 长江三角洲地区污染密集型产业转移及驱动机理[J]. 地理研究, 2015, 34(3):504-512.
|
| [25] |
何龙斌. 国内污染密集型产业区际转移路径及引申——基于2000—2011年相关工业产品产量面板数据[J]. 经济学家, 2013, 33(6):78-86.
|
| [26] |
李长青, 姚萍, 童文丽. 中国污染密集型产业的技术创新能力[J]. 中国人口·资源与环境, 2014, 24(4):149-156.
|
| [27] |
李祥云, 白永平, 周鹏, 等. 中国省域污染密集型产业转移与驱动机理——基于2004—2014年的面板数据[J]. 资源开发与市场, 2016, 32(11):1286-1 290,1 333.
|
| [28] |
邹辉, 段学军, 赵海霞, 等. 长三角地区污染密集型产业空间演变及其对污染排放格局的影响[J]. 中国科学院大学学报, 2016, 33(5):703-710.
|
| [29] |
侯伟丽, 方浪, 刘硕. “污染避难所”在中国是否存在?——环境管制与污染密集型产业区际转移的实证研究[J]. 经济评论, 2013, 34(4):65-71.
|
| [30] |
彭文斌, 陈蓓, 吴伟平, 等. 污染密集型产业区位选择的影响因素研究——基于我国八大区域的面板数据[J]. 经济经纬, 2014, 31(5):8-12.
|
| [31] |
李斌, 彭星. 环境规制工具的空间异质效应研究——基于政府职能视角的空间计量分析[J]. 产业经济研究, 2013, 12(6):38-46.
|
| [32] |
刘巧玲, 王奇, 李鹏. 我国污染密集型产业及其区域分布变化趋势[J]. 生态经济, 2011, 27(1):107-111.
|
| [33] |
|
| [34] |
沈静, 向澄, 柳意云. 广东省污染密集型产业转移机制[J]. 地理研究, 2012, 31(2):357-368.
|
| [35] |
梁红岩, 王静, 秦志琴, 等. 中国污染密集型产业转移及其影响因素研究[J]. 生态经济, 2016, 32(10):32-35,45.
|
| [36] |
仇方道, 蒋涛, 张纯敏, 等. 江苏省污染密集型产业空间转移及影响因素[J]. 地理科学, 2013, 33(7):699-796.
|
| [37] |
贺灿飞, 谢秀珍, 潘峰华. 中国制造业省区分布及其影响因素[J]. 地理研究, 2008, 27(3):623-635.
|
/
| 〈 |
|
〉 |