
成渝城市群近40年城市规模分布演变——基于K-S检验的滚动样本回归
|
韩剑萍(1973—),男,甘肃静宁人,硕士,副教授。主要研究方向为城市和区域可持续性。E-mail:hjp2001@163.com。 |
收稿日期: 2018-11-27
修回日期: 2019-04-09
网络出版日期: 2025-04-24
基金资助
国家自然科学基金创新团队项目(41621061)
四川县域经济发展研究中心项目(XY2017047)
Evolution of City Size Distribution in Chengdu-Chongqing Urban Agglomeration over the Last 40 Years: A Kolmogorov-Smirnov Test-Based Rolling Sample Regression Approach
Received date: 2018-11-27
Revised date: 2019-04-09
Online published: 2025-04-24
韩剑萍 , 苟思远 , 黄庆旭 , 何春阳 , 朱磊 . 成渝城市群近40年城市规模分布演变——基于K-S检验的滚动样本回归[J]. 经济地理, 2019 , 39(8) : 59 -67 . DOI: 10.15957/j.cnki.jjdl.2019.08.008
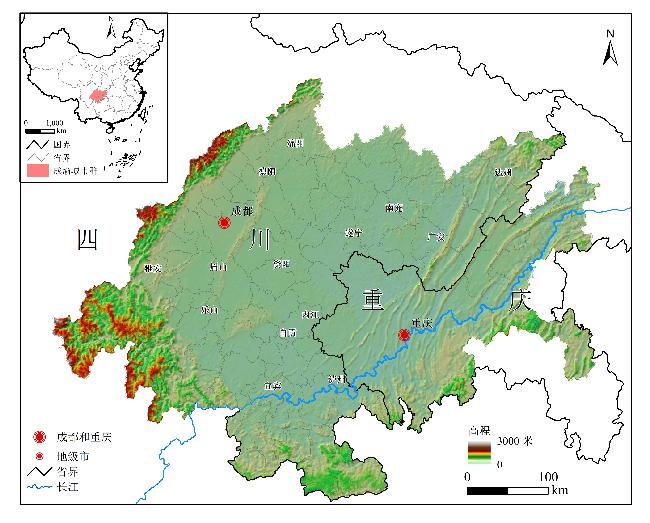
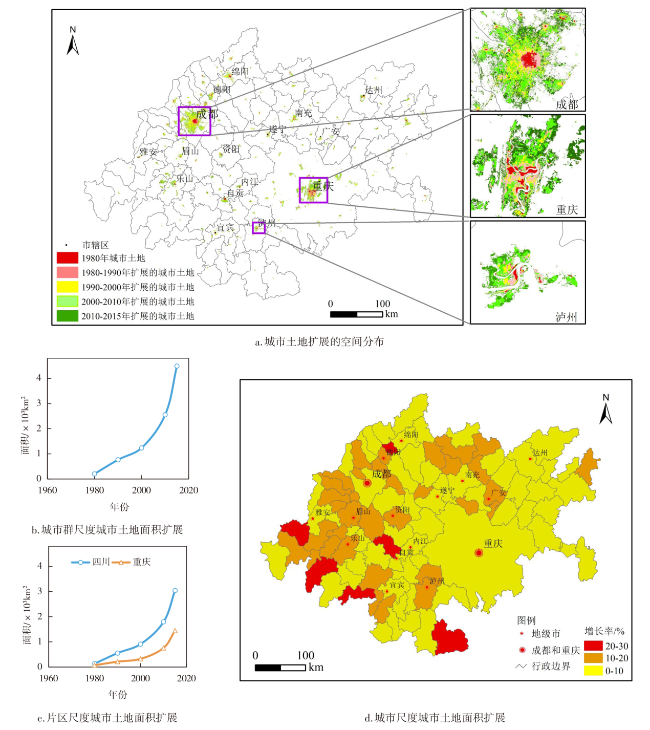
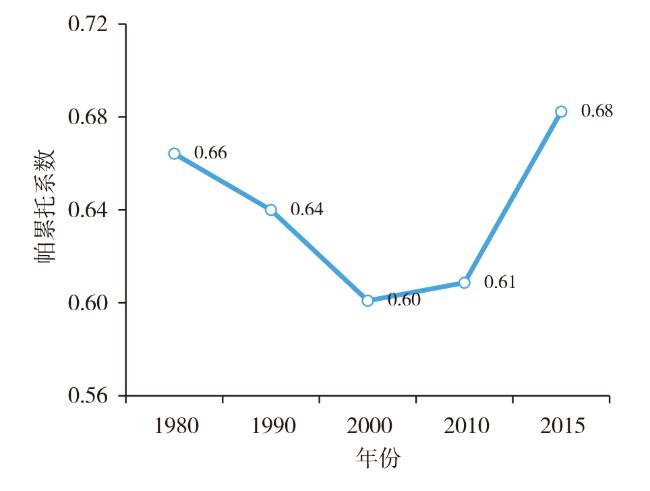
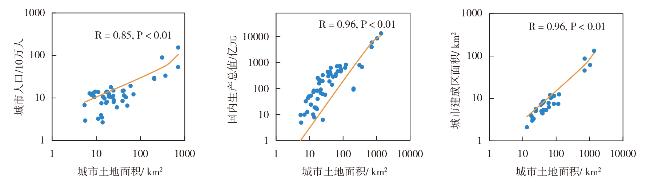
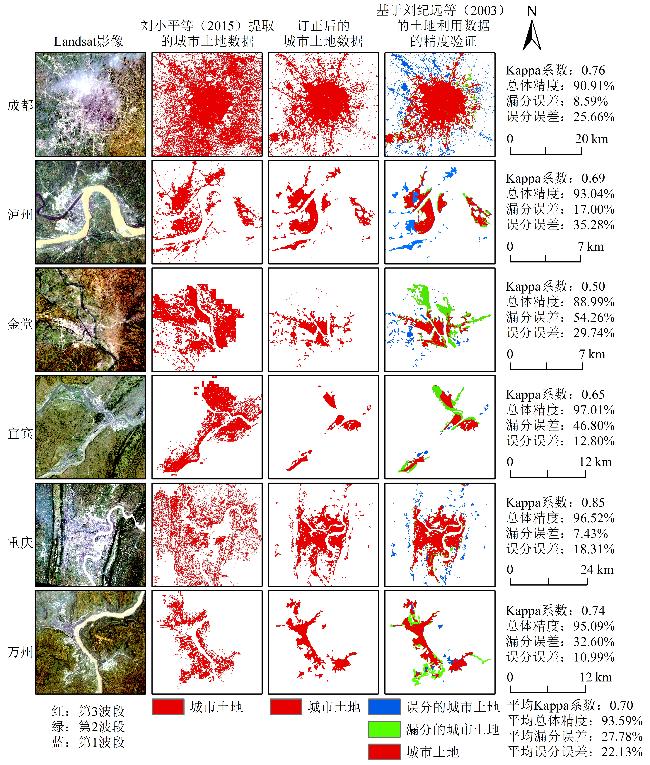
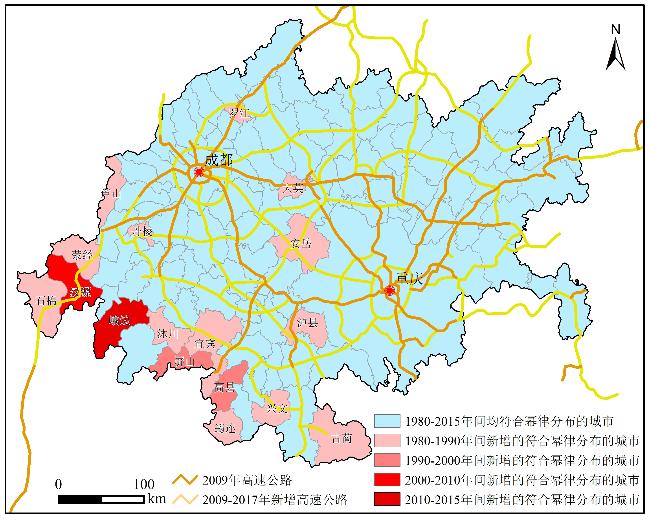
Accurately quantifying the city size distribution is an important basis for urban planning and management. However, the city size distribution of Chengdu-Chongqing urban agglomeration over the last 40 years is not clear. This is because the long-term urban population data are incomparable, and the selection of city samples is subjective. Therefore, we investigated the urban expansion in Chengdu-Chongqing urban agglomeration based on calibrating the urban land data during the past 40 years. We further analyzed the dynamics of the city size distribution using a Kolmogorov-Smirnov (K-S) test-based rolling sample regression method. The results show that Chengdu-Chongqing urban agglomeration experienced rapid urban expansion between 1980 and 2015, with urban land increasing from 203 km2 to 4 491 km2, approximately a 21-fold growth with an average annual growth rate of 9.25%. The city size distribution in Chengdu-Chongqing urban agglomeration was uneven during this period, with the Pareto coefficients smaller than 1. Over time, the evolution of this city size distribution changed from an unevenly distributed trend to a more evenly distributed trend, as the Pareto coefficients decreased from 0.66 in 1980 to 0.60 in 2000 and then increased to 0.68 in 2015. We suggest that the radiating ability of Chengdu and Chongqing would be strengthened by constructing a transportation network, to promote the development of the small and middle-sized cities and develop a hierarchical urban system with a complete and coordinated structure.
表1 成渝城市群1980—2015年城市规模分布Tab.1 The city size distribution in Chengdu-Chongqing urban agglomeration from 1980 to 2015 |
| 年份 | 位序—规模回归方程 | P值 | 符合幂律分布的 最小规模城市面积/km2 | 符合幂律分布的 城市数量 | 符合幂律分布的 城市样本占城市数量百分比/% |
|---|---|---|---|---|---|
| 1980 | lnR=3.21-0.66lnS | 0.09 | 0.03 | 76 | 96.20 |
| 1990 | lnR=4.12-0.64lnS | 0.37 | 0.07 | 89 | 98.89 |
| 2000 | lnR=4.34-0.60lnS | 0.07 | 0.04 | 91 | 98.91 |
| 2010 | lnR=4.78-0.61lnS | 0.08 | 0.04 | 92 | 98.92 |
| 2015 | lnR=5.37-0.68lnS | 0.11 | 0.84 | 93 | 100.00 |
注:P值表示显著性,大于0.05表示通过K-S检验。 |
表2 成渝城市群符合幂律分布的城市样本分片区对比Tab.2 The city samples conformed to power-law distribution in Chengdu-Chongqing urban agglomeration |
| 成渝城市群 | 1980 | 1990 | 2000 | 2010 | 2015 | |||||||||
|---|---|---|---|---|---|---|---|---|---|---|---|---|---|---|
| 城市数量 | 占比*/% | 城市数量 | 占比*/% | 城市数量 | 占比*/% | 城市数量 | 占比*/% | 城市数量 | 占比*/% | |||||
| 四川片区 | 69 | 90.79 | 82 | 92.13 | 84 | 92.31 | 85 | 92.39 | 86 | 92.47 | ||||
| 重庆片区 | 7 | 9.21 | 7 | 7.87 | 7 | 7.69 | 7 | 7.61 | 7 | 7.53 | ||||
注:占比指的是各个时期四川片区和重庆片区符合幂律分布的城市占整个城市群符合幂律分布的城市总量的百分比。 |
表3 影响成渝城市群城市规模分布的部分政府政策Tab.3 Government policies affecting the city size distribution in Chengdu-Chongqing urban agglomeration |
| 年份 | 政策名称 | 相关政策及影响 |
|---|---|---|
| 1980—2000 | 东部优先发展战略 | 改革开放初期,我国实施了东部优先发展战略,中央在政策上主要向东部沿海地区倾斜。这些倾斜性、非均衡的东部优先发展政策,带动了东部沿海城市规模的快速扩张。 |
| 经济特区政策 | 1980年8月,我国正式在广东省的深圳、珠海、汕头和福建省厦门建立经济特区。这些政策带动了全国性的生产要素向这些特区流动。 | |
| 沿海开放城市政策 | 1984年5月,中共中央和国务院决定设立首批沿海开放城市,进一步开放天津、上海、大连、秦皇岛、烟台、青岛、连云港、南通、宁波、温州、福州、广州、湛江和北海14个沿海港口城市与营口市(1985)、威海市(1988),统称为首批沿海开放城市。 | |
| 2000—2015 | 《四川省国民经济和社会发展第十个五年计划纲要》 | 提升特大城市现代化建设水平,加快培育发展大城市,积极发展中小城市,大力发展小城镇。 |
| 国家“十五”到“十二五”规划纲要 | 积极稳妥地推进城镇化,逐步改变城乡二元结构。逐步形成辐射作用大的城市群,促进大中小城市和小城镇协调发展。 | |
| 2015—2030 | 《国家新型城镇化规划(2014—2020)》 | 把加快发展中小城市作为优化城镇规模结构的主攻方向。 |
| 《成渝经济区区域规划》 | 坚持城镇化发展战略……城镇化水平大幅提高,初步形成城乡协调发展格局。 | |
| 《成都市城市总体规划(2011—2020)》 | 规划形成1个中心城市、14个新城、34个重点镇、约150个一般镇、约2 000~3 000个农村新型社区构成的全域统筹、城乡一体、协调发展的城镇村体系。 | |
| 《重庆市城乡总体规划(2007—2020)》(2011年修订) | 至规划期末,形成1个特大城市、6个大城市、25个中等城市和小城市、495个左右小城镇的城镇体系。 | |
| 《成渝城市群发展规划》 | 优化城市规模结构。做强区域中心城市,建设重要节点城市,培育发展一批小城市,有重点地发展小城镇。 |
| [1] |
|
| [2] |
|
| [3] |
许学强, 周一星, 宁越敏. 城市地理学(第2版)[M]. 北京: 高等教育出版社, 2009.
|
| [4] |
国家统计局城市社会经济调查总队. 中国城市统计年鉴2001[M]. 北京: 中国统计出版社, 2002.
|
| [5] |
国家统计局. 中国城市统计年鉴2016[M]. 北京: 中国统计出版社, 2016.
|
| [6] |
曹跃群, 刘培森. 成渝都市群城市体系规模分布的实证研究[J]. 西北人口, 2011, 32(1):95-98.
|
| [7] |
刘源, 刘培森. 成渝经济区城市规模分布实证研究[J]. 中国城市经济, 2011(20):12-14.
|
| [8] |
李小浩. 城市规模分布演化特征及空间协调性分析:以成渝城市群为例[J]. 城市学刊, 2017, 38(1):73-79.
|
| [9] |
钟海燕. 成渝经济区城市体系优化分析:基于位序规模模型[J]. 地域研究与开发, 2014, 33(3):60-63.
|
| [10] |
王振坡, 朱丹, 王丽艳. 成渝城市群城市规模分布及演进特征研究[J]. 西北人口, 2018, 39(1):8-14.
|
| [11] |
谈明洪, 吕昌河. 以建成区面积表征的中国城市规模分布[J]. 地理学报, 2003, 58(2):285-293.
|
| [12] |
|
| [13] |
|
| [14] |
苟思远. 全球近三十年城市扩展过程研究[D]. 北京: 北京师范大学, 2019.
|
| [15] |
国家发改委, 住建部. 成渝城市群发展规划[EB/OL]. http://www.ndrc.gov.cn/zcfb/zcfbtz/201605/t20160504_800779.html2016-04-27/2018-10-15.
|
| [16] |
|
| [17] |
|
| [18] |
|
| [19] |
|
| [20] |
|
| [21] |
|
| [22] |
顾朝林, 于涛方, 李王鸣. 中国城市化:格局·过程·机理[M]. 北京: 科学出版社, 2008.
|
| [23] |
|
/
| 〈 |
|
〉 |