
中国城镇化与经济增长的耦合协调发展及影响因素
|
周亮(1983—),男,甘肃天水人,博士/博士后,副教授,硕士生导师。主要研究方向为城市地理、城市与区域可持续发展。E-mail:zhougeo@126.com。 |
收稿日期: 2018-08-04
修回日期: 2019-03-15
网络出版日期: 2025-04-24
基金资助
国家自然科学基金项目(41701173)
教育部人文社会科学研究青年基金项目(17YJCZH268)
中国博士后科学基金项目(2016M600121)
兰州交通大学百人计划项目
The Coupling Coordination Development between Urbanization and Economic Growth and Its Influencing Factors in China
Received date: 2018-08-04
Revised date: 2019-03-15
Online published: 2025-04-24
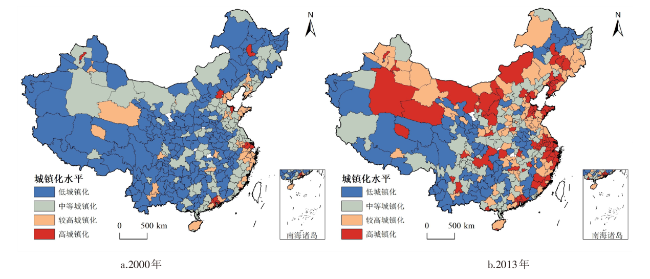
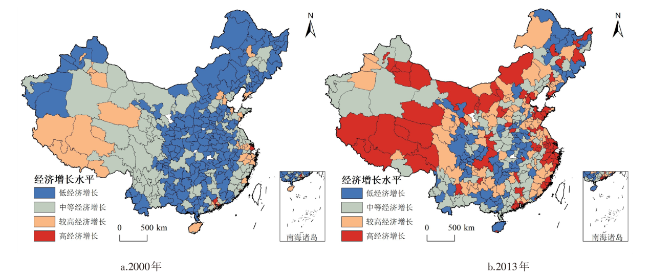
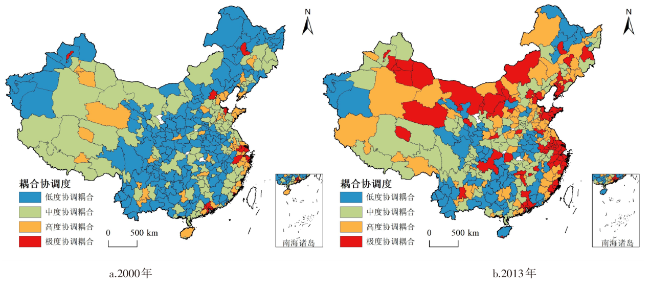
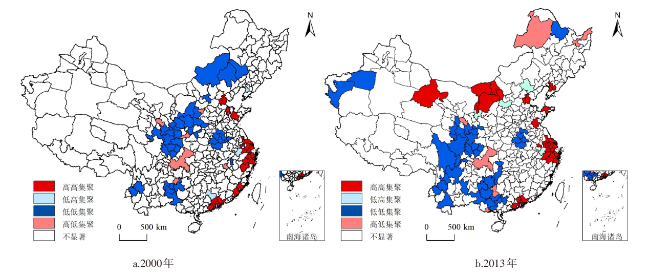
通过构建城镇化与经济增长综合评价指标体系,以中国336个地级及以上城市为研究对象,采用熵权—突变级数、耦合协调模型和空间自相关模型等方法,分析2000—2013年中国各地级及以上行政单元城镇化与经济增长的耦合协调关系,运用空间杜宾模型(SDM)对其影响因素进行剖析。研究结果表明:①2000—2013年中国城镇化、经济增长以及耦合协调程度均呈上升趋势,区域差异程度逐渐缩小,空间上“东—中—西”递减态势依旧。京津冀、长三角及珠三角的核心地位日益凸显,城镇化与经济增长协调发展存在明显的“集群化”与“梯度化”空间分异特征。②中国城镇化与经济增长耦合协调程度呈现出显著的空间关联与集聚效应,两者关联集聚程度有所减弱。城镇化与经济增长耦合协调程度的地理近邻性特征明显,高高集聚区汇聚于京津冀、长三角和珠三角城市群,鄂豫皖省际交接处等地区则是低低集聚区。③中国城镇化与经济增长耦合协调程度存在明显的空间正向溢出效应,城市人口规模、投资水平、消费能力、财政水平和产业集聚度具有较大促进作用,而城乡收入差距的扩大则会抑制其发展。
周亮 , 车磊 , 孙东琪 . 中国城镇化与经济增长的耦合协调发展及影响因素[J]. 经济地理, 2019 , 39(6) : 97 -107 . DOI: 10.15957/j.cnki.jjdl.2019.06.011
It has close relations between urbanization and economic growth. By constructing a comprehensive evaluation index system for urbanization and economic growth, this paper takes 336 prefecture-level and above cities in China as the study object, and adopts entropy weight-catastrophe progression method, coupling coordination model, spatial auto-correlation model and other methods to analyze the coupling and coordination relationship between urbanization and economic growth of prefecture-level and above cities in China from 2000 to 2013, and analyzes its influencing factors by using spatial Durbin model (SDM). The research results show that: 1) From 2000 to 2013, China's urbanization, economic growth and degree of coupling and coordination all show an upward trend, while the degree of regional differences become weak, and it shows a decreasing trend from the east to the west. The core status of Beijing-Tianjin-Hebei region, Yangtze river delta and pearl river delta is increasingly prominent, and there are obvious spatial differentiation characteristics of "clustering" and "gradient" in the coordinated development of urbanization and economic growth. 2) The degree of coupling and coordination between urbanization and economic growth in China presents significant spatial correlation and agglomeration effect. The coupling and coordination degree of urbanization and economic growth are characterized by obvious geographical proximity. The high agglomeration areas gather in the urban agglomerations of Beijing-Tianjin-Hebei region, the Yangtze River Delta and the Pearl River Delta, but the intersections of Hubei, Henan and Anhui provinces are low agglomeration areas. 3) There is a significant spatial positive spillover effect in the coupling and coordination degree between urbanization and economic growth in China. The size of urban population, investment level, consumption capacity, financial level and industrial agglomeration play a significant role in promoting the development of urbanization, while the urban-rural income gap will inhibit its development.
Key words: urbanization; economic growth; coupling coordination; spatial Durbin model; China
表1 突变级数的势函数、分叉集和归一公式Tab.1 The potential function, bifurcation set and normalization formula of catastrophe progression model |
| 突变类型 | 变量个数 | 势函数 | 分差函数 | 归一公式 |
|---|---|---|---|---|
| 折点突变 | 1 | F(x)=x3+ux | u1=-3x2 | Xu1=u11/2 |
| 尖点突变 | 2 | F(x)=x4+u1x2+u2x | u1=-6x2 | Xu1=u11/2 |
| u2=8x3 | Xu2=u11/3 | |||
| 燕尾突变 | 3 | F(x)=x5+u1x3+u2x2+u3x | u1=-6x2 | Xu1=u11/2 |
| u2=8x3 | Xu2=u11/3 | |||
| u3=-3x4 | Xu3=u11/4 | |||
| 蝴蝶突变 | 4 | F(x)=x6+u1x4+u2x3+u3x2+u4x | u1=-10x2 | Xu1=u11/2 |
| u2=20x3 | Xu2=u11/3 | |||
| u3=-15x4 | Xu3=u11/4 | |||
| u4=4x5 | Xu4=u41/5 |
表2 中国城镇化与经济增长协调发展评价指标体系Tab.2 The evaluation index system of urbanization and economic growth in China |
| 目标层 | 功能层 | 具体指标 | 权重 |
|---|---|---|---|
| 城镇化发展水平(U)0.604 | 人口城镇化(U1)0.540 | 非农人口比重(U11) | 0.096 |
| 城镇就业人口(U12) | 0.098 | ||
| 经济城镇化(U2)0.313 | 城镇家庭人均可支配收入(U21) | 0.098 | |
| 人均GDP(U22) | 0.095 | ||
| 土地城镇化(U3)0.319 | 人均道路面积(U23) | 0.102 | |
| 城市建成区面积(U31) | 0.102 | ||
| 商品房屋销售面积(U32) | 0.104 | ||
| 社会城镇化(U4)0.450 | 万人在校大学生数(U41) | 0.096 | |
| 万人医卫人员数(U42) | 0.108 | ||
| 民用汽车拥有量(U43) | 0.102 | ||
| 经济增长水平(E)0.763 | 经济规模(E1)0.453 | GDP(E11) | 0.205 |
| 经济结构(E2)0.514 | 第二产比重(E21) | 0.203 | |
| 第三产比重(E22) | 0.192 | ||
| 经济效益(E3)0.442 | 职工平均工资(E31) | 0.195 | |
| 人均财政收入(E32) | 0.205 |
表3 城镇化与经济增长的耦合协调类型划分Tab.3 Classification of the coupling coordination between urbanization and economic growth |
| 类型 | 数值 | 亚类型 | 子类型 | 耦合协同类型 |
|---|---|---|---|---|
| 协调发展 | 0.8<D≤1 | 高级协调 | U(a)-E(b)>0.1 | 高级协调—经济增长滞后 |
| E(b)-U(a)>0.1 | 高级协调—城镇化滞后 | |||
| 0<|U(a)-E(b)|<0.1 | 高级协调 | |||
| 转型发展 | 0.5<D≤0.8 | 基本协调 | U(a)-E(b)>0.1 | 基本协调—经济增长滞后 |
| E(b)-U(a)>0.1 | 基本协调—城镇化滞后 | |||
| 0<|U(a)-E(b)|<0.1 | 基本协调 | |||
| 不协调发展 | 0.3<D≤0.5 | 基本不协调 | U(a)-E(b)>0.1 | 基本不协调—经济增长受阻 |
| E(b)-U(a)>0.1 | 基本不协调—城镇化受阻 | |||
| 0<|U(a)-E(b)|<0.1 | 基本不协调 | |||
| 0≤D≤0.3 | 严重不协调 | U(a)-E(b)>0.1 | 严重不协调—经济增长受阻 | |
| E(b)-U(a)>0.1 | 严重不协调—城镇化受阻 | |||
| 0<|U(a)-E(b)|<0.1 | 严重不协调 |
表2 中国城镇化与经济增长协调度空间杜宾面板模型估计结果Tab.2 Estimate results of the coordination degree between urbanization and economic growth in China based on SDM |
| 变量 | 回归系数 | Z值 | 变量 | 滞后项系数 | Z值 |
|---|---|---|---|---|---|
| X1 | -0.1102*** | -5.33 | W lnx1 | 0.8647** | 2.82 |
| X2 | 0.0586*** | 3.61 | W lnx2 | -0.1627 | -0.43 |
| X3 | 0.0962*** | 13.05 | W lnx3 | -0.0212 | -0.15 |
| X4 | -0.0001 | -0.04 | W lnx4 | -0.0834** | -1.92 |
| X5 | 0.0766*** | 8.93 | W lnx5 | 0.4397** | 2.43 |
| X6 | 0.0537*** | 3.68 | W lnx6 | 0.1430 | 0.43 |
| ρ | 0.5387*** | 1.22 | Log-likelihood | 1 183.2795 | |
| σ2 | 0.0017*** | R2 | 0.9905 |
注:“***”、“**”、“*”分别表示在1%、5%、10%水平上显著。表3同。 |
表3 各解释变量对中国城镇化与经济增长协调度的效应Tab.3 The effect of explanatory variables to urbanization and economic growth in China |
| 变量 | 直接效应 | 间接效应 | |||
|---|---|---|---|---|---|
| 回归系数 | Z值 | 回归系数 | Z值 | ||
| X1 | -0.1133*** | -5.53 | 0.6692* | 1.04 | |
| X2 | -0.0591*** | -0.55 | -0.0548* | -0.44 | |
| X3 | 0.0965*** | 13.84 | -0.0555* | -0.51 | |
| X4 | 0.0001* | 0.02 | 0.0624* | 0.88 | |
| X5 | 0.0757*** | 9.06 | 0.2731** | 2.05 | |
| X6 | -0.0542*** | -3.68 | 0.1061* | 0.33 | |
| [1] |
|
| [2] |
|
| [3] |
张亮靓,孙斌栋. 极化还是均衡:重塑大国经济地理的战略选择——城市规模分布变化和影响因素的跨国分析[J]. 地理学报, 2017, 72(8):419-1431.
|
| [4] |
|
| [5] |
陆大道. 中速增长:中国经济的可持续发展[J]. 地理科学, 2015, 35(10):1207-1 219.
|
| [6] |
王晓玥, 李双成. 基于多维视角的“城市病”诊断分析及其风险预估研究进展与发展趋势[J]. 地理科学进展, 2017, 36(2):231-243.
|
| [7] |
周亮, 周成虎, 杨帆, 等. 2000—2011年中国PM2.5时空演化特征及驱动因素解析[J]. 地理学报, 2017, 72(11):2079-2 092.
|
| [8] |
陈明星. 城市化与经济发展关系的研究综述[J]. 城市发展研究, 2013, 20(8):16-23.
|
| [9] |
|
| [10] |
|
| [11] |
|
| [12] |
|
| [13] |
|
| [14] |
周一星, 孙则昕. 再论中国城市的职能分类[J]. 地理研究, 1997, 16(1):11-22.
|
| [15] |
|
| [16] |
|
| [17] |
|
| [18] |
|
| [19] |
|
| [20] |
|
| [21] |
李鹏, 濮励杰. 发达地区建设用地扩张与经济发展相关关系的探究——基于与全国平均水平的比较[J]. 自然资源学报, 2012, 27(11):1823-1 832.
|
| [22] |
赵可, 徐唐奇, 张安录. 城市用地扩张、规模经济与经济增长质量[J]. 自然资源学报, 2016, 31(3):390-401.
|
| [23] |
|
| [24] |
王德利, 王岩. 中国城市群经济增长方式识别及分异特征[J]. 经济地理, 2017, 37(9):80-86.
|
| [25] |
李克强. 协调推进城镇化是实现现代化的重大战略选择[J]. 中国报道, 2013(3):4-10.
|
| [26] |
谭善勇. 中国城市化的经济增长效应研究[D]. 北京: 首都经济贸易大学, 2013.
|
| [27] |
|
| [28] |
|
| [29] |
|
| [30] |
李飞, 曾福生. 基于空间杜宾模型的农业基础设施空间溢出效应[J]. 经济地理, 2016, 36(6):142-147.
|
| [31] |
车磊, 白永平, 周亮, 等. 中国绿色发展效率的空间特征及溢出分析[J]. 地理科学, 2018, 38(11):1788-1798.
|
| [32] |
赵宏波, 马延吉, 苗长虹. 基于熵值—突变级数法的国家战略经济区环境承载力综合评价及障碍因子——以长吉图开发开放先导区为例[J]. 地理科学, 2015, 35(12):1525-1 532.
|
/
| 〈 |
|
〉 |