
城市结构对轨道交通系统与房地产价格关系的影响——以北京、杭州、南京、成都4个城市为例
|
郑燕巧(1988—),女,浙江宁波人,讲师。主要研究方向为城市经济学、空间计量、应用计量。E-mail:zhengyanqiao@hotmail.com。 |
收稿日期: 2018-11-14
修回日期: 2019-03-19
网络出版日期: 2025-04-24
基金资助
国家自然科学基金(71471161)
国家自然科学基金(71631005)
国家社会科学基金项目(13CMZ038)
Impact of Urban Structure on Subway System and Real Estate Price:Evidence from Beijing, Hangzhou, Nanjing and Chengdu
Received date: 2018-11-14
Revised date: 2019-03-19
Online published: 2025-04-24
文章构建衡量地铁通勤时间节省度的指标——地铁指数。基于该指标的回归分析显示,多数城市房价对交通便捷度的溢价为负。这一反直觉结果反映了城市多中心结构对地铁房价关系的影响。为识别不同的中心区块,提出一种带约束的聚类算法。该算法的优势在于其分区结果完全是数据导向的,相对于传统的行政分区,更能反映各区块的内在联结程度。同时,相较于传统的聚类算法,该算法在最小化组内距离的同时,加入一个在地铁指数的基础上构建的约束条件,该约束条件使得聚类分区结果能够同时反映城市经济学中关于交通便捷度溢价的基本假说和房地产市场的空间连续性特征。在分区的基础上重估模型,研究发现,在多中心城市的不同区块,地铁所带来的交通便捷度增益与其带来的居住环境恶化两种力量的对抗导致十分复杂的溢价效果。同时,诸如城市是否存在多个中心、城市核心区的大小、多中心城市的副中心与核心区距离的远近、不同中心区块经济发展程度的差异等城市结构因素也都会对地铁溢价的方向与大小产生影响。而这些复杂关系是在使用常系数特征价格模型分析单一城市的地铁房价关系时无法得到体现的。最后,基于约束聚类算法的分区结果还反映城市内不同区域间的经济地理一体化趋势与隔离趋势,因而可以为城市规划领域的有关问题提供有价值的建议。
郑燕巧 , 焦世泰 , 张晓奇 . 城市结构对轨道交通系统与房地产价格关系的影响——以北京、杭州、南京、成都4个城市为例[J]. 经济地理, 2019 , 39(6) : 75 -85 . DOI: 10.15957/j.cnki.jjdl.2019.06.009
This paper constructs an index system of time saving level of metro commuting to measure the improvement of commuting efficiency induced by living close to a metro station. Based on the regression analysis, the results find that except for Beijing, subway systems in Hangzhou, Chengdu and Nanjing all have negative impact on real estate price, which reflects the impact of the poly-centric structure of the three cities on their housing markets. To identify the correct housing submarket associated with every subcenter, this paper develops a constrained clustering algorithm which can partition the urban area into a set of subregions, this algorithm is fully data-oriented and can reflect deep-level features of urban structure. Compared with the standard K-means clustering, this clustering algorithm adds a constraint based on metro index. It is this constraint that can simultaneously reflect the space continuity of real estate market and the basic hypothesis which is the premium of transportation convenience. From the estimation, we find a complicated relationship between metro stations and real estate prices, the complexity is arising from the interaction of positive effect of subway system in terms of its commuting efficiency and its negative impact on living environment nearby. In addition, many structural features of cities can also significantly affect both the direction and scale of premiums of metro stations, such as the size of urban core, the distance between subcenters and urban core and so on. The complexity found in this paper is not detectable when it is used to analyze the real estate prize of single city based on the hedonic price model with constant coefficient. Finally, apart from pinpointing housing submarkets, constrained clustering can also shed light on the economic integration and segregation trend among different subregions of a city, which are useful information for urban planners.
Key words: metro index; polycentric structure; housing price; constrained clustering
表1 四大城市概况Tab.1 Background of four cities |
| 城市 | 经纬度(东经北纬) | GDP(万亿RMB) | 人口(百万) | 面积(km2) | 县级行政单位数量 | 地铁概况:第一条开通年份;现总条数 |
|---|---|---|---|---|---|---|
| 北京 | (39.9,116.4) | 2.80 | 21.70 | 16 808 | 16 | 1970;18 |
| 杭州 | (30.2,120.1) | 1.26 | 9.46 | 16 596 | 11 | 2011;3 |
| 南京 | (32.1,118.8) | 1.17 | 8.48 | 6 597 | 11 | 2003;7 |
| 成都 | (30.7,104.1) | 1.39 | 16.04 | 14 605 | 20 | 2013;3 |
注:数据来源为中国城市统计年鉴[23]。 |
表2 变量的定义Tab.2 Definition of variables |
| 变量 | 定义 | |
|---|---|---|
| log unit price | 每平方米房价的对数值 | |
| 公共交通 | transfer metro | 1 km范围内是否存在地铁站(1:是,0:否) |
| log dist subway | 离最近地铁站的直线距离的对数值(Log km) | |
| metro lt 1 | 周围1 km范围内是否有地铁站(1:有,0:无) | |
| metro lt 2 | 周围2 km范围内是否有地铁站(1:有,0:无) | |
| log dist bus | 里最近的公交车站的直线距离的对数(Log km) | |
| num bus routes | 最近公交站点所提供的公交车线路数 | |
| bus in 1 km | 周围1 km范围内是否有公交车站(1:有,0:无) | |
| metro index | 去往城市各个主要目的地的无地铁路线的通勤时间与地铁优先线路的通勤时间之比的平均值 | |
| 房屋属性 | log area | 建筑面积的对数值 |
| age | 房龄(2017-建筑年代) | |
| South | 房屋朝向是否为南方或偏南方(1:是,0:否) | |
| lobby num | 客厅数 | |
| room num | 卧室数 | |
| log stair | 房屋所在楼层数的对数值 | |
| 区位属性(log) | duration_PCA 0 | 去往城市各个主要目的地的对数通勤时间的第一主成分 |
| duration_PCA 1 | 去往城市各个主要目的地的对数通勤时间的第二主成分 | |
| duration_PCA 2 | 去往城市各个主要目的地的对数通勤时间的第三主成分 | |
| duration_PCA 3 | 去往城市各个主要目的地的对数通勤时间的第四主成分 | |
| duration_PCA 4 | 去往城市各个主要目的地的对数通勤时间的第五主成分 | |
| 社区属性(log km) | log dist school | 距附近最近学校的直线距离的对数(Log km) |
| log dist mall | 距附近最近购物中心的直线距离的对数(Log km) | |
| log dist hospital | 距附近最近医院的直线距离的对数(Log km) | |
表3 变量的描述性统计Tab.3 Summary statistics of variables |
| 变量 | 北京 | 杭州 | 南京 | 成都 | ||||||||||||||||
|---|---|---|---|---|---|---|---|---|---|---|---|---|---|---|---|---|---|---|---|---|
| Min | Max | Mean | Std. | Min | Max | Mean | Std. | Min | Max | Mean | Std. | Min | Max | Mean | Std. | |||||
| log unit price | -0.82 | 7.21 | 3.39 | 1.35 | -0.26 | 7.44 | 1.93 | 1.18 | -0.64 | 7.44 | 1.79 | 1.20 | -0.70 | 7.37 | 1.59 | 1.23 | ||||
| 公共交通 | ||||||||||||||||||||
| transfer metro | 0 | 1 | 0.15 | 0.36 | 0 | 1 | 0.07 | 0.25 | 0 | 1 | 0.05 | 0.22 | 0 | 1 | 0.01 | 0.11 | ||||
| log dist subway | -2.23 | 4.31 | 0.29 | 1.24 | -2.18 | 7.25 | 0.52 | 1.20 | -1.92 | 7.25 | 0.49 | 1.18 | -1.83 | 4.79 | 1.40 | 1.12 | ||||
| metro lt 1 | 0 | 1 | 0.54 | 0.50 | 0 | 1 | 0.39 | 0.49 | 0 | 1 | 0.44 | 0.50 | 0 | 1 | 0.13 | 0.34 | ||||
| metro lt 2 | 0 | 1 | 0.18 | 0.39 | 0 | 1 | 0.25 | 0.43 | 0 | 1 | 0.18 | 0.39 | 0 | 1 | 0.12 | 0.32 | ||||
| log dist bus | -2.29 | 4.23 | -0.70 | 1.35 | -2.26 | 7.23 | -1.25 | 1.01 | -2.25 | 7.23 | -0.65 | 1.45 | -2.19 | 4.68 | -0.09 | 1.60 | ||||
| num bus routes | 0 | 312 | 77.36 | 59.88 | 0 | 400 | 111.90 | 80.26 | 0 | 400 | 60.95 | 52.95 | 0 | 214 | 47.29 | 54 | ||||
| bus in 1km | 0 | 1 | 0.83 | 0.37 | 0 | 1 | 0.95 | 0.22 | 0 | 1 | 0.77 | 0.42 | 0 | 1 | 0.60 | 0.49 | ||||
| metro index | 1.08 | 2.38 | 1.77 | 0.24 | 1.15 | 2.38 | 1.58 | 0.30 | 0.58 | 2.38 | 2.13 | 0.48 | 1.36 | 2.38 | 1.66 | 0.21 | ||||
| 房屋属性 | ||||||||||||||||||||
| log area | 2.31 | 4.60 | 3.50 | 0.76 | 2.31 | 4.60 | 3.66 | 0.78 | 2.31 | 4.60 | 3.64 | 0.86 | 2.31 | 4.60 | 3.49 | 0.83 | ||||
| age | 0 | 59 | 11.81 | 6.96 | 0 | 47 | 11.94 | 8.72 | 0 | 47 | 9.99 | 7.71 | 0 | 32 | 7.20 | 5.02 | ||||
| South | 0 | 1 | 0.80 | 0.40 | 0 | 1 | 0.95 | 0.21 | 0 | 1 | 0.94 | 0.24 | 0 | 1 | 0.73 | 0.45 | ||||
| lobby num | 0 | 8 | 1.75 | 0.82 | 0 | 5 | 1.66 | 0.56 | 0 | 5 | 1.66 | 0.52 | 0 | 23 | 1.84 | 0.68 | ||||
| room num | 1 | 9 | 2.86 | 1.24 | 1 | 9 | 2.64 | 0.99 | 1 | 9 | 2.59 | 0.85 | 1 | 42 | 2.85 | 1.33 | ||||
| log stair | -2.30 | 4.04 | 1.28 | 1.45 | -2.30 | 3.80 | 1.67 | 1.02 | -2.29 | 3.80 | 1.48 | 1.05 | -2.29 | 3.93 | 1.77 | 1.20 | ||||
| 区位属性(log) | ||||||||||||||||||||
| duration_PCA0 | -32.90 | -29.10 | -30.60 | 1.01 | -49.09 | -42.79 | -45.34 | 1.59 | -34.81 | -42.79 | -32.50 | 1.12 | -36.03 | -32.76 | -34.18 | 0.95 | ||||
| duration_PCA1 | -1.15 | 1.06 | -0.01 | 0.66 | -2.31 | 3.90 | 0.01 | 1.36 | -1.11 | 3.90 | 0.02 | 0.96 | -0.61 | 1.40 | 0 | 0.49 | ||||
| duration_PCA2 | -0.80 | 0.63 | 0.01 | 0.45 | -1.68 | 2.32 | 0.02 | 0.86 | -0.98 | 2.32 | -0.01 | 0.66 | -0.69 | 0.64 | 0 | 0.44 | ||||
| duration_PCA3 | -0.93 | 0.36 | -0.01 | 0.30 | -0.78 | 1.89 | 0.01 | 0.49 | -0.32 | 1.89 | 0 | 0.31 | -0.44 | 1.09 | 0.01 | 0.39 | ||||
| duration_PCA4 | -0.37 | 0.54 | 0.01 | 0.22 | -0.76 | 1.24 | 0 | 0.44 | -0.71 | 1.24 | 0 | 0.27 | -0.37 | 0.63 | 0 | 0.26 | ||||
| 社区属性(log km) | ||||||||||||||||||||
| log dist school | -2.30 | 4.25 | -0.20 | 1.24 | -2.30 | 7.23 | -0.54 | 1 | -2.30 | 7.23 | -0.03 | 1.25 | -2.23 | 4.72 | 0.48 | 1.26 | ||||
| log dist mall | -2.17 | 4.29 | 0.29 | 1.29 | -2.27 | 7.23 | 0.31 | 0.94 | -2.14 | 7.23 | 0.59 | 1.18 | -2.27 | 4.80 | 1.08 | 1.13 | ||||
| log dist hospital | -1.86 | 4.35 | 1.01 | 0.95 | -2.09 | 7.24 | 1.17 | 0.94 | -2.14 | 7.24 | 1.33 | 0.96 | -1.75 | 4.78 | 1.14 | 0.98 | ||||
表4 全样本回归结果Tab.4 Full-sample regression result |
| 变量 | 北京 | 杭州 | 南京 | 成都 |
|---|---|---|---|---|
| Dist bus | -0.0599** | 0.0803*** | -0.0910*** | -0.0199 |
| Bus in 1km | 0.2589*** | 0.1200*** | -0.1481*** | -0.0058 |
| Num bus routes | -0.1293*** | 0.0669*** | 0.0337*** | -0.0714*** |
| Dist subway | -0.0734*** | -0.0684*** | -0.0497*** | -0.0036 |
| Transfer metro | 0.0609*** | 0.0149 | 0.0241* | -0.0854** |
| Metro lt 1 | 0.0272 | -0.0952*** | 0.0376** | 0.1106*** |
| Metro lt 2 | 0.0139 | -0.0773*** | 0.0689*** | 0.1004*** |
| Metro index | 0.0059 | -0.122*** | -0.1552*** | -0.2958*** |
| Adj.R2 | 0.85 | 0.883 | 0.923 | 0.837 |
| F-Staitstics | 679.4*** | 1 434*** | 1 684*** | 795*** |
| Obs. | 2625 | 4 130 | 3 068 | 3 395 |
注:“*”、“**”、“***”分别代表10%、5%、1%显著程度。 |
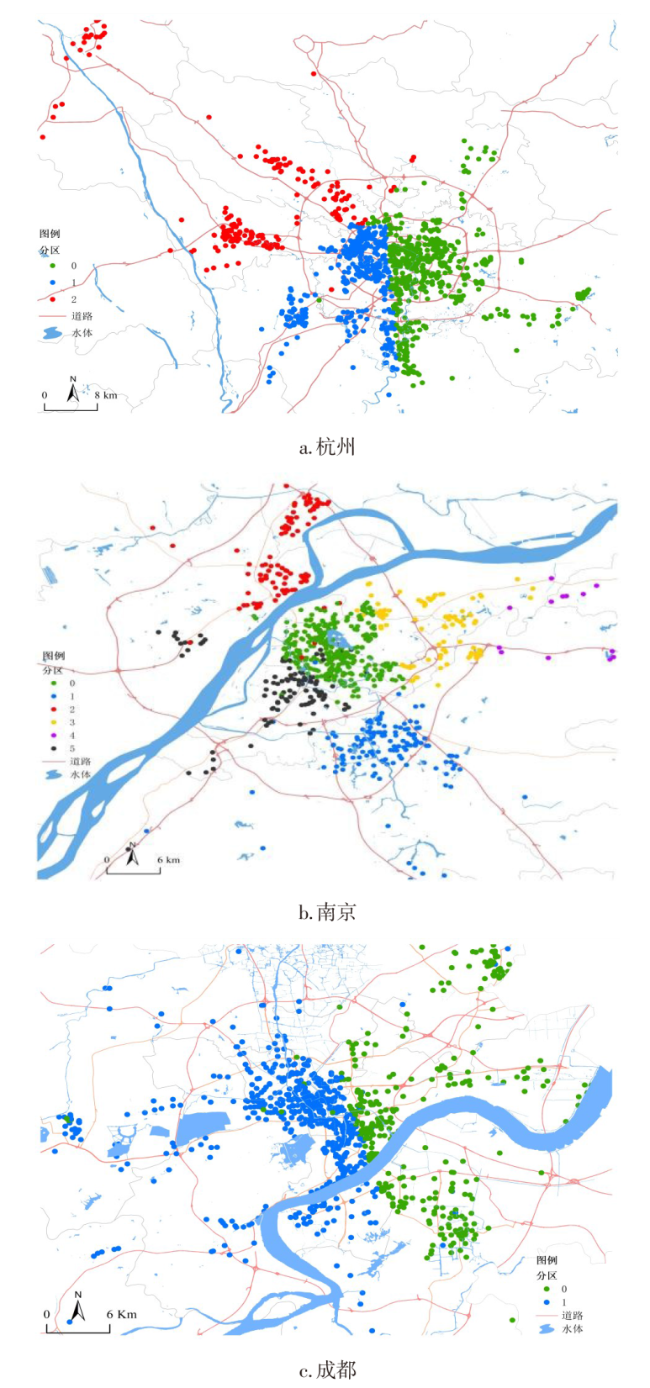
表5 南京聚类分区后的回归结果Tab.5 Regression result by cluster-Nanjing |
| 区块0 | 区块1 | 区块2 | 区块3 | 区块4 | 区块5 | |
|---|---|---|---|---|---|---|
| Dist bus | 0.0026 | 0.0364 | 0.1460* | -0.0559 | -0.1102 | -0.2411*** |
| Bus in 1 km | -0.3748** | 0.3693*** | -0.3626 | 0.098 | -0.2485 | -0.4484*** |
| Num bus routes | 0.1142*** | 0.0026 | 0.1704 | -0.0481 | 0.1274 | 0.1111** |
| Dist subway | 0.0018 | -0.0328 | -0.1817** | -0.0342 | -0.0590 | 0.0283 |
| Transfer metro | 0.0477** | 0.8917*** | ||||
| Metro lt 1 | 0.1045*** | -0.0254 | 0.2448* | 0.0667* | 0.1875 | -0.0750 |
| Metro lt 2 | 0.0767*** | 0.0267 | 0.2105 | 0.0019 | -1.1426 | 0.0372 |
| Metro index | 0.0010 | 0.1337** | 0.0269 | 0.0021 | 0.4389* | 0.0014 |
| Adj.R | 0.9170 | 0.9600 | 0.9560 | 0.9510 | 0.9740 | 0.9200 |
| F-statistics | 382.5*** | 702.1*** | 661.2*** | 382.5*** | 342.1*** | 230.6*** |
| Obs. | 760 | 638 | 639 | 430 | 159 | 442 |
表6 杭州聚类分区后的回归结果Tab.6 Regression result by cluster-Hangzhou |
| 杭州 | 区块0 | 区块1 |
|---|---|---|
| dist_bus | 0.2430*** | 0.1073*** |
| bus_in_1 km | 0.2047** | 0.3375*** |
| num_bus_routes | 0.0032 | 0.0863*** |
| dist_subway | -0.0377 | -0.0194 |
| transfer_metro | 0.0093 | 0.0602*** |
| metro_lt_1 | 0.0563 | -0.0536*** |
| metro_lt_2 | 0.0903*** | -0.0614*** |
| metro_index1 | 0.0020 | 0.0021 |
| Adj.R | 0.9130 | 0.8920 |
| F-statistics | 341*** | 1 255*** |
| Obs. | 1 699 | 2 431 |
表7 成都聚类分区后的回归结果Tab.7 Regression result by cluster-Chengdu |
| 区块0 | 区块1 | 区块2 | |
|---|---|---|---|
| dist_bus | -0.0340 | 0.0549 | 0.0048 |
| bus_in_1 km | -0.0795 | 0.2769*** | -0.0490 |
| num_bus_routes | -0.0224 | -0.1024*** | 0.0706** |
| dist_subway | -0.2602*** | 0.1377*** | -0.1645*** |
| transfer_metro | 1.3171 | ||
| metro_lt_1 | -0.1093* | 0.2074*** | -0.0529 |
| metro_lt_2 | -0.0423* | 0.1708*** | -0.0350 |
| metro_index1 | 0.0199 | 0.0117 | 0.2031* |
| Adj.R | 0.8560 | 0.9070 | 0.8770 |
| F-statistics | 471.1*** | 480.2*** | 196.6*** |
| Obs. | 1 794 | 1 081 | 520 |
| [1] |
|
| [2] |
|
| [3] |
|
| [4] |
冯长春, 李维瑄, 赵蕃蕃. 轨道交通对其沿线商品住宅价格的影响分析——以北京地铁5号线为例[J]. 地理学报, 2011, 66(8):1055-1 062.
|
| [5] |
|
| [6] |
|
| [7] |
|
| [8] |
|
| [9] |
聂冲, 温海珍, 樊晓锋. 城市轨道交通对房地产增值的时空效应[J]. 地理研究, 2010, 29(5),801-810.
|
| [10] |
|
| [11] |
|
| [12] |
|
| [13] |
|
| [14] |
|
| [15] |
|
| [16] |
|
| [17] |
|
| [18] |
|
| [19] |
|
| [20] |
|
| [21] |
|
| [22] |
|
| [23] |
国家统计局. 中国城市统计年鉴[M]. 北京: 中国统计出版社, 2016.
|
| [24] |
|
| [25] |
|
| [26] |
谷一桢, 郭睿. 轨道交通对房地产价值的影响——以北京市八通线为例[J]. 经济地理, 2008, 28(3):411-414.
|
| [27] |
王福良, 冯长春, 甘霖. 轨道交通对沿线住宅价格影响的分市场研究——以深圳市龙岗线为例[J]. 地理科学进展, 2014, 33(6):765-772.
|
| [28] |
|
| [29] |
|
| [30] |
|
| [31] |
|
| [32] |
|
/
| 〈 |
|
〉 |