
经济技术开发区建设对中国经济格局的影响
|
郑智(1993—),男,河南商丘人,博士研究生。主要研究方向为经济地理与区域发展。E-mail:zhengzhi222@126.com。 |
收稿日期: 2018-11-14
修回日期: 2019-03-19
网络出版日期: 2025-04-24
基金资助
国家自然科学基金重点项目(41530751)
The Impact of Economic and Technological Development Zone on China's Economic Pattern
Received date: 2018-11-14
Revised date: 2019-03-19
Online published: 2025-04-24
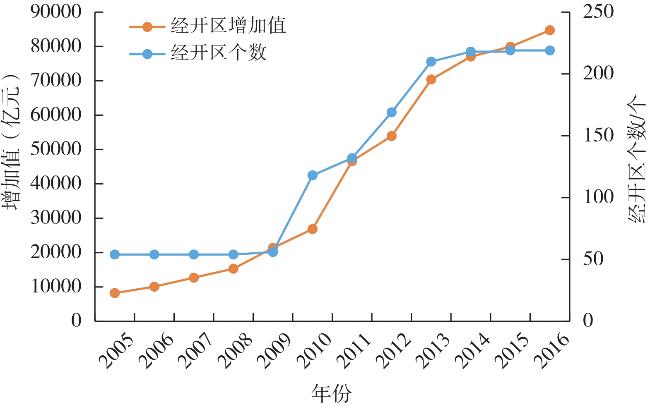
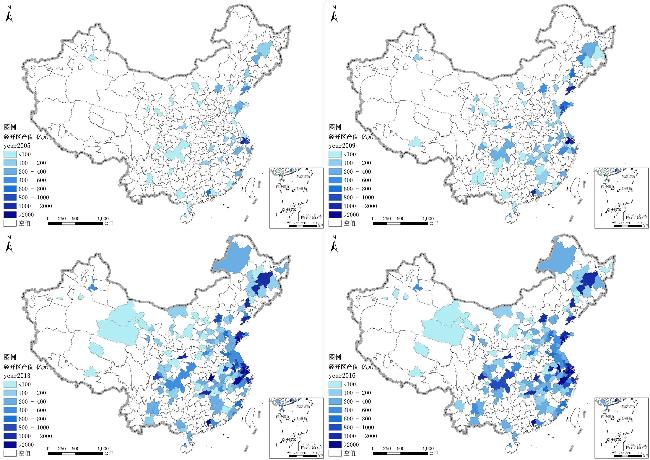
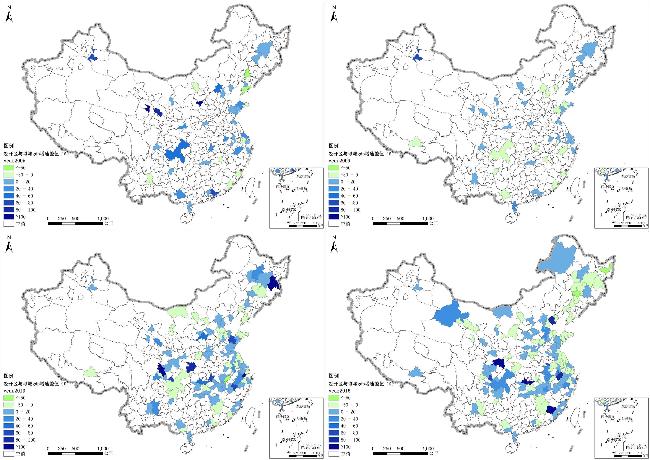
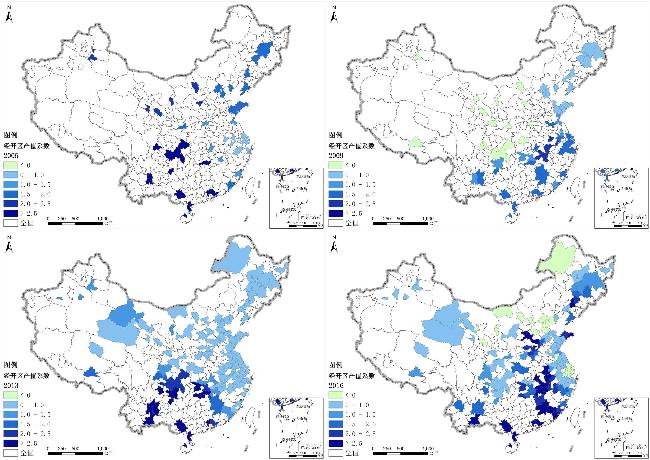
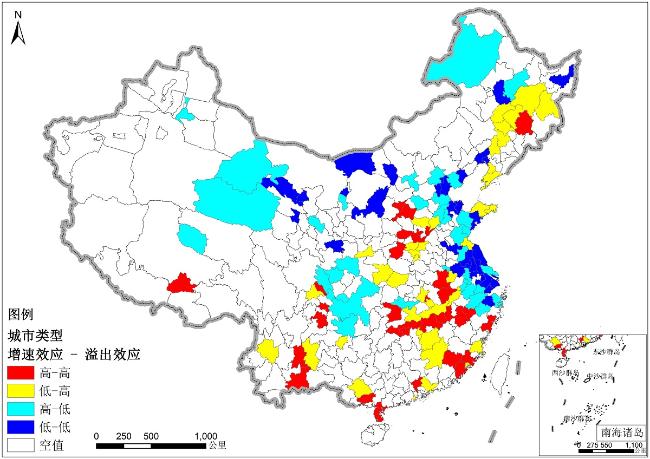
改革开放以来,经济技术开发区作为中国经济发展的试验田和先导力量,引领着地方经济的转型和增长。经济技术开发区的建设对中国经济格局是否存在显著影响,这种影响又如何表现是一个非常有意义的研究议题。文章将经济技术开发区对当地经济作用关系归纳为增速效应与溢出效应两种形式,并通过地理加权回归等空间计量方法对其进行定量刻画,研究发现:①经济技术开发区数量以及增加值分布呈现出东、中、西部依次递减的格局,并主要集中在由长江经济带,以及长三角以北的沿海经济带组成的反“L”形区域。②高增速效应区域由西北转向东部沿海,最后集中于长江经济带,而高溢出效应区域则由西部转向东南,最终集中于中部地区。③根据增速效应和溢出效应的数值关系,可将经济技术开发区对城市的作用类型分为高增速高溢出、低增速高溢出、高增速低溢出以及低增速低溢出效应四种类型。其中高—高型主要分布在长江经济带中游,高—低型分布在西北以及东部沿海,低—高型分布在中部以及东北地区,而低—低型则主要分布于环渤海和江苏以及内蒙、甘肃和陕西一带。④经济技术开发区的建设更进一步地加强东部地区经济优势。文章提出:经济技术开发区建设和转型过程中,应注重增速效应和溢出效应的均衡发展,提升自身增速的同时,积极融入到区域经济以及社会网络中去,更好地服务于当地经济发展。
郑智 , 叶尔肯·吾扎提 , 梁宜 , 张若琰 , 刘卫东 . 经济技术开发区建设对中国经济格局的影响[J]. 经济地理, 2019 , 39(6) : 26 -35 . DOI: 10.15957/j.cnki.jjdl.2019.06.004
Since the reform and opening, the economic and technological development zone, as a test field and leading force for China's economic development, has always been leading the transformation and growth of the local economy. Whether the construction of them have conducted a significant impact on China's economic structure and how this effect is manifested are very significant research topics. In this paper, the contribution forms the economic and technological development zone on the local economy is summarized as growth effect and spillover effect, and it is quantitatively characterized by geographically weighted regression and other spatial analysis methods. Major conclusions are drawn as follows: 1)The number and added value pattern of the economic and technological development zone shows a decreasing trend from the east to the west mainly gathers in the inverted "L-shaped" region consisting of the Yangtze River Economic Belt and the coastal economic belt. 2) The areas with high growth effect turn from the northwest to the eastern coast and finally concentrate on the Yangtze River Economic Belt, while the areas with high spillover effect turn from the west to the southeast and finally concentrate in the middle region. 3) According to the numerical relationship between the growth effect and the spillover effect, this paper classifies the effect of the economic and technological development zone on the city as four types which are high-growth and high-spillover(H-H), low-growth and high-spillover(L-H), high-growth and low-spillover(H-L), low-growth and low-spillover(L-L). The H-H type mainly distributes in the middle reaches of the Yangtze River Economic Belt. The H-L type distributes in the northwest and the east coast, the L-H type distributes in the central and northeast areas, and the L-L type mainly distributes in the Bohai Rim, Jiangsu and Inner Mongolia, Gansu and Shaanxi. 4) The construction of the economic and technological development zone has further strengthened the economic advantages of the eastern region. The paper puts forward that in the process of construction and transformation of the economic and technological development zone, more attention should be payed to balance the development of growth effect and spillover effect. While improving its growth rate, actively integrating it into the regional economy and social network is conducive to better serve the local economic development.
表1 莫兰指数及检验Tab.1 Moran's I and test |
| 年份 | Moran's I指数 | p值 | z得分 |
|---|---|---|---|
| 2005 | 0.3582 | 0.0002 | 3.7193 |
| 2009 | 0.0393 | 0.0534 | 1.9313 |
| 2013 | 0.1164 | 0.0000 | 7.4198 |
| 2016 | 0.1208 | 0.0000 | 7.7729 |
表2 控制变量计算方法及预期系数Tab.2 Calculation method and expected coefficient of control variable |
| 影响因素 | 计算方法 | 预期 系数 |
|---|---|---|
| 资本投入因素 | 固定资产投资总额 | + |
| 劳动力因素 | 城镇单位就业人口+城镇私营和个体从业人口 | + |
| 结构因素 | (二产增加值+三产增加值)/国内增加值总额 | + |
| 外资因素 | 实际利用外资总额 | + |
| 集聚因素 | 经开区增加值总额 | + |
表3 全局OLS回归结果Tab.3 OLS regression results |
| 影响因素 | 估计值 | 标准差 | t值 | p值 |
|---|---|---|---|---|
| X1(投资因素:固定资产投资) | 0.6471 | 0.2414 | 2.6808 | 0.0083 |
| X2(劳动力因素:城镇从业人员数量) | 8.3003 | 0.5584 | 14.8642 | 0.0000 |
| X3(结构因素:非农产业比重) | 47 897.9521 | 21 133.0873 | 2.2665 | 0.0251 |
| X4(外资因素:实际利用外资总额) | 3.7933 | 0.7771 | 4.8811 | 0.0000 |
| X5(集聚因素:经开区生产总值) | 1.2433 | 0.3721 | 3.3415 | 0.0011 |
| R2=0.928 adj R2=0.925 AICc=4 769.49 | ||||
表4 GWR模型系数估计值统计表Tab.4 Coefficient estimates statistics of GWR model |
| 影响因素 | 最大值 | 最小值 | 平均值 | 标准差 |
|---|---|---|---|---|
| X1(投资因素:固定资产投资) | 0.3897 | 0.2050 | 0.3094 | 0.0269 |
| X2(劳动力因素:城镇从业人员数量) | 12.5662 | 6.1119 | 8.9453 | 0.8523 |
| X3(结构因素:非农产业比重) | 103 704.8956 | 26 987.7979 | 66 525.2331 | 12 318.6287 |
| X4(外资因素:实际利用外资总额) | 12.3421 | 6.7118 | 9.9265 | 1.0498 |
| X5(集聚因素:经开区生产总值) | 3.9076 | -0.8195 | 1.2129 | 1.1859 |
| R2=0.953 adj R2=0.947 AICc=4 748.90 | ||||
| [1] |
张晓平. 我国经济技术开发区的发展特征及动力机制[J]. 地理研究, 2002(5):656-666.
|
| [2] |
张晓平, 刘卫东. 开发区与我国城市空间结构演进及其动力机制[J]. 地理科学, 2003(2):142-149.
|
| [3] |
郭小碚, 张伯旭. 对开发区管理体制的思考和建议——国家级经济技术开发区调研报告[J]. 宏观经济研究, 2007(10):9-14.
|
| [4] |
邓春玉. 我国开发区管理体制创新趋势分析——兼论广东湛江国家级经济技术开发区东海岛新区管理体制[J]. 城市发展研究, 2007(1):111-118,126.
|
| [5] |
丛林. 国家级经济技术开发区发展战略研究[J]. 开发研究, 2005(2):27-28.
|
| [6] |
赵晓冬, 王伟伟, 吕爱国. 国家级经济技术开发区管理体制类型研究[J]. 中国行政管理, 2013(12):56-59.
|
| [7] |
龙花楼, 蔡运龙, 万军. 开发区土地利用的可持续性评价——以江苏昆山经济技术开发区为例[J]. 地理学报, 2000(6):719-728.
|
| [8] |
冯薇. 产业集聚与生态工业园的建设[J]. 中国人口·资源与环境, 2006(3):51-55.
|
| [9] |
李同昇, 韦亚权, 周华. 生态工业园及其规划设计探讨[J]. 经济地理, 2005, 25(5):647-650.
|
| [10] |
王文滋. 再论我国经济技术开发区城市化功能开发[J]. 城市开发, 1999(1):33-35.
|
| [11] |
陈昭锋. 论我国经济技术开发区城市化功能开发[J]. 城市开发, 1998(4):19-21.
|
| [12] |
高超, 金凤君. 沿海地区经济技术开发区空间格局演化及产业特征[J]. 地理学报, 2015, 70(2):202-213.
|
| [13] |
黄小斌. 试论我国高技术开发区布局[J]. 经济地理, 2000(6):34-38.
|
| [14] |
陈汉欣. 中国高技术开发区的类型与建设布局研究[J]. 经济地理, 1999, 19(1):7-11.
|
| [15] |
江立武, 赵小敏. 基于GIS空间模型的开发区土地集约利用评价研究[J]. 开发研究, 2010(2):10-12,40.
|
| [16] |
黄凌翔, 赵娣, 金丽国. 开发区土地集约利用潜力实现研究——基于天津经济技术开发区673个地块的调研[J]. 中国土地科学, 2014, 28(10):33-39.
|
| [17] |
胡新智. 中国国家级经济技术开发区产业集群效果分析[J]. 管理评论, 2005(7):20-26,63.
|
| [18] |
|
| [19] |
|
| [20] |
Bwalya, Samuel Mulenga,foreign direct invesstment and technology spillovers:evidence from panel data analysis of manufacturing firms in Zambia[J]. Journal of Development Economics, 2006, 81:514-526.
|
| [21] |
Wei Yehua Dennis,
|
| [22] |
余军华. 高新技术开发区与湖北区域经济发展战略的一个可能性框架[J]. 科技进步与对策, 2008(8):112-115.
|
| [23] |
何丹, 蔡建明, 周璟. 天津开发区与城市空间结构演进分析[J]. 地理科学进展, 2008(6):97-103.
|
| [24] |
王缉慈. 高新技术产业开发区对区域发展影响的分析构架[J]. 中国工业经济, 1998(3):54-57.
|
| [25] |
王慧. 开发区与城市相互关系的内在肌理及空间效应[J]. 城市规划, 2003(3):20-25.
|
| [26] |
|
| [27] |
|
| [28] |
|
| [29] |
王少剑, 王洋, 赵亚博. 1990年来广东区域发展的空间溢出效应及驱动因素[J]. 地理学报, 2015, 70(6):965-979.
|
| [30] |
熊义杰. 技术溢出效应与区域经济发展[M]. 北京: 科学出版社, 2016.
|
| [31] |
覃文忠. 地理加权回归基本理论与应用研究[D]. 上海: 同济大学, 2007.
|
| [32] |
林锦耀, 黎夏. 基于空间自相关的东莞市主体功能区划分[J]. 地理研究, 2014, 33(2):349-357.
|
| [33] |
孙倩, 汤放华. 基于空间扩展模型和地理加权回归模型的城市住房价格空间分异比较[J]. 地理研究, 2015, 34(7):1343-1 351.
|
| [34] |
姚丽, 谷国锋. 基于GWR的河南省县域经济差异及其驱动因子的时空演变研究[J]. 河南科学, 2014, 32(9):1853-1 859.
|
/
| 〈 |
|
〉 |