
湖南省各地级市产业技术选择指数的实证研究
|
李毅(1973—),男,湖南岳阳人,博士,副教授,硕士生导师。主要研究方向为面板数据计量经济模型的理论与应用。E-mail:liyidavid@126.com。 |
收稿日期: 2018-12-02
修回日期: 2019-04-07
网络出版日期: 2025-04-24
基金资助
湖南省社会科学成果评审委员会重大课题(XSP17ZDA003)
湖南省自然科学基金一般项目(2017JJ2111)
湖南省社科联智库课题(ZK2017011)
Empirical Research of Industrial Technology Choice Index in Hunan at Prefecture-Level City
Received date: 2018-12-02
Revised date: 2019-04-07
Online published: 2025-04-24
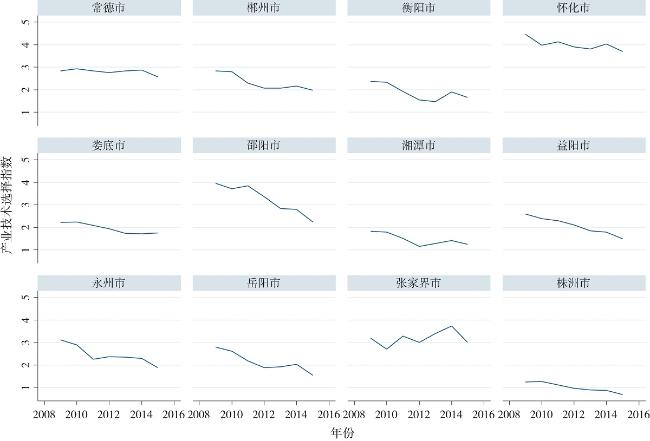
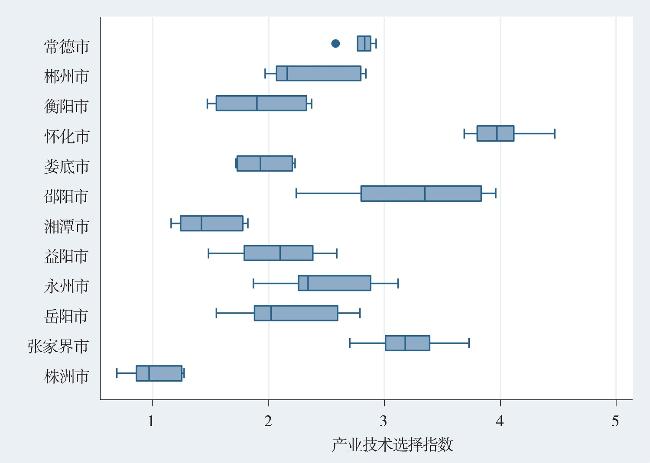
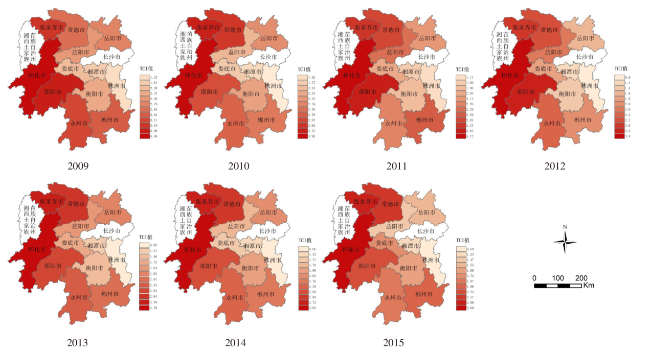
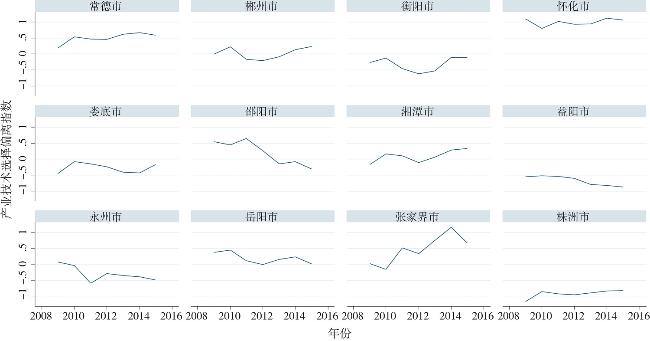
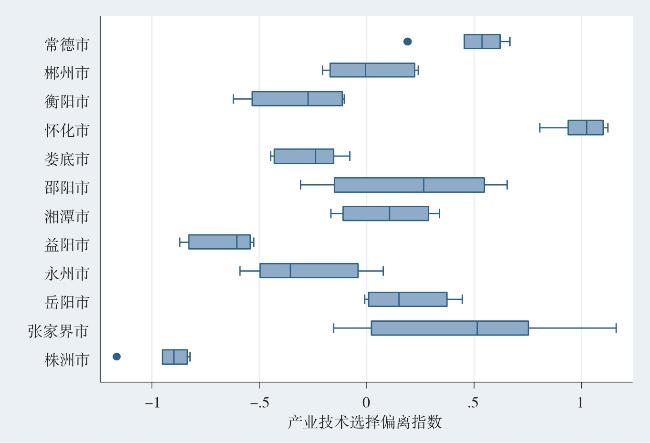
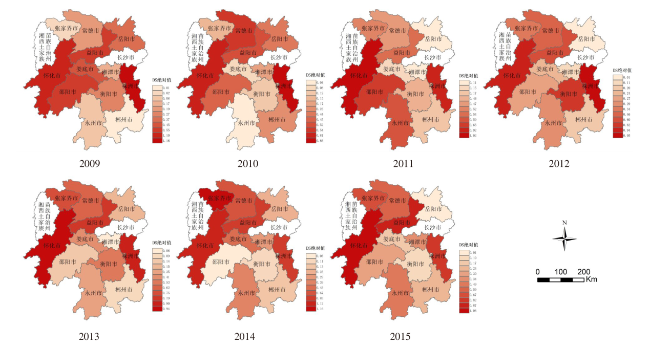
基于产业技术选择指数的面板数据模型,对2009—2015年湖南省各地级市的资源禀赋和产业技术选择进行实证研究,结果发现:①湖南省各地级市的产业发展战略呈现出湘西北、湘东发展失衡,而湘东北、湘南发展基本协调的“十字型”空间特征。②张家界、怀化和常德等湘西北地区和株洲、益阳两个湘中东地区都严重偏离资源禀赋结构的比较优势。③岳阳、湘潭、娄底、永州等城市的产业发展政策对资源禀赋结构的比较优势偏离不大,并且大部分地区的偏离幅度随时间的演变得到持续改进。建议湖南产业发展战略应该遵循产业动态发展规律,充分考虑地区间资源禀赋结构的差异;通过相对降低湘西和湘东地区产业的资本劳动比重以及提高湘中东地区产业的资本劳动比重来优化湖南省各地级市的产业发展战略。
关键词: 资源禀赋结构; 产业技术选择指数; 比较优势; 产业技术选择偏离指数
李毅 , 李明 , 罗媞 , 邓正华 . 湖南省各地级市产业技术选择指数的实证研究[J]. 经济地理, 2019 , 39(6) : 147 -153 . DOI: 10.15957/j.cnki.jjdl.2019.06.016
Based on the panel data model of industrial technology choice index, this paper makes an empirical study on the resource endowment and industrial technology choice in Hunan at city level from 2009 to 2015. The results are as follows: 1) The unbalanced development areas of the industrial development strategy in Hunan mainly distribute in northwestern and eastern Hunan, and the coordinated development areas are located in northeastern and southern Hunan. 2) Zhangjiajie, Huaihua, Changde, Zhuzhou and Yiyang have seriously deviated from the comparative advantage of resource endowment structure.3) The industrial development policy of Yueyang, Xiangtan, Loudi and Yongzhou does not significantly deviate from the comparative advantage of the resource endowment structure, the deviation rate of those areas has been continuously improved with time goes by. It’s suggested that the Hunan industrial development strategy should follow the law of industrial dynamic development, take full account of the difference of resource endowment structure among regions and optimize the industrial development strategy of Hunan province by reducing the ratio of capital labor in western and eastern Hunan, meanwhile raising the capital labor ratio of the industries in the middle eastern Hunan.
表1 各解释变量所归属的资源禀赋结构Tab.1 Explanatory variables of resource endowment structure |
| 一级指标 | 二级指标 | 单位 |
|---|---|---|
| 发展战略选择测度 | 产业技术选择指数(TCI) | - |
| 发展阶段测度 | 人均GDP对数值(lngdp) | 元/人 |
| 土地禀赋测度 | 人均土地面积(land) | km2/万人 |
| 劳动力禀赋测度 | 总就业人数对数值(lnlabor) | 万人 |
| 人均人力资本存量(human) | 加权受教育 年数/人均 | |
| 科技禀赋测度 | 人均高科技产值(ht) | 万元/万人 |
| 基础设施测度 | 每平方公里公路里程数(road) | km/km2 |
| 人均邮电总量业务总量(post) | 万元/万人 |
表2 产业选择指数计量模型的估计结果Tab.2 Estimation results of econometric models of industry choice index |
| 变量 | 混合 OLS | 个体 效应 | 时间 效应 | 双向固定 效应 | 随机 效应 |
|---|---|---|---|---|---|
| land | 0.03* | 0.04 | 0.04 | 0.04 | 0.04* |
| lngdp | -2.32* | -2.56* | 2.62 | 4.65 | -2.39 |
| ht | -0.04 | -0.08 | -0.18 | -0.18 | -0.08 |
| road | 0.05 | 1.06 | 0.48 | 0.48 | 0.67 |
| post | 1.23 | 3.97* | 0.32 | 0.32 | 3.14* |
| human | -1.24 | -1.10 | -0.01 | -0.01 | -1.35 |
| lnlabor | -0.33 | 0.24* | 2.03* | 2.03* | 0.24* |
| _cons | 11.08* | 11.45* | -14.92 | -13.06 | 10.42 |
| 2010年 | - | - | -0.32 | -0.34 | - |
| 2011年 | - | - | -0.56 | -0.61 | - |
| 2012年 | - | - | -0.88 | -0.95 | - |
| 2013年 | - | - | -1.02 | -1.10 | - |
| 2014年 | - | - | -0.98 | -1.09 | - |
| 2015年 | - | - | 0.51 | 0.27 | - |
| 郴洲 | - | -0.55 | - | -0.32 | - |
| 衡阳 | - | -0.78 | - | -0.47 | - |
| 怀化 | - | 0.02 | - | 1.18 | - |
| 娄底 | - | -1.30 | - | 0.09 | - |
| 邵阳 | - | -0.18 | - | 1.42 | - |
| 湘潭 | - | -0.57 | - | -0.16 | - |
| 益阳 | - | -1.17* | - | 0.17 | - |
| 永州 | - | -0.98 | - | 0.06 | - |
| 岳阳 | - | -0.41 | - | -0.43 | - |
| 张家界 | - | 0.88 | - | 0.99 | - |
| 株洲 | - | -1.38* | - | -1.37* | - |
| 拟合优度 | 0.724 | 0.940 | 0.660 | 0.949 | 0.702 |
| sigma_u | - | - | 0.780 | - | 0.620 |
| sigma_e | - | - | 0.230 | - | 0.230 |
| rho | - | - | 0.920 | - | 0.870 |
表3 固定效应与随机效应的识别检验Tab.3 Recognition test of fixed effect and random effect |
| 统计量 | Hausman检验 | Wooldridge检验 | Bootstrap检验 |
|---|---|---|---|
| 卡方统计量 | 1.66 | - | 0.65 |
| F统计量 | - | 0.81 | - |
| P值 | 0.9898 | 0.8819 | 0.9960 |
表4 湖南省12个地级市的产业发展战略状况Tab.4 Industrial development strategy in Hunan at prefecture-level city |
| 地区 | 目前发展战略状况 | 偏离比较优势的程度 | 发展战略的变化状况 | 符合比较优势的发展方向 |
|---|---|---|---|---|
| 常德 | 资本密集型 | 严重偏离 | 基本不变 | 劳动密集型 |
| 郴州 | 符合比较优势 | 不偏离 | 轻微波动 | 保持不变 |
| 衡阳 | 劳动密集型 | 中度偏离 | 轻微波动 | 资本密集型 |
| 怀化 | 资本密集型 | 严重偏离 | 基本不变 | 劳动密集型 |
| 娄底 | 劳动密集型 | 中度偏离 | 轻微波动 | 资本密集型 |
| 邵阳 | 资本密集型 | 中度偏离 | 急剧改善 | 劳动密集型 |
| 湘潭 | 资本密集型 | 中度偏离 | 轻微波动 | 劳动密集型 |
| 益阳 | 劳动密集型 | 严重偏离 | 轻微波动 | 资本密集型 |
| 永州 | 劳动密集型 | 中度偏离 | 轻微波动 | 资本密集型 |
| 岳阳 | 资本密集型 | 中度偏离 | 轻微波动 | 劳动密集型 |
| 张家界 | 资本密集型 | 严重偏离 | 急剧恶化 | 劳动密集型 |
| 株洲 | 劳动密集型 | 严重偏离 | 基本不变 | 资本密集型 |
| [1] |
|
| [2] |
|
| [3] |
|
| [4] |
Aghion, Philippe,and Peter Howitt. Endogenous Growth Theory[M]. Cambridge MA: MIT press, 1998:11-23.
|
| [5] |
林毅夫. 新结构经济学[M]. 北京: 北京大学出版社, 2012.
|
| [6] |
林毅夫. 发展战略、自生能力和经济收敛[J]. 经济学(季刊), 2002, 1(20):269-300.
|
| [7] |
林毅夫, 潘士远, 刘明兴. 技术选择、制度与经济发展[J]. 经济学(季刊), 2006, 5(3):695-714.
|
| [8] |
林毅夫, 张鹏飞. 适宜技术、技术选择和发展中国家的经济增长[J]. 经济学(季刊), 2006, 5(4):985-1 005.
|
| [9] |
李飞跃. 技术选择和经济发展[J]. 世界经济, 2012(2):45-62.
|
| [10] |
向延平, 林彰平. 区域内生发展:基于地理学家的视角和解释[J]. 经济地理, 2013, 33(4):36-40.
|
| [11] |
黄茂兴, 李军军. 技术选择、产业结构升级与经济增长[J]. 经济研究, 2009(7):143-151.
|
| [12] |
薛继亮. 技术选择与产业结构转型升级[J]. 产业经济研究, 2013(6):29-37.
|
| [13] |
周国华, 陈炉, 唐承丽, 等. 长株潭城市群研究进展与展望[J]. 经济地理, 2018, 38(6):52-60.
|
| [14] |
鞠晓伟, 赵树宽. 产业技术选择与产业技术生态环境的耦合效应分析[J]. 中国工业经济, 2009(3):71-80.
|
| [15] |
张平, 李秀芬. 产业技术选择与要素禀赋耦合效应研究[J]. 工业技术经济, 2017(2):10-15.
|
| [16] |
覃成林, 李超. 要素禀赋结构、技术选择与中国城市现代产业发展[J]. 产业经济研究, 2012(3):18-25.
|
| [17] |
林毅夫, 刘明兴, 刘培林, 等. 经济发展战略与经济增长的实证分析——关于技术选择指数的测量与计算(I)[C]. 工作论文, 2004:1-34.
|
| [18] |
林毅夫, 殷伟, 刘明兴, 等. 经济发展战略与经济增长的实证分析——关于技术选择指数的测量与计算(II)[C]. 工作论文, 2005:1-38.
|
| [19] |
陈斌开, 林毅夫. 发展战略、城市化与中国城乡收入差距[J]. 中国社会科学, 2013(4):81-102.
|
| [20] |
林毅夫, 陈斌开. 重工业优先发展战略、城市化与城乡收入差距[J]. 南开经济研究, 2010(1):3-18.
|
| [21] |
|
/
| 〈 |
|
〉 |