
中国高端制造业的全球贸易网络格局及其影响因素分析
|
袁红林(1969—),男,江西宁都人,博士,教授,博士生导师。主要研究方向为跨国公司与贸易网络地理。E-mail:yhl6910@163.com。 |
收稿日期: 2018-12-08
修回日期: 2019-04-05
网络出版日期: 2025-04-24
基金资助
国家社会科学基金一般项目(16BGJ008)
江西省社会科学规划项目(17JL01)
江西省研究生创新专项资金项目(YC2017-B050)
江西省高校人文社会科学规划项目(GL15109)
Global Trade Network Pattern and Influencing Factors of Advanced Manufacturing in China
Received date: 2018-12-08
Revised date: 2019-04-05
Online published: 2025-04-24
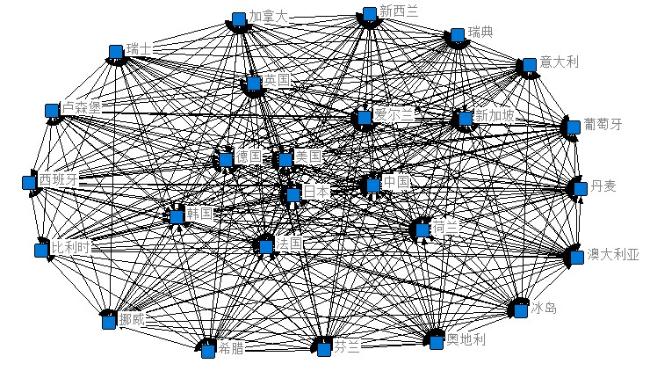
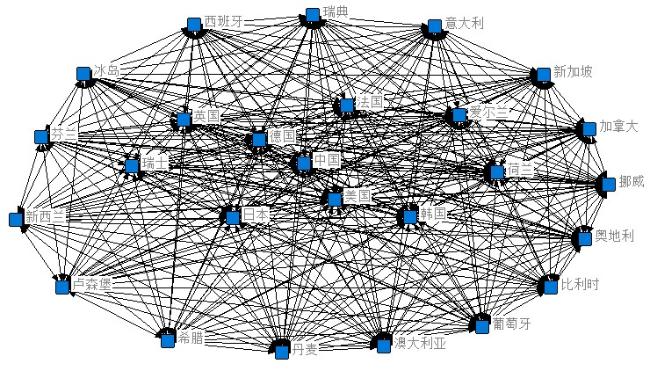
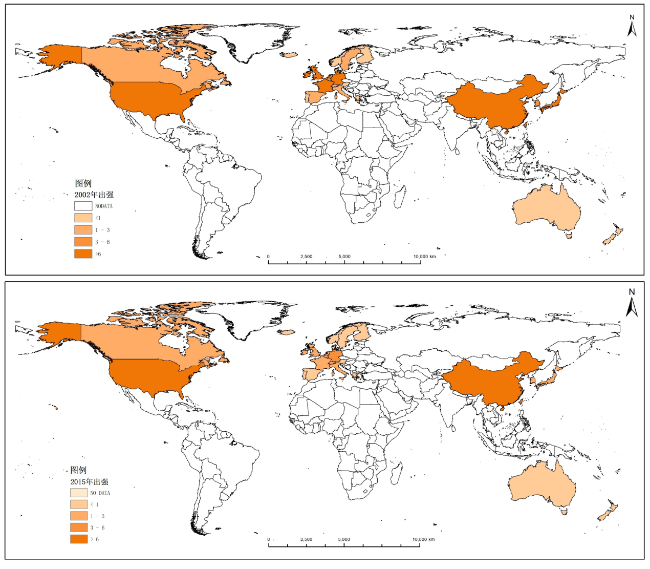
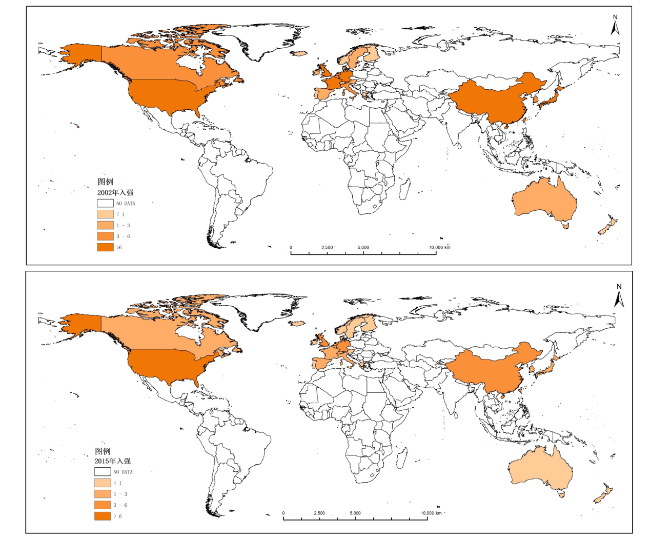
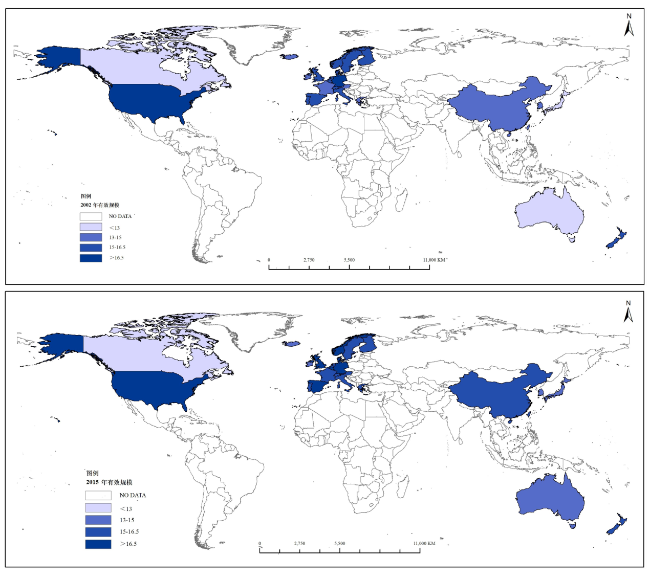
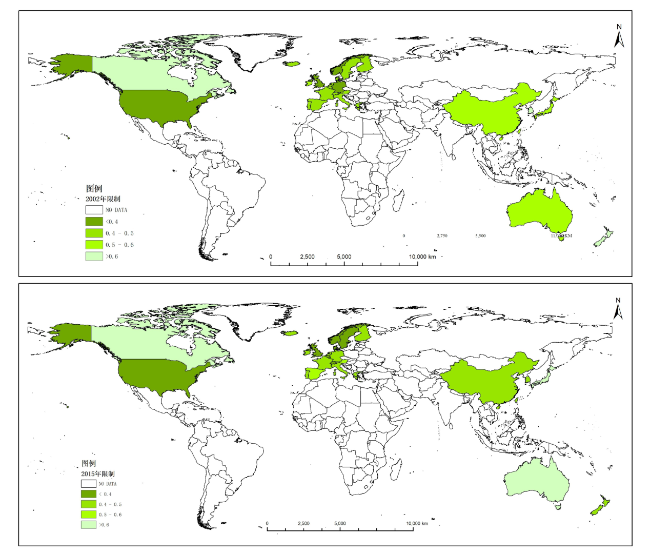
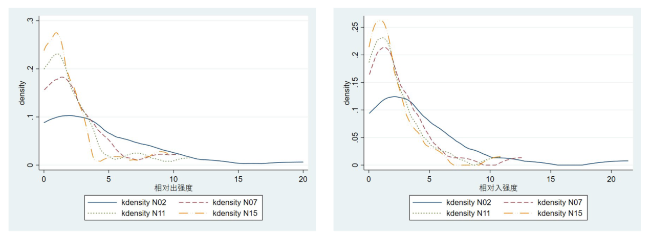
随着新一轮科技革命与全球产业格局重塑,解构发达国家与中国高端制造业的空间网络格局变化,判断不同时期中国在全球的高端制造业贸易网络地位,分析中国高端制造业网络的影响因素具有十分重要的现实意义。运用网络分析法可视化全球高端制造业空间贸易关联网络拓扑形态和关键特征,通过QAP分析贸易网络影响因素。结果表明:①全球高端制造业贸易网络呈现典型整体贸易网络结构特征,网络密度和互惠性高,联系紧密并保持良好的互通性,贸易活动较频繁;②整体网加权点强度测度表明中国在贸易网络呈现较频繁的贸易活动,并逐渐迈入网络贸易规模前列的空间格局;③个体网结构洞分析表明中国在网络中仍表现出较强的依赖性,贸易行为受其它节点的限制,中国还未成为全球高端制造业贸易网络的“织网者”;④工业增加值和地理相邻等因素对全球高端制造业贸易具有统计上的显著性影响。
袁红林 , 辛娜 . 中国高端制造业的全球贸易网络格局及其影响因素分析[J]. 经济地理, 2019 , 39(6) : 108 -117 . DOI: 10.15957/j.cnki.jjdl.2019.06.012
With the new round of scientific and technological revolution and the global industrial structure remodeling, it has strong significance to deconstruct the spatial network pattern between China's high-end manufacturing industry and developed countries, judge China's position as a global high-end manufacturing trade network in different periods, and analyze China's high-end manufacturing network. The social network analysis method is used to visualize the topological form and key features of spatial trade associated network in the global advanced manufacturing, and its influencing factors are analyzed through QAP. The results show that: 1) The global high-end manufacturing trade network presents the characteristics of a typical overall trade network structure with high network density and reciprocity, close contact and good interoperability, and frequent trade activities; 2) The weighted directional intensity measurement of the whole network indicates that China presents more frequent trade activities in the trade network and gradually enters the forefront of the spatial pattern; 3) Individual network structure hole analysis shows that China still shows stronger dependence in the network, and trade behavior is restricted by other nodes, so China has not yet become the "spinner" of the global advanced manufacturing trade network; 4) Factors such as industrial added value and geographical proximity have statistically significant effects on global advanced manufacturing trade.
表1 高端制造业网络密度与互惠性分析Tab.1 Network density and reciprocity of high-end manufacturing |
| 行业分类 | 指标 | 2002年 | 2007年 | 2011年 | 2015年 |
|---|---|---|---|---|---|
| 药品、医药化学剂和植物药材制造行业 | 节点数 | 26 | 26 | 26 | 26 |
| 连线数 | 644 | 649 | 649 | 649 | |
| 网络密度 | 0.994 | 0.999 | 0.931 | 1.000 | |
| 互惠性 | 0.988 | 0.997 | 0.997 | 0.997 | |
| 办公室、会计和计算机机械制造 | 节点数 | 26 | 26 | 26 | 26 |
| 连线数 | 637 | 638 | 625 | 632 | |
| 网络密度 | 0.980 | 0.982 | 0.962 | 0.972 | |
| 互惠性 | 0.966 | 0.975 | 0.935 | 0.963 | |
| 无线电、电视和通讯设备与装置制造 | 节点数 | 26 | 26 | 26 | 26 |
| 连线数 | 639 | 645 | 640 | 644 | |
| 网络密度 | 0.983 | 0.992 | 0.985 | 0.991 | |
| 互惠性 | 0.978 | 0.985 | 0.969 | 0.988 | |
| 医疗器械、精密仪器和光学仪器制造 | 节点数 | 26 | 26 | 26 | 26 |
| 连线数 | 647 | 649 | 649 | 650 | |
| 网络密度 | 0.995 | 0.997 | 0.999 | 0.991 | |
| 互惠性 | 0.997 | 0.994 | 0.997 | 1.000 | |
| 飞机和航天器制造 | 节点数 | 26 | 26 | 26 | 26 |
| 连线数 | 594 | 605 | 603 | 610 | |
| 网络密度 | 0.914 | 0.931 | 0.928 | 0.939 | |
| 互惠性 | 0.904 | 0.921 | 0.914 | 0.930 |
表2 QAP回归分析Tab.2 QAP regression analysis |
| 变量 | 2002年 | 2007年 | 2011年 | 2015年 | |||||||||||
|---|---|---|---|---|---|---|---|---|---|---|---|---|---|---|---|
| β | 概率1 | 概率2 | β | 概率1 | 概率2 | β | 概率1 | 概率2 | β | 概率1 | 概率2 | ||||
| iavp | 0.002 | 0.457 | 0.543 | 0.073** | 0.013 | 0.988 | 0.059** | 0.019 | 0.982 | 0.060*** | 0.006 | 0.994 | |||
| lnpgdp lnR&Dr | 0.132* 0.038** | 0.905 0.065 | 0.106 0.965 | -0.153 -0.032 | 0.708 0.812 | 0.292 0.346 | -0.009 -0.032 | 0.622 0.832 | 0.379 0.312 | 0.001 0.026 | 0.515 0.398 | 0.486 0.692 | |||
| htp | 0.071*** | 0.001 | 1.000 | 0.042* | 0.101 | 0.899 | -0.012 | 0.634 | 0.366 | -0.030 | 0.848 | 0.153 | |||
| lnfdi | 0.068*** | 0.001 | 0.999 | -0.048* | 0.835 | 0.105 | -0.008 | 0.635 | 0.475 | 0.052** | 0.042 | 0.936 | |||
| gei | -0.082** | 0.965 | 0.035 | 0.067 | 0.234 | 0.767 | 0.082 | 0.244 | 0.757 | 0.052 | 0.245 | 0.755 | |||
| lawi | 0.104** | 0.040 | 0.960 | -0.119 | 0.835 | 0.166 | -0.018 | 0.555 | 0.445 | -0.004 | 0.524 | 0.477 | |||
| sqi | -0.136*** | 0.995 | 0.005 | 0.009 | 0.457 | 0.544 | -0.055 | 0.747 | 0.253 | -0.071* | 0.896 | 0.105 | |||
| dfri | 0.046 | 0.120 | 0.880 | 0.005 | 0.461 | 0.539 | -0.078 | 0.871 | 0.129 | -0.066* | 0.930 | 0.071 | |||
| lnpopulation | -0.081 | 0.994 | 0.007 | 0.033 | 0.191 | 0.811 | 0.071* | 0.073 | 0.928 | 0.063* | 0.086 | 0.914 | |||
| geography0-1 | 0.156** | 0.035 | 0.966 | 0.154** | 0.034 | 0.966 | 0.149** | 0.038 | 0.963 | 0.110** | 0.071 | 0.929 | |||
| 样本量 | 650 | 650 | 650 | 650 | |||||||||||
| R-square | 0.051 | 0.049 | 0.042 | 0.029 | |||||||||||
| Adj R-Sqr | 0.038 | 0.035 | 0.029 | 0.016 | |||||||||||
注:***、**、*分别表示在1%、5%、10%的统计水平上显著。表3同。 |
表3 稳健性检验分析Tab.3 Robustness test analysis |
| 变量 | 断点值取进出口贸易额80% | 断点值取进出口贸易额120% | |||||||
|---|---|---|---|---|---|---|---|---|---|
| 2002年 | 2007年 | 2011年 | 2015年 | 2002年 | 2007年 | 2011年 | 2015年 | ||
| iawp | 0.001 | 0.050** | 0.113** | 0.089*** | 0.028 | 0.071*** | 0.073** | 0.070** | |
| lnpgdp | 0.083** | 0.012 | 0.137 | 0.002 | 0.020 | -0.041 | -0.028 | -0.018 | |
| lnR&Dr | 0.013 | 0.047* | -0.135 | 0.092** | 0.027 | -0.087** | -0.045 | 0.069 | |
| htp | 0.082** | -0.014 | 0.047 | -0.050 | 0.095*** | 0.016 | 0.004 | -0.023 | |
| lnfdi | 0.062** | -0.037** | 0.016 | -0.021 | 0.007 | -0.045** | -0.007 | -0.012 | |
| gei | 0.006 | 0.009 | 0.307 | -0.026 | -0.014 | -0.023 | -0.001 | -0.030 | |
| lawi | 0.181** | 0.113* | 0.175 | -0.135* | -0.001 | 0.188* | -0.133 | -0.044 | |
| sgi | 0.049 | 0.058 | 0.102* | 0.091 | -0.129** | 0.073 | 0.047 | 0.013 | |
| dfri | 0.327*** | -0.038 | -0.259** | -0.062 | 0.150*** | 0.043 | -0.016 | -0.071 | |
| lnpopulation | 0.230*** | -0.029 | -1.852 | 0.057 | 0.079** | -0.001 | 0.058 | -0.012 | |
| geography0-1 | 0.117** | 0.134** | 0.150 | 0.097* | 0.150** | 0.113* | 0.117** | 0.080* | |
| R-square | 0.045 | 0.053 | 0.049 | 0.023 | 0.042 | 0.051 | 0.047 | 0.027 | |
| Adj-spr | 0.038 | 0.046 | 0.043 | 0.021 | 0.039 | 0.048 | 0.041 | 0.025 | |
| 样本量 | 650 | 650 | 650 | 650 | 650 | 650 | 650 | 650 | |
| [1] |
|
| [2] |
段文奇, 刘宝全, 季建华. 国际贸易网络拓扑结构的演化[J]. 系统工程理论与实践, 2008(10):71-81.
|
| [3] |
|
| [4] |
|
| [5] |
|
| [6] |
陈银飞. 2000—2009年世界贸易格局的社会网络分析[J]. 国际贸易问题, 2011(11):31-41.
|
| [7] |
王开, 靳玉英. 全球FTA网络形成机制研究[J]. 财贸经济, 2013(9):103-111.
|
| [8] |
辛娜, 袁红林. 全球价值链嵌入与全球高端制造业网络地位:基于增加值贸易视角[J]. 改革, 2019(3):61-71.
|
| [9] |
罗仕龙, 龚凯, 邢欣, 等. 基于社会网络分析法的国际贸易网络结构及演化研究[J]. 中国管理科学, 2016(12):698-702.
|
| [10] |
许和连, 孙天阳, 成丽红. “一带一路”高端制造业贸易格局及影响因素研究[J]. 财贸经济, 2015(12):74-87.
|
| [11] |
赵国钦, 万方. 世界贸易网络演化及其解释——基于网络分析方法[J]. 宏观经济研究, 2016(4):151-157.
|
| [12] |
|
| [13] |
|
| [14] |
|
/
| 〈 |
|
〉 |