
山西省旅游交通碳排放测度及其演变机理
|
马慧强(1984—),男,山西大同人,博士,博士后,副教授。主要研究方向为旅游地理、经济地理。E-mail:mahuiqiang001@126.com。 |
收稿日期: 2018-07-25
修回日期: 2019-01-18
网络出版日期: 2025-04-23
基金资助
教育部人文社会科学基金项目(16YJC890016)
2019年度教育部人文社会科学研究规划基金项目(2556)
山西省哲学社会科学2015年度规划课题(晋规办[2015]3号)
Carbon Emission and Evolution Mechanism of Tourism Transportation in Shanxi Province
Received date: 2018-07-25
Revised date: 2019-01-18
Online published: 2025-04-23
利用世界旅游组织(UNWTO)的计算方法,以山西省为案例地,测度2004—2015年山西省铁路、公路、民航等旅游交通碳排放量及其演化过程;同时利用Kaya等式和LMDI分解模型分析测算山西省旅游交通碳排放的影响因素,从游客数量、人均旅游消费水平、旅游产业对生产总值的贡献率、单位GDP客运交通周转量、单位客运交通周转量能耗、能源结构六大方面,测度并探讨山西省旅游交通碳排放的主要机理,分析结果显示:促进旅游交通碳排放增长的主要影响因素是游客数量、人均旅游消费水平和单位交通周转量的能耗;旅游产业的产值占GDP比重、单位 GDP客运交通周转量和能源结构是有效抑制碳排放增长的因素。
马慧强 , 刘嘉乐 , 弓志刚 . 山西省旅游交通碳排放测度及其演变机理[J]. 经济地理, 2019 , 39(4) : 223 -231 . DOI: 10.15957/j.cnki.jjdl.2019.04.027
Tourism carbon emissions with the rapid development of tourism increase year by year. In the context of energy conservation and emission reduction, how to better achieve the carbon reduction of tourism is an urgent issue to be concerned about. In this paper, We take Shanxi Province as research area and measure its carbon emissions in tourism transportation and evolution process of railway traffic, highway and civil aviation from 2004 to 2015 utilizing the method of World Tourism Organization(UNWTO). At the same time, we analyze the influencing factors of tourism traffic carbon emissions in Shanxi Province by the methods of Kaya equation decomposition and LMDI model. From the tourist amount, the level of per capita tourism consumption, the contribution rate of the tourism industry to the GDP, turnover of passenger per unit GDP, energy consumption per unit turnover of passenger, energy structure, we explore the main factors affecting the carbon emissions of tourism transportation in Shanxi Province. The results show: tourist amount, the level of per capita tourism consumption and energy consumption per unit turnover of passenger are the main factors that cause the growth of tourism traffic, while the contribution rate of tourism industry to the GDP, turnover of passenger per unit GDP and energy structure have a negative effect on carbon emissions of tourism traffic. It is hoped that it can provide decision-making reference for the implementation of the corresponding policies and emission reduction measures of regional "low-carbon tourism".
表1 2004—2015年山西省旅客周转量(单位:万人/km)Tab.1 Turnover volume of passenger in Shanxi Province from 2004 to 2015 |
| 年份 | 旅客周转量 | 合计 | ||
|---|---|---|---|---|
| 铁路 | 公路 | 民航 | ||
| 2004 | 1 049 000 | 1 801 544 | 145 380 | 2 995 924 |
| 2005 | 1 056 422 | 1 809 406 | 169 833 | 3 035 661 |
| 2006 | 1 104 390 | 1 897 094 | 144 739 | 3 146 223 |
| 2007 | 1 225 343 | 2 071 400 | 68 705 | 3 365 448 |
| 2008 | 1 343 296 | 2 425 444 | 74 654 | 3 843 394 |
| 2009 | 1 417 639 | 2 103 170 | 93 706 | 3 614 515 |
| 2010 | 1 558 206 | 2 157 019 | 107 828 | 3 823 053 |
| 2011 | 1 957 808 | 2 199 108 | 124 077 | 4 280 993 |
| 2012 | 1 899 000 | 2 399 000 | 142 776 | 4 440 776 |
| 2013 | 1 898 201 | 1 966 203 | 157 053 | 4 021 457 |
| 2014 | 2 023 842 | 1 819 920 | 188 464 | 4 032 226 |
| 2015 | 2 154 182 | 1 645 324 | 216 733 | 4 016 239 |
注:资料来源于2005—2016年《山西省统计年鉴》。表2同。 |
表2 2004—2015 年山西省旅游交通碳排放情况Tab.2 Carbon emissions of tourism traffic in Shanxi Province from 2004 to 2015 |
| 年份 | 交通碳排放量/Mt | 合计 | 游客人均 (kg/人) | ||
|---|---|---|---|---|---|
| 铁路 | 公路 | 民航 | |||
| 2004 | 0.0895 | 0.3307 | 0.1289 | 0.5490 | 9.84 |
| 2005 | 0.0901 | 0.3321 | 0.1505 | 0.5728 | 8.75 |
| 2006 | 0.0942 | 0.3482 | 0.1283 | 0.5707 | 7.59 |
| 2007 | 0.1045 | 0.3802 | 0.0609 | 0.5456 | 6.40 |
| 2008 | 0.1146 | 0.4452 | 0.0662 | 0.6259 | 6.67 |
| 2009 | 0.1210 | 0.3860 | 0.0831 | 0.5900 | 5.56 |
| 2010 | 0.1329 | 0.3959 | 0.0956 | 0.6244 | 5.00 |
| 2011 | 0.1670 | 0.4036 | 0.1100 | 0.6806 | 4.54 |
| 2012 | 0.1620 | 0.4403 | 0.1266 | 0.7289 | 3.75 |
| 2013 | 0.1390 | 0.3608 | 0.1620 | 0.6620 | 2.69 |
| 2014 | 0.1730 | 0.3340 | 0.1671 | 0.6738 | 2.25 |
| 2015 | 0.1830 | 0.3020 | 0.1921 | 0.6779 | 1.88 |
表3 山西省旅游交通碳排放量影响因素(2004—2015年)Tab.3 Influencing factors of carbon emissions of travel traffic in Shanxi Province from 2004 to 2015 |
| 年份 | CO2 (万t) | P (亿人次) | R (亿元) | GDP (亿元) | T (亿人·km) | E (万t) |
|---|---|---|---|---|---|---|
| 2004 | 365.95 | 0.56 | 199.77 | 3 571 | 299.60 | 367.52 |
| 2005 | 444.91 | 0.66 | 291.99 | 4 230 | 303.57 | 453.27 |
| 2006 | 498.49 | 0.75 | 428.39 | 4 878 | 314.62 | 500.13 |
| 2007 | 520.70 | 0.85 | 581.57 | 6 024 | 336.54 | 514.00 |
| 2008 | 622.19 | 0.94 | 739.32 | 7 315 | 384.33 | 717.25 |
| 2009 | 708.33 | 1.07 | 892.53 | 7 358 | 361.45 | 863.89 |
| 2010 | 734.71 | 1.26 | 1 083.46 | 9 200 | 382.31 | 889.59 |
| 2011 | 782.96 | 1.50 | 1 342.59 | 11 237 | 415.81 | 933.99 |
| 2012 | 812.23 | 1.94 | 1 813.01 | 12 112 | 444.08 | 978.74 |
| 2013 | 857.75 | 2.47 | 2 305.44 | 12 665 | 386.44 | 1 027.88 |
| 2014 | 862.50 | 3.00 | 2 846.51 | 12 761 | 384.38 | 1 012.54 |
| 2015 | 860.56 | 3.60 | 3 447.50 | 12 766 | 379.95 | 1 052.99 |
注:CO2表示二氧化碳排放量;P代表游客数量;R代表旅游收入;GDP代表生产总值;T代表客运周转量;E代表交通能源消耗量。 |
表4 山西省旅游交通碳排放影响因素分解结果(2004—2015年)(单位:万t)Tab.4 The decomposition results of factors influencing carbon emissions of tourism traffic in Shanxi Province from 2004 to 2015 |
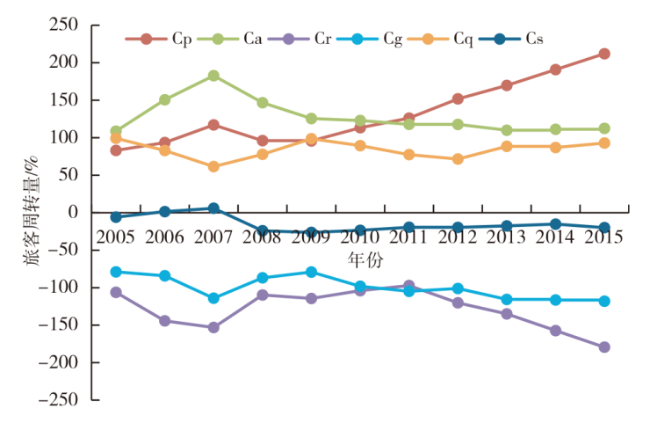
| 年份 | ΔCp | ΔCa | ΔCr | ΔCg | ΔCq | ΔCs | ΔCO2 |
|---|---|---|---|---|---|---|---|
| 2004 | 0 | 0 | 0 | 0 | 0 | 0 | 0 |
| 2005 | 66.25 | 86.80 | -84.76 | -62.98 | 79.26 | -4.74 | 79.82 |
| 2006 | 124.81 | 201.11 | -192.67 | -112.35 | 110.73 | 1.91 | 133.54 |
| 2007 | 182.09 | 284.18 | -238.09 | -177.43 | 95.64 | 9.17 | 155.54 |
| 2008 | 247.14 | 377.25 | -282.23 | -223.32 | 200.21 | -61.88 | 257.17 |
| 2009 | 328.64 | 431.13 | -392.83 | -271.68 | 338.54 | -90.42 | 343.38 |
| 2010 | 418.92 | 454.51 | -384.55 | -362.95 | 330.73 | -86.86 | 369.80 |
| 2011 | 527.75 | 492.74 | -406.45 | -438.47 | 324.01 | -81.28 | 418.31 |
| 2012 | 678.94 | 526.25 | -537.81 | -452.33 | 320.17 | -87.83 | 447.39 |
| 2013 | 836.42 | 542.10 | -664.99 | -570.08 | 436.21 | -86.78 | 492.88 |
| 2014 | 949.61 | 553.47 | -782.54 | -579.56 | 432.40 | -75.73 | 497.65 |
| 2015 | 1 048.01 | 556.20 | -886.67 | -583.70 | 459.03 | -98.45 | 494.60 |
注: Cp、 Ca、 Cr、 Cg、 Cq、 Cs分别表示游客人数、人均旅游消费水平、旅游产业对生产总值的贡献、单位GDP客运交通周转量、单位客运交通周转量能耗及能源结构要素, CO2表示从基年到第t年的交通碳排放变化(万t)。 |
表5 2004—2015年山西省旅游交通碳排放影响因素贡献率/%Tab.5 Contribution rate of influencing factors to carbon emissions of tourism traffic in Shanxi Province from 2004 to 2015 /% |
| 年份 | Cp | Ca | Cr | Cg | Cq | Cs |
|---|---|---|---|---|---|---|
| 2005 | 83.00 | 108.74 | -106.19 | -78.91 | 99.29 | -5.94 |
| 2006 | 93.46 | 150.60 | -144.28 | -84.13 | 82.92 | 1.43 |
| 2007 | 117.07 | 182.70 | -153.08 | -114.07 | 61.49 | 5.90 |
| 2008 | 96.10 | 146.70 | -109.75 | -86.84 | 77.85 | -24.06 |
| 2009 | 95.71 | 125.56 | -114.40 | -79.12 | 98.59 | -26.33 |
| 2010 | 113.28 | 122.91 | -103.99 | -98.15 | 89.43 | -23.49 |
| 2011 | 126.16 | 117.79 | -97.17 | -104.82 | 77.46 | -19.43 |
| 2012 | 151.76 | 117.73 | -120.21 | -101.1 | 71.56 | -19.63 |
| 2013 | 169.70 | 109.99 | -134.92 | -115.66 | 88.50 | -17.61 |
| 2014 | 190.82 | 111.22 | -157.25 | -116.46 | 86.89 | -15.22 |
| 2015 | 211.98 | 112.49 | -179.34 | -118.06 | 92.85 | -19.91 |
表6 山西省旅游交通碳排放影响因素与旅游交通碳排放总量相关系数Tab.6 Correlation coefficients between the influencing factors and overall carbon emissions of tourism traffic in Shanxi Province |
| 年份 | 游客规模 与CO2 | 人均旅游消费 水平与CO2 | 单位客运交通 周转量与CO2 | 旅游产业对生产总值 的贡献与CO2 | 单位GDP客运交通 周转量与CO2 | 能源结构 系数与CO2 | |
|---|---|---|---|---|---|---|---|
| 2004—2015 | r0.001=0.8233 | 0.84027 | 0.97106 | 0.96662 | -0.95289 | -0.98401 | 0.67967 |
| [1] |
马彩虹, 邹淑燕, 赵晶, 等. 西北地区能源消费碳排放时空差异分析及地域类型划分[J]. 经济地理, 2016, 36(12):162-168.
|
| [2] |
王喜, 张艳, 秦耀辰, 等. 我国碳排放变化影响因素的时空分异与调控[J]. 经济地理, 2016, 36(8):158-165.
|
| [3] |
李建豹, 黄贤金, 吴常艳, 等. 中国省域碳排放影响因素的空间异质性分析[J]. 经济地理, 2015, 35(11):21-28.
|
| [4] |
陆化普. 城市绿色交通的实现途径[J]. 城市交通, 2009, 7(6):23-27.
|
| [5] |
何吉成, 李耀增. 1975—2005年中国铁路机车的CO2排放量[J]. 气候变化研究进展, 2010, 6(1):35-39.
|
| [6] |
明庆忠, 陈英, 李庆雷. 低碳旅游:旅游产业生态化的战略选择[J]. 人文地理, 2010, 25(5):22-26,127.
|
| [7] |
石培华, 吴普. 中国旅游业能源消耗与CO2排放量的初步估算[J]. 地理学报, 2011, 66(2):235-243.
|
| [8] |
|
| [9] |
魏艳旭, 孙根年, 马丽君, 等. 中国旅游交通碳排放及地区差异的初步估算[J]. 陕西师范大学学报:自然科学版, 2012, 40(2):76-84.
|
| [10] |
肖潇, 张捷, 卢俊宇, 等. 旅游交通碳排放的空间结构与情景分析[J]. 生态学报, 2012(23): 7 540-7 548.
|
| [11] |
李伯华, 刘云鹏, 窦银娣. 旅游风景区旅游交通系统碳足迹评估及影响因素分析——以南岳衡山为例[J]. 资源科学, 2012(5):956-963.
|
| [12] |
陶玉国, 黄震方, 史春云. 基于替代式自下而上法的区域旅游交通碳排放测度[J]. 生态学报, 2015, 35(12):4 224-4 233.
|
| [13] |
包战雄, 袁书琪, 陈光水. 不同游客吸引半径景区国内旅游交通碳排放特征比较[J]. 地理科学, 2012(10): 1 168-1 175.
|
| [14] |
王佳, 薛景洁. 旅游交通碳排放测算及影响因素分析[J]. 统计与决策, 2016(13):61-64.
|
| [15] |
丁长安, 田红. 山东省旅游交通碳排放量估算及结果分析[J]. 对外经贸, 2015(2):52-54.
|
| [16] |
孙晋坤, 章锦河, 刘泽华, 等. 区域旅游交通碳排放测度模型及实证分析[J]. 生态学报, 2015, 35(21):7 161-7 171.
|
| [17] |
郭朝先. 中国碳排放因素分解:基于LMDI分解技术[J]. 中国人口·资源与环境, 2010, 20(12):4-9.
|
| [18] |
陈昆仑, 郭宇琪, 刘小琼, 等. 长江经济带工业废水排放的时空格局演化及驱动因素[J]. 地理科学, 2017, 37(11):1 668-1 677.
|
| [19] |
王开, 傅利平. 京津冀产业碳排放强度变化及驱动因素研究[J]. 中国人口·资源与环境, 2017, 27(10):115-121.
|
| [20] |
|
| [21] |
王微, 林剑艺, 崔胜辉, 等. 碳足迹分析方法研究综述[J]. 环境科学与技术, 2010, 33(7):71-78.
|
| [22] |
UNWTO, UNEP, WMO. Climate Change and Tourism:Responding to Global Challenges[M]. Madrid:UNWTO, 2008.
|
| [23] |
吴文化. 我国交通运输行业能源消费和碳排放与典型国家的比较[J]. 中国能源, 2007, 29(10):19-22.
|
| [24] |
|
| [25] |
|
| [26] |
|
| [27] |
|
| [28] |
|
| [29] |
汪宏韬. 基于LMDI的上海市能源消费碳排放实证分析[J]. 中国人口·资源与环境, 2010, 20(S2):143-146.
|
| [30] |
吴开亚, 何彩虹, 王桂新, 等. 上海市交通能源消费碳排放的测算与分解分析[J]. 经济地理, 2012, 32(11):45-51.
|
| [31] |
徐国泉, 刘则渊, 姜照华. 中国碳排放的因素分解模型及实证研究:1995—2004[J]. 中国人口·资源与环境, 2006, 16(6):158-161.
|
| [32] |
张雷. 经济发展对碳排放的影响[J]. 地理学报, 2003, 58(4):629-637.
|
/
| 〈 |
|
〉 |