
城市社区建成环境对居民日常出行行为的影响分析
|
杨励雅(1978—),女,安徽亳州人,博士,副教授。主要研究方向为交通与土地利用。E-mail:yangliya@ruc.edu.cn。 |
收稿日期: 2018-10-09
修回日期: 2018-12-02
网络出版日期: 2025-04-23
基金资助
国家自然科学基金项目(71473259)
Impact of Residential Built Environment on Daily Travel Behavior
Received date: 2018-10-09
Revised date: 2018-12-02
Online published: 2025-04-23
杨励雅 , 王振波 . 城市社区建成环境对居民日常出行行为的影响分析[J]. 经济地理, 2019 , 39(4) : 101 -108 . DOI: 10.15957/j.cnki.jjdl.2019.04.013
Existing studies that examines the built environment and travel behavior has frequently found inconsistent results, which can be attributed to the different treatments of travel purposes. This paper investigates the extent to which residential built environment influences trip-chaining behavior if travel purposes are differentiated. Using trip chain as the analysis unit of travel, three travel purposes were classified: subsistence, maintenance and recreation, based on the data from the Forth Beijing Resident Travel Survey. With the independent variables from both individual and residential levels, hierarchical linear model is applied respectively to estimate travel distance and major travel mode of a trip chain for all three travel purposes. The results showed that the influence of residential built environment on either travel distance or travel mode is highly conditional on travel purpose. The residential built environment has the greatest influence on the subsistence trip chain, followed by maintenance trip chain, while the recreation trip chainis barely affected. Additionally, two spatial variables, "distance from the city center" and "public transit density", have the largest effects on subsistence trip chain, while the "land use mix index" influences maintenance trip chain strongly. Compared to the former research on the relationship between residential built environment and travel behavior, this paper subdivides the travel purpose and takes the trip chain as an analysis unit. These findings have important implications for urban planning and traffic management policies.
表1 城市社区建成环境变量的描述统计—均值(标准差)Tab.1 Statistics for the residential built environment variables |
| 变量名 | 变量说明 | 样本类别 | ||
|---|---|---|---|---|
| 生计出行链 Mean(Std.) | 生活出行链 Mean(Std.) | 娱乐出行链 Mean(Std.) | ||
| 人口密度 | 居住地所在交通小区的人口密度,1 000人/km2 | 12.2(6.9) | 10.7(8.0) | 10.0(7.2) |
| 土地混合利用指数 | 居住地所在交通小区的土地混合利用程度,是一个用“熵”表示的指数[1],取值范围0~1,越接近于1,混合利用程度越大 | 0.67(0.22) | 0.57(0.38) | 0.62(0.35) |
| 道路网密度 | 居住地所在交通小区的城市道路密度,单位为km/km2 | 5.4(2.7) | 5.5(3.0) | 5.3(2.8) |
| 公交线网密度 | 居住地所在交通小区的公共交通线网密度,包括地面公交线网和轨道交通线网,单位为km/km2 | 4.7(2.7) | 4.5(3.2) | 4.4(2.8) |
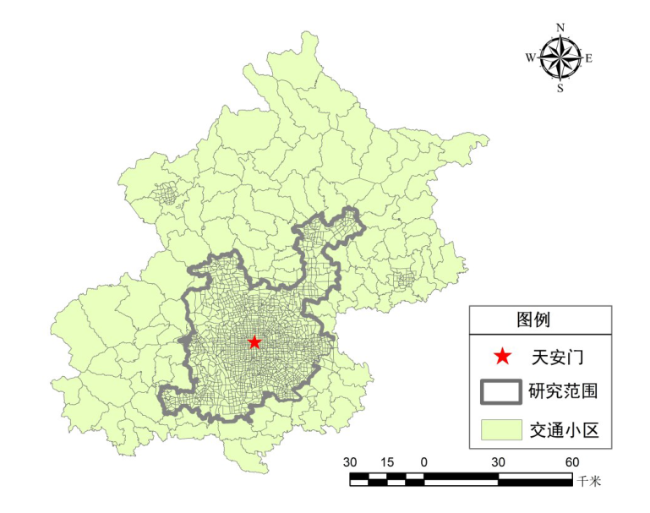
| 距中心区距离 | 居住地所在交通小区质心距离天安门(北京城区传统中心点)的直线距离,单位为km | 15.3(7.8) | 18.0(11.5) | 16.5(8.4) |
| 样本个数 | 2 040 | 1 428 | 1 012 | |
表2 同时引入个人层次和空间层次变量的分层模型(出行距离为因变量)Tab.2 Hierarchical model of travel distance with individual and built environment variables |
| 生计出行链 | 生活出行链 | 娱乐出行链 | ||||||||
|---|---|---|---|---|---|---|---|---|---|---|
| 估计值 | P值 | 估计值 | P值 | 估计值 | P值 | |||||
| 截距 | 5.532 | p<0.010 | -6.190 | p<0.010 | -8.112 | p<0.010 | ||||
| 个人层次固定效应 | 年龄 | AGE1(18~34) | -0.178 | 0.356 | -0.204 | 0.218 | -0.028 | 0.400 | ||
| AGE2(35~54)(ref) | / | / | / | / | / | / | ||||
| AGE3(≥55) | -1.324 | 0.232 | -2.270* | p<0.050 | -3.325* | p<0.050 | ||||
| 是否拥有小汽车 | Yes | 1.019 | 0.115 | 2.089* | p<0.050 | 5.004* | p<0.010 | |||
| No(ref) | / | / | / | / | / | / | ||||
| 性别 | MALE(ref) | / | / | / | / | / | / | |||
| FEMALE | -0.657 | 0.294 | 2.814* | p<0.050 | 0.945 | 0.135 | ||||
| 月收入 | INCOME1(≤5 000 RMB) | -0.553 | 0.369 | 0.031 | 0.465 | -2.420* | p<0.050 | |||
| INCOME2(5 001~10 000 RMB)(ref) | / | / | / | / | / | / | ||||
| INCOME3(≥10 001 RMB) | 1.211 | 0.175 | 2.259* | p<0.050 | 4.937* | p<0.050 | ||||
| 房屋产权 | SELFHOUSE | 2.204* | p<0.050 | 2.230* | p<0.050 | 2.859* | p<0.050 | |||
| RENTHOUSE(ref) | / | / | / | / | / | / | ||||
| 是否有学龄儿童 | KIDS | 1.846 | 0.125 | 4.208* | p<0.050 | 3.089* | p<0.050 | |||
| NONKIDS(ref) | / | / | / | / | / | / | ||||
| 家庭规模(人) | -0.945 | 0.230 | -1.303 | 0.300 | 3.552* | p<0.050 | ||||
| 空间层次固定效应 | 人口密度(千人/km2) | -3.112* | p<0.050 | -2.381* | p<0.050 | -0.852 | 0.184 | |||
| 土地混合利用指数 | -3.249* | p<0.050 | -3.145* | p<0.050 | -1.136 | 0.120 | ||||
| 道路网密度(km/km2) | -2.508* | p<0.050 | 1.700 | 0.086 | 1.854 | 0.099 | ||||
| 公交线网密度(km/km2) | -1.043 | 0.194 | 0.947 | 0.120 | 1.225 | 0.103 | ||||
| 距中心区距离(km) | 3.745** | p<0.050 | 0.321 | 0.174 | 0.818 | 0.192 | ||||
| 随机效应 | 居住区层次的随机项方差 | 3.060(0.157) | 2.306(0.329) | 0.953(0.081) | ||||||
| 个人层次的随机项方差 | 27.095(1.382) | 21.281(1.348) | 16.076(1.169) | |||||||
| 方差比例系数VPC | 10.148% | 9.777% | 5.596% | |||||||
| -2log-likehood | 3 556.122 | 2 177.953 | 2 518.454 | |||||||
| Deviance(与仅含截距项的分层模型相比) | 880.353 | 598.703 | 510.060 | |||||||
注:*表示自变量在0.05水平上显著,**表示自变量在0.01水平上显著;括号中数字为标准误差;“ref”代表分类变量中的参考类。 |
表3 同时引入个人层次和空间层次变量的分层模型(出行方式为因变量)Tab.3 Hierarchical model of travel mode with individual and built environment variables |
| 生计出行链 | 生活出行链 | 娱乐出行链 | ||||||||
|---|---|---|---|---|---|---|---|---|---|---|
| 估计值 | P值 | 估计值 | P值 | 估计值 | P值 | |||||
| 截距 | 4.348 | p<0.010 | -1.238 | p<0.010 | -4.259 | p<0.010 | ||||
| 个人层次固定效应 | 年龄 | AGE1(18~34) | -0.049 | 0.252 | -0.157 | 0.115 | -0.428** | p<0.010 | ||
| AGE2(35~54)(ref) | / | / | / | / | / | / | ||||
| AGE3(≥55) | -0.128 | 0.136 | -0.226* | p<0.050 | -0.285* | p<0.050 | ||||
| 是否拥有小汽车 | Yes | 0.363* | p<0.050 | 0.410** | p<0.010 | 0.645** | p<0.010 | |||
| No(ref) | / | / | / | / | / | / | ||||
| 性别 | MALE(ref) | / | / | / | / | / | / | |||
| FEMALE | -0.014 | 0.305 | 0.065 | 0.218 | 0.059 | 0.205 | ||||
| 月收入 | INCOME1(≤5 000 RMB) | -0.288 | 0.093 | -0.052 | 0.229 | -0.229* | p<0.050 | |||
| INCOME2(5 001~10 000 RMB)(ref) | / | / | / | / | / | / | ||||
| INCOME3(≥10 001 RMB) | 0.173 | 0.113 | 0.251* | p<0.050 | 0.330* | p<0.050 | ||||
| 房屋产权 | SELFHOUSE | 0.245 | 0.108 | 0.278* | p<0.050 | 0.251* | p<0.050 | |||
| RENTHOUSE(ref) | / | / | / | / | / | / | ||||
| 是否有学龄儿童 | KIDS | 0.309 | 0.084 | 0.112 | 0.127 | 0.236* | p<0.050 | |||
| NONKIDS(ref) | / | / | ||||||||
| 家庭规模(人) | 0.045 | 0.278 | 0.099 | 0.167 | 0.348* | p<0.050 | ||||
| 空间层次固定效应 | 人口密度(千人/km2) | -0.429* | p<0.050 | -0.250* | p<0.050 | -0.152 | 0.100 | |||
| 土地混合利用指数 | -0.455* | p<0.050 | -0.387* | p<0.050 | -0.106 | 0.134 | ||||
| 道路网密度(km/km2) | -0.088 | 0.219 | -0.019 | 0.286 | -0.074 | 0.197 | ||||
| 公交线网密度(km/km2) | -0.671* | p<0.050 | -0.198 | 0.098 | -0.215* | p<0.050 | ||||
| 距中心区距离(km) | 0.746* | p<0.050 | -0.072 | 0.204 | 0.037 | 0.230 | ||||
| 随机效应 | 居住区层次的随机项方差 | 0.772(0.103) | 0.340(0.083) | 0.115(0.035) | ||||||
| 个人层次的随机项方差 | 3.290(0.425) | 3.290(0.425) | 3.290(0.425) | |||||||
| 方差比例系数VPC | 19.005% | 9.366% | 3.378% | |||||||
| -2log-likehood | 4879.320 | 3207.334 | 2946.687 | |||||||
| Deviance(与仅含截距项的分层模型相比) | 1029.703 | 984.100 | 797.175 | |||||||
注:*表示自变量在0.05水平上显著,**表示自变量在0.01水平上显著;括号中数字为标准误差;“ref”代表分类变量中的参考类。 |
| [1] |
|
| [2] |
|
| [3] |
柴彦威, 沈洁. 基于活动分析法的人口空间行为研究[J]. 地理科学, 2008, 28(5):594-600.
|
| [4] |
|
| [5] |
|
| [6] |
|
| [7] |
|
| [8] |
|
| [9] |
|
| [10] |
|
| [11] |
|
| [12] |
|
| [13] |
|
| [14] |
|
| [15] |
[美]斯蒂芬·W. 劳登布什, 等. 分层线性模型:应用与数据分析方法(第二版)[M]. 郭志刚,等译. 北京: 社会科学文献出版社, 2007.
|
| [16] |
|
| [17] |
|
| [18] |
|
| [19] |
杨励雅, 朱晓宁. 快速城市化进程中的居民出行方式选择[J]. 中国软科学, 2012(2):71-79.
|
| [20] |
|
| [21] |
|
| [22] |
|
| [23] |
|
| [24] |
|
| [25] |
|
| [26] |
|
| [27] |
|
| [28] |
|
| [29] |
|
| [30] |
|
| [31] |
|
| [32] |
|
/
| 〈 |
|
〉 |