
长江三角洲经济增长空间溢出效应的测度与分解
|
孙晓露(1984—),女,江苏南京人,博士研究生,主要研究方向为产业经济学。E-mail:85945308@qq.com |
收稿日期: 2020-04-02
修回日期: 2020-10-03
网络出版日期: 2025-04-23
基金资助
国家自然科学基金项目(41871119)
南京大学长江三角洲经济社会发展研究中心重大项目(CYD-2020018)
Measurement and Decomposition of the Spatial Spillover Effect of Economic Growth in the Yangtze River Delta
Received date: 2020-04-02
Revised date: 2020-10-03
Online published: 2025-04-23
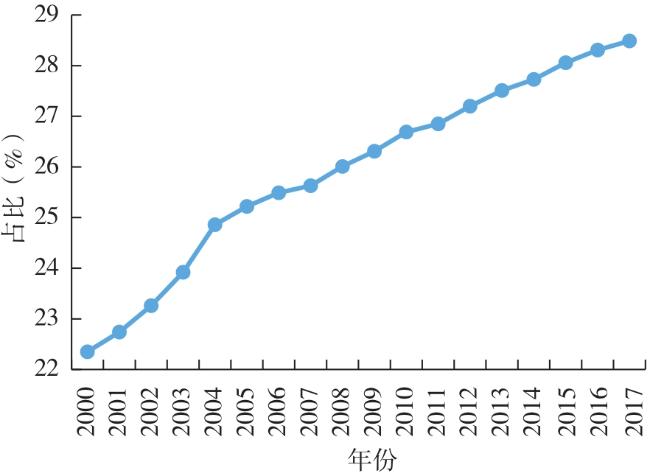
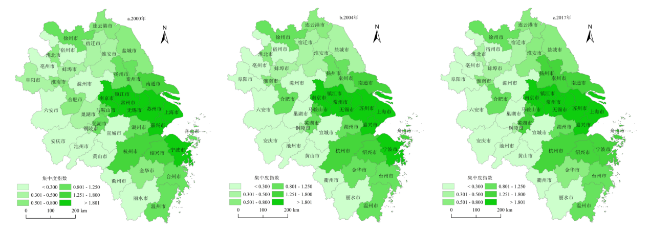
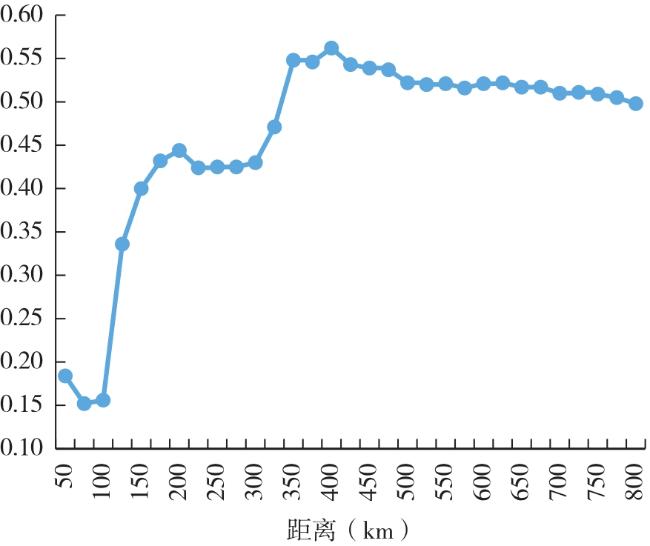
基于长江三角洲42个城市2000—2017年面板数据,在对城市群经济格局演变分析基础上,采用空间杜宾模型对城市经济增长空间溢出效应进行测算与分解。研究发现:尽管长江三角洲GDP空间分布呈现相对稳定的“核心—边缘”格局,但2000—2017年不均衡指数的下降表明扩散效应的显现。经济增长呈现显著正向空间溢出效应且表现出较强稳健性,但不同因素的效应存在差异,特别是间接效应差异更为明显。基于空间计量的空间溢出效应分解发现,核心区溢出效应显著大于边缘区,且随着一体化进程推进,溢出效应也出现明显增强;空间溢出效应随距离增加呈现“倒U”型趋势,超过400 km后溢出效应仍然较强的现象,表明一定范围内城市数量增加,有利于有效发挥空间溢出效应实现区域经济协同增长。
孙晓露 , 闫东升 . 长江三角洲经济增长空间溢出效应的测度与分解[J]. 经济地理, 2021 , 41(1) : 66 -73 . DOI: 10.15957/j.cnki.jjdl.2021.01.008
To solve the problem of regional development gaps,it is necessary to scientifically understand the relationship among the regional cities. Based on the analysis of the economic growth pattern of the Yangtze River Delta with the panel data of 42 cities from 2000 to 2017,this paper uses the Moran's I index to test the spatial autocorrelation of urban economic growth,measures and decomposes the spillover effects using the spatial Dubin model. It is found that: 1) Although the spatial distribution of GDP in the Yangtze River Delta shows a relatively stable "core-periphery" pattern,the decline of the imbalance index indicates the appearance of diffusion effects. 2) Economic growth of the Yangtze River Deltas shows a significant positive space spillover effect, and strong robustness effect. However,there are differences in the economic growth effects of different factors. 3) The spillover effect in the core area is significantly larger than the marginal area. As the integration process progress,the spillover effect increases significantly. The spatial spillover effect presents an "inverted U-shaped" trend with increase of distance,but the spillover effect is still strong after more than 400 km,indicating that the increase of the number of cities within a certain range is conducive to the effective use of the spatial spillover effect to achieve coordinated regional economic growth. The research conclusions of this paper are of enlightening significance for scientifically formulating policies to promote the narrowing of the regional development gap.
表1 模型变量说明与描述性统计Tab.1 Explanation of the variables in the model |
| 变量 | 含义 | 单位 | 样本数 | 均值 | 最大值 | 标准差 |
|---|---|---|---|---|---|---|
| 产出(Y) | GDP总量 | 亿元 | 756 | 1 654.85 | 23 727.24 | 2 567.17 |
| 劳动(L) | 就业总人口 | 万人 | 756 | 300.54 | 1 372.65 | 189.34 |
| 资本(K) | 资本存量 | 亿元 | 756 | 4 145.50 | 52 234.16 | 5 869.61 |
| 开放水平(FT) | 外贸依存度 | % | 756 | 0.34 | 2.83 | 0.44 |
| 财政水平(Fin) | 人均财政支出 | 万元 | 756 | 0.42 | 2.70 | 0.37 |
| 交通状况(Road) | 单位面积公路通行里程 | km/km2 | 756 | 1.06 | 2.44 | 0.47 |
表2 2000—2017 年城市群经济不均衡指数演变Tab.2 Evolution of the economic imbalance index in the Yangtze River Delta, 2000-2017 |
 |
表3 2000—2017年长江三角洲GDP格局的全局自相关结果Tab.3 Results of Global Moran's I for GDP of the Yangtze River Delta,2000-2017 |
| 2000 | 2001 | 2002 | 2003 | 2004 | 2005 | 2006 | 2007 | 2008 | 2009 | 2010 | 2011 | 2012 | 2013 | 2014 | 2015 | 2016 | 2017 | |
|---|---|---|---|---|---|---|---|---|---|---|---|---|---|---|---|---|---|---|
| Moran's I | 0.131 | 0.135 | 0.140 | 0.149 | 0.154 | 0.161 | 0.166 | 0.167 | 0.170 | 0.173 | 0.176 | 0.179 | 0.182 | 0.185 | 0.187 | 0.187 | 0.187 | 0.187 |
| Z(I) | 3.776 | 3.494 | 3.175 | 3.490 | 4.075 | 4.312 | 3.569 | 4.208 | 3.589 | 3.629 | 3.790 | 4.581 | 3.862 | 3.917 | 3.932 | 4.062 | 4.417 | 3.427 |
表4 空间面板模型的检验结果Tab.4 The test results of spatial panel model |
| 检验方法 | 统计量 | p值 |
|---|---|---|
| LM-lag | 49.58 | 0.000 |
| Robust LM-lag | 27.19 | 0.001 |
| LM-error | 25.16 | 0.019 |
| Robust LM-error | 49.57 | 0.029 |
| Wald-spatial lag | 83.00 | 0.000 |
| LR-spatial lag | 64.73 | 0.000 |
| Wald-spatial error | 52.18 | 0.000 |
| LR-spatial error | 89.30 | 0.000 |
| Hausman | 6.30 | 0.039 |
表5 城市群经济溢出效应的估计结果Tab.5 SDM estimation results of the prefecture level cities |
| 变量 | 估计结果 | 变量 | 估计结果 |
|---|---|---|---|
| lnL | 0.193***(9.62) | W×lnL | -0.0455(-0.31) |
| lnK | 0.796***(41.00) | W×lnK | 1.996***(7.39) |
| FT | 0.117***(4.23) | W×FT | 0.0389(0.16) |
| Fin | 0.104**(2.27) | W×Fin | -1.127***(-3.37) |
| Road | 0.199***(6.37) | W×Road | 0.183(0.86) |
| Adj.R2 | 0.959 | ρ | 0.498***(6.53) |
| Log L | 642.298 | 观测值 | 756 |
注:*、**、***分别表示1%、5%、10%显著性水平,括号内为t统计量,下同。 |
表6 不同空间权重矩阵的估计结果Tab.6 Estimation results of different spatial weight matrix |
| 变量 | 邻接矩阵 | 距离平方 | 变量 | 邻接矩阵 | 距离平方 |
|---|---|---|---|---|---|
| lnL | 0.180***(8.39) | 0.196***(9.48) | W×lnL | -0.0975**(-1.96) | -0.0795(-1.22) |
| lnK | 0.789***(37.12) | 0.783***(38.80) | W×lnK | 0.342***(5.58) | 0.636***(5.57) |
| FT | 0.157***(5.32) | 0.119***(4.10) | W×FT | -0.0102(-0.23) | 0.0611(0.61) |
| Fin | 0.132***(2.65) | 0.132***(2.75) | W×Fin | -0.526***(-4.85) | -0.716***(-4.27) |
| Road | 0.224***(6.29) | 0.183***(5.49) | W×Road | -0.0314(-0.52) | 0.0968(1.03) |
| Adj.R2 | 0.959 | 0.960 | ρ | 0.323*** | 0.494*** |
| Log L | 610.147 | 641.574 | (7.54) | (19.33) |
表7 城市群空间杜宾模型的效应分解Tab.7 SDM effects decomposition results of the prefecture level cities |
| 变量 | 总效应 | 直接效应 | 间接效应 |
|---|---|---|---|
| lnL | 0.0591(0.99) | 0.202***(9.46) | -0.143**(-2.18) |
| lnK | 1.152***(20.14) | 0.773***(34.89) | 0.379***(5.71) |
| FT | 0.0573(0.58) | 0.122***(4.19) | -0.0645(-0.60) |
| Fin | -0.424(-1.05) | 0.136***(2.78) | -0.560***(-3.59) |
| Road | 0.154*(1.87) | 0.204***(5.69) | -0.0498(-0.47) |
表8 不同区域的经济增长的空间杜宾模型估计结果Tab.8 SDM estimation results of economic growth in different regions |
| 变量 | 核心区 | 边缘区 |
|---|---|---|
| lnL | 0.426***(12.21) | 0.216***(7.89) |
| lnK | 0.638***(21.52) | 0.713***(29.03) |
| FT | 0.155***(5.88) | 0.420***(4.39) |
| Fin | 0.253***(5.21) | 0.448***(4.75) |
| Road | 0.0611**(2.25) | 0.324***(7.43) |
| Adj.R2 | 0.977 | 0.919 |
| Log L | 563.815 | 350.044 |
| W×lnL | 0.403(1.08) | -0.740***(-3.90) |
| W×lnK | 0.911***(2.66) | 1.235***(5.20) |
| W×FT | 0.456**(2.31) | -2.709***(-3.28) |
| W×Fin | -3.550***(-7.26) | -3.501***(-7.64) |
| W×Road | 0.164(0.78) | -1.037***(-3.30) |
| ρ | 0.785***(19.34) | 0.297***(3.19) |
| 观测值 | 288 | 468 |
表9 不同时期的经济增长的空间杜宾模型估计结果Tab.9 SDM estimation results for economic growth in different periods |
| 变量 | 2000—2008 | 2008—2017 |
|---|---|---|
| lnL | 0.210***(8.52) | 0.347***(5.06) |
| lnK | 0.748***(33.16) | 0.879***(30.71) |
| FT | 0.175***(4.14) | 0.164***(3.69) |
| Fin | 0.952***(3.64) | 0.512***(5.94) |
| Road | 0.133***(3.17) | 2.362***(5.73) |
| Adj.R2 | 0.969 | 0.942 |
| Log L | 496.238 | 666.558 |
| W×lnL | -0.582***(-3.16) | 0.441*(1.78) |
| W×lnK | 1.764***(5.08) | 2.567***(6.23) |
| W×FT | 1.262***(2.65) | -1.078***(-2.82) |
| W×Fin | -4.081**(-2.53) | -0.788(-1.59) |
| W×Road | 0.341(1.33) | -0.371(-1.16) |
| ρ | 0.282*(1.93) | 0.781***(13.40) |
| 观测值 | 378 | 420 |
| [1] |
|
| [2] |
闫东升, 王晖, 孙伟. 长江三角洲区域发展差距时空演变驱动因素研究[J]. 长江流域资源与环境, 2019, 28(3):517-529.
|
| [3] |
|
| [4] |
毕秀晶, 宁越敏. 长三角大都市区空间溢出与城市群集聚扩散的空间计量分析[J]. 经济地理, 2013, 33(1):46-53.
|
| [5] |
孙斌栋, 丁嵩. 大城市有利于小城市的经济增长吗?——来自长三角城市群的证据[J]. 地理研究, 2016, 35(9):1615-1625.
|
| [6] |
张可. 经济集聚与区域创新的交互影响及空间溢出[J]. 金融研究, 2019(5):96-114.
|
| [7] |
段学军, 虞孝感, 刘新. 长江三角洲地区30年来区域发展特征初析[J]. 经济地理, 2009, 29(2):185-192.
|
| [8] |
沈惊宏, 余兆旺, 石张宇, 等. 多尺度的泛长江三角洲经济空间格局演变[J]. 经济地理, 2016, 36(2):19-26.
|
| [9] |
秦贤宏, 段学军. 长三角极化区形成过程中的经济梯度演变特征及政策启示[J]. 长江流域资源与环境, 2018, 27(6):1179-1185.
|
| [10] |
|
| [11] |
张学良. 长三角地区经济收敛及其作用机制:1993-2006[J]. 世界经济, 2010(3):126-140.
|
| [12] |
任宏, 李振坤. 中国三大城市群经济增长的影响因素及其空间效应[J]. 城市问题, 2019(10):63-68.
|
| [13] |
王承云, 孙飞翔. 长三角城市创新空间的集聚与溢出效应[J]. 地理研究, 2017, 36(6):1042-1052.
|
| [14] |
汪聪聪, 王益澄, 马仁锋, 等. 经济集聚对雾霾污染影响的空间计量研究——以长江三角洲地区为例[J]. 长江流域资源与环境, 2019, 28(1):1-11.
|
| [15] |
张新林, 仇方道, 王长建, 等. 长三角城市群工业生态效率空间溢出效应及其影响因素[J]. 长江流域资源与环境, 2019, 28(8):1791-1800.
|
| [16] |
张安驰, 范从来. 空间自相关性与长三角区域一体化发展的整体推进[J]. 现代经济探讨, 2019(8):15-24.
|
| [17] |
王少剑, 王洋, 赵亚博. 1990年来广东区域发展的空间溢出效应及驱动因素[J]. 地理学报, 2015, 70(6):965-979.
|
| [18] |
贾占华, 谷国锋. 东北地区经济结构失衡水平评价及其对经济增长的影响研究——基于空间计量模型分析[J]. 地理科学, 2019, 39(4):636-643.
|
| [19] |
徐冬, 黄震方, 黄睿. 基于空间面板计量模型的雾霾对中国城市旅游流影响的空间效应[J]. 地理学报, 2019, 74(4):814-830.
|
| [20] |
席强敏, 李国平. 京津冀生产性服务业空间分工特征及溢出效应[J]. 地理学报, 2015, 70(12):1926-1938.
|
| [21] |
|
| [22] |
闫东升, 杨槿, 高金龙. 长江三角洲人口与经济的非均衡格局及其影响因素研究[J]. 地理科学, 2018, 38(3):376-384.
|
| [23] |
汪浩瀚, 徐建军. 市场潜力、空间溢出与制造业集聚[J]. 地理研究, 2018, 37(9):1736-1750.
|
| [24] |
张军, 吴桂英, 张吉鹏. 中国省际物质资本存量估算:1952-2000[J]. 经济研究, 2004(10):35-44.
|
| [25] |
单豪杰. 中国资本存量K的再估算:1952-2006年[J]. 数量经济技术经济研究, 2008(10):17-31.
|
| [26] |
|
| [27] |
程开明, 章雅婷. 中国城市创新空间溢出效应测度及分解[J]. 科研管理, 2018, 39(12):86-94.
|
/
| 〈 |
|
〉 |