
新框架核算下中国省级绿色GDP增长时空演变及驱动
|
尹向飞(1974—),男,湖南邵阳人,博士,教授,主要研究方向为全要素生产率。E-mail:448560773@qq.com |
收稿日期: 2020-03-16
修回日期: 2020-12-09
网络出版日期: 2025-04-23
基金资助
国家社会科学基金一般项目(17BJL119)
湖南省社会科学成果评审委员会课题(XSP17YBZZ072)
湖南省教育厅科学研究重点项目(19A078)
The Spatio-Temporal Evolution and Driving Factorsof the Provincial Green GDP Growth in China Based on a New Research Framework
Received date: 2020-03-16
Revised date: 2020-12-09
Online published: 2025-04-23
尹向飞 . 新框架核算下中国省级绿色GDP增长时空演变及驱动[J]. 经济地理, 2021 , 41(1) : 49 -57 . DOI: 10.15957/j.cnki.jjdl.2021.01.006
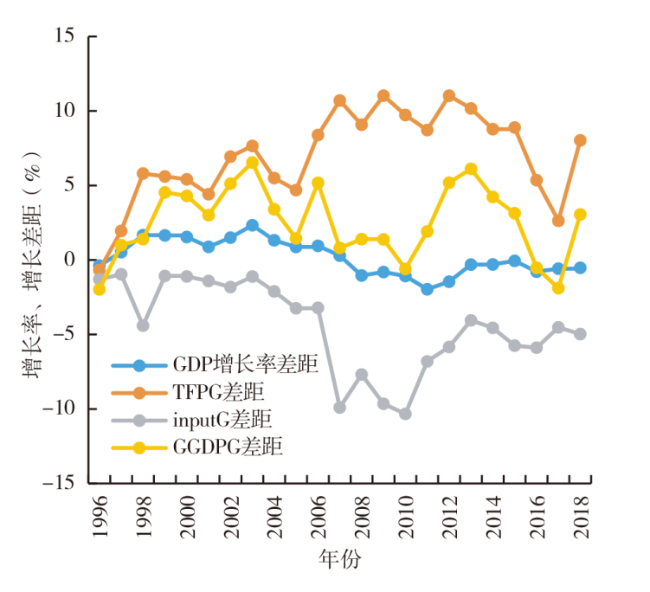
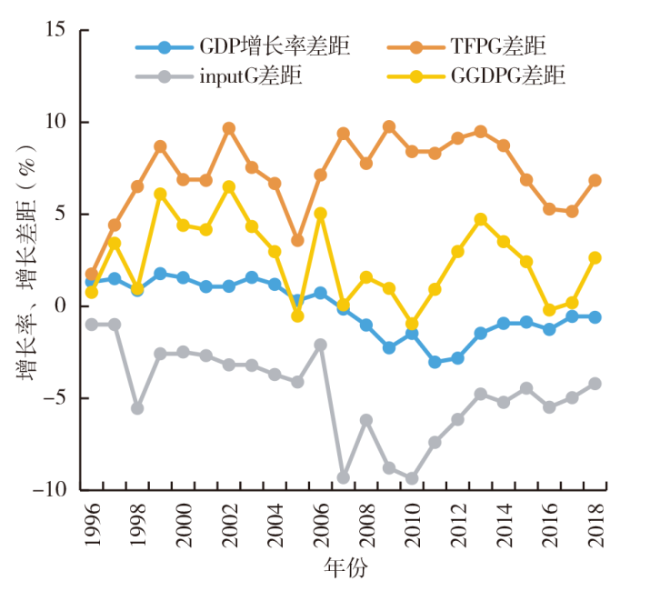
Based on the thought of Solow's total factor productivity measurement,this paper establishes the relationship between green GDP growth rate,green TFP growth rate and factor input growth rate,and conducts empirical research on the provincial data of China. The results show that China's green GDP increases more rapidly than the traditional GDP. Since the 10th Five-year Plan,the growth of factor input has become the main driving force for the green GDP growth. The traditional GDP gap becomes narrowed between the eastern region and the middle region,the eastern region and the western region,but the green GDP gap is expanding,and the green TFP gap is the main reason. Although the GDP growth rate of Shanghai,Tianjin and other provinces ranks low,their green GDP growth is in the forefront in China.
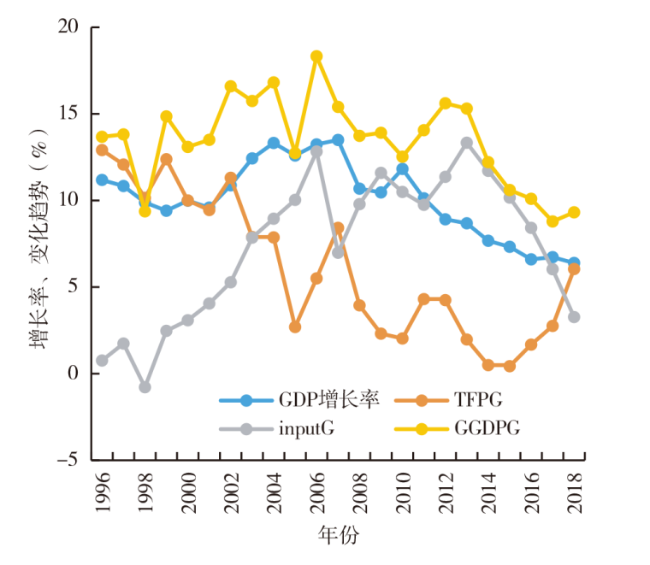
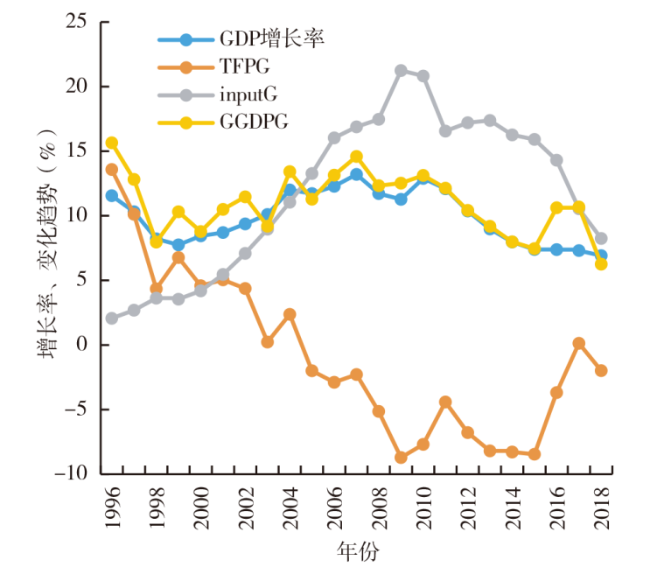
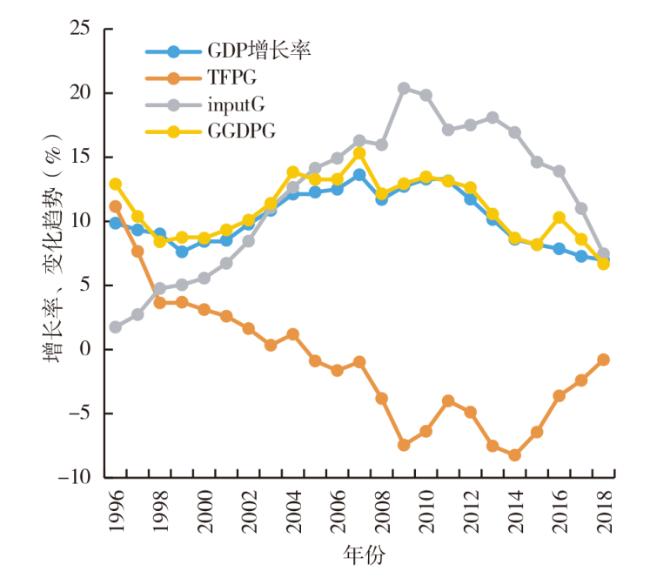
表1 1995—2018年中国绿色GDP增长率、TFPG和综合生产要素增长率(%)Tab.1 The green GDP growth,TFPG and factor input growth rate(inputG) during 1995-2018 in China |
| 年份 | GDP 增长率 | TFPG | inputG | 绿色GDP 增长率 | TFPG 贡献 | inputG 贡献 |
|---|---|---|---|---|---|---|
| 1996 | 11.04 | 12.77 | 1.27 | 14.03 | 90.98 | 9.02 |
| 1997 | 10.44 | 10.80 | 2.16 | 12.95 | 83.36 | 16.64 |
| 1998 | 9.31 | 7.55 | 1.30 | 8.85 | 85.28 | 14.72 |
| 1999 | 8.68 | 9.47 | 3.19 | 12.66 | 74.79 | 25.21 |
| 2000 | 9.34 | 7.47 | 3.79 | 11.26 | 66.35 | 33.65 |
| 2001 | 9.19 | 7.20 | 4.86 | 12.05 | 59.72 | 40.28 |
| 2002 | 10.32 | 7.98 | 6.26 | 14.24 | 56.02 | 43.98 |
| 2003 | 11.60 | 4.76 | 8.66 | 13.43 | 35.46 | 64.54 |
| 2004 | 12.81 | 5.44 | 10.07 | 15.51 | 35.08 | 64.92 |
| 2005 | 12.34 | 0.99 | 11.49 | 12.48 | 7.95 | 92.05 |
| 2006 | 12.89 | 2.34 | 13.93 | 16.27 | 14.41 | 85.59 |
| 2007 | 13.45 | 4.36 | 10.84 | 15.20 | 28.70 | 71.30 |
| 2008 | 11.09 | 0.54 | 12.60 | 13.15 | 4.12 | 95.88 |
| 2009 | 11.03 | -1.90 | 15.32 | 13.42 | -14.16 | 114.16 |
| 2010 | 12.32 | -1.68 | 14.51 | 12.83 | -13.10 | 113.10 |
| 2011 | 11.11 | 0.82 | 12.63 | 13.45 | 6.10 | 93.90 |
| 2012 | 9.75 | 0.02 | 13.83 | 13.85 | 0.13 | 99.87 |
| 2013 | 9.02 | -2.16 | 15.16 | 12.99 | -16.64 | 116.64 |
| 2014 | 7.91 | -3.19 | 13.75 | 10.56 | -30.17 | 130.17 |
| 2015 | 7.50 | -2.95 | 12.36 | 9.41 | -31.33 | 131.33 |
| 2016 | 7.02 | -0.58 | 10.84 | 10.26 | -5.61 | 105.61 |
| 2017 | 6.97 | 1.17 | 8.04 | 9.21 | 12.73 | 87.27 |
| 2018 | 6.63 | 2.84 | 5.25 | 8.09 | 35.10 | 64.90 |
| “九五” | 9.76 | 9.61 | 2.34 | 11.95 | 80.41 | 19.59 |
| “十五” | 11.25 | 5.27 | 8.27 | 13.54 | 38.94 | 61.06 |
| “十一五” | 12.16 | 0.73 | 13.44 | 14.17 | 5.18 | 94.82 |
| “十二五” | 9.06 | -1.49 | 13.54 | 12.05 | -12.38 | 112.38 |
| 2016—2018 | 6.87 | 1.15 | 8.04 | 9.19 | 12.47 | 87.53 |
| 平均 | 10.08 | 3.22 | 9.22 | 12.44 | 25.45 | 74.55 |
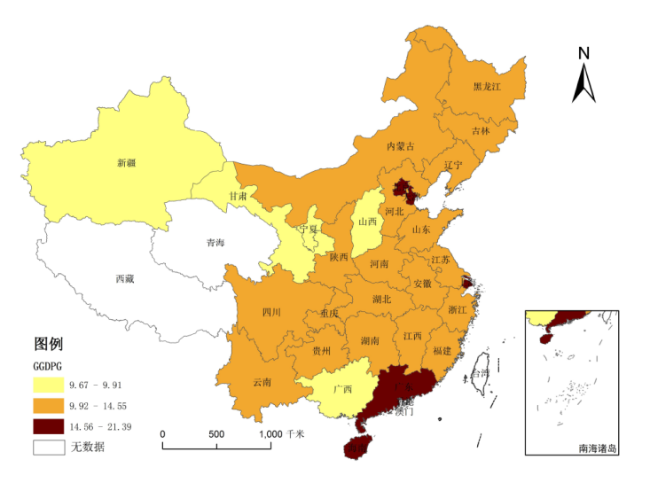
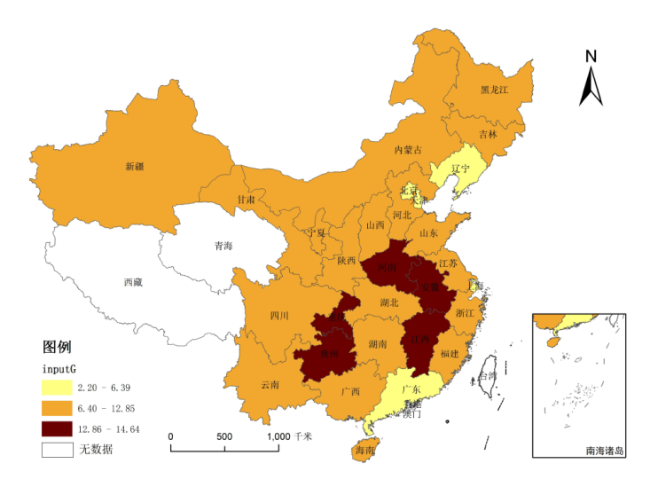
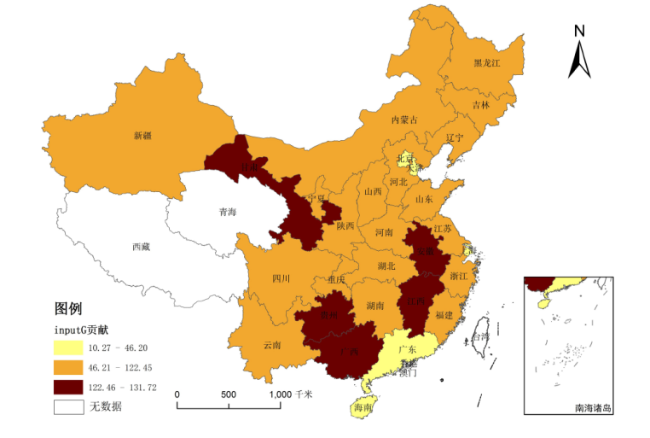
图6 中国各省(市)的绿色GDP增长率空间格局图Fig.6 The spatial pattern of the provinces’ green GDP growth in China |
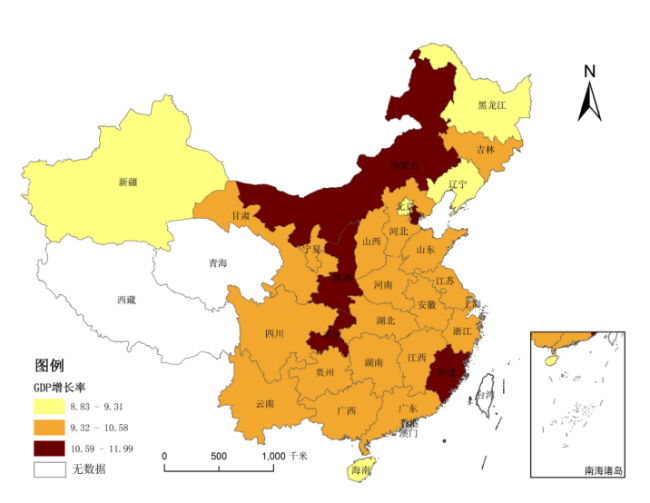
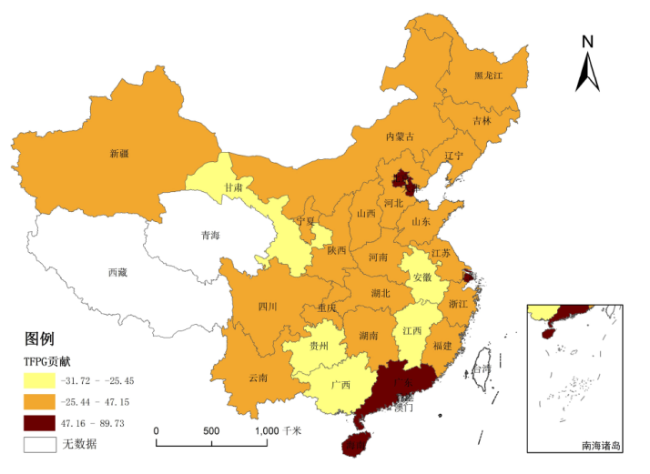
图7 中国各省(市)的传统GDP增长率空间格局图Fig.7 The spatial pattern of the provinces’ GDP growth in China |
表2 本文测算结果和谢瑾岚[29]测算结果的比较Tab.2 The result comparison of this paper and that of Xie Jinlan |
| 2012 | 2013 | 2014 | 2015 | 2016 | 2017 | 平均 | |
|---|---|---|---|---|---|---|---|
| 平均GDP增长率 | 10.67 | 9.78 | 8.67 | 8.44 | 8.18 | 8.03 | 8.96 |
| 平均绿色GDP增长率(本文) | 14.02 | 13.57 | 10.83 | 10.28 | 10.28 | 10.42 | 11.57 |
| 平均绿色发展增长率(谢瑾岚) | 3.45 | 3.71 | 3.51 | 3.38 | 5.72 | 2.67 | 3.73 |
| 东部地区GDP增长率 | 8.18 | 8.16 | 7.48 | 7.52 | 7.15 | 7.02 | 7.58 |
| 东部地区绿色GDP增长率(本文) | 18.07 | 20.96 | 15.35 | 14.29 | 12.47 | 12.13 | 15.55 |
| 东部地区绿色发展增长率(谢瑾岚) | 3.65 | 5.54 | 3.79 | 5.30 | 3.55 | 2.39 | 4.02 |
| 中部地区GDP增长率 | 10.82 | 9.69 | 9.10 | 8.43 | 8.11 | 7.94 | 9.01 |
| 中部地区绿色GDP增长率(本文) | 11.19 | 10.04 | 9.11 | 8.43 | 8.11 | 8.99 | 9.31 |
| 中部地区绿色发展增长率(谢瑾岚) | 3.49 | 2.85 | 3.66 | 3.03 | 7.19 | 3.06 | 3.86 |
| 西部地区GDP增长率 | 12.40 | 11.08 | 9.14 | 9.14 | 9.01 | 8.87 | 9.94 |
| 西部地区绿色GDP增长率(本文) | 13.80 | 11.57 | 9.15 | 9.14 | 10.81 | 10.57 | 10.84 |
| 西部地区绿色发展增长率(谢瑾岚) | 3.26 | 3.20 | 3.17 | 2.31 | 5.88 | 2.50 | 3.37 |
| [1] |
郭丽英, 雷敏, 刘晓琼. 基于能值分析法的绿色GDP核算研究——以陕西省商洛市为例[J]. 自然资源学报, 2015(9):1523-1533.
|
| [2] |
王德发, 阮大成, 王海霞. 工业部门绿色GDP核算研究——2000年上海市能源—环境—经济投入产出分析[J]. 财经研究, 2005(2):66-75.
|
| [3] |
沈晓艳, 王广洪, 黄贤金. 1997—2013年中国绿色GDP核算及时空格局研究[J]. 自然资源学报, 2017(10):1639-1650.
|
| [4] |
黄虹, 许祺. 人口流动、产业结构转变对上海市绿色GDP的影响研究[J]. 中国软科学, 2017(4):94-108.
|
| [5] |
杨缅昆. 绿色GDP核算理论问题初探[J]. 统计研究, 2001(2):40-43.
|
| [6] |
王金南, 於方, 曹东. 中国绿色国民经济核算研究报告2004[J]. 中国人口·资源与环境, 2006(6):11-17.
|
| [7] |
王永瑜, 郭立平. 绿色GDP核算理论与方法研究[J]. 统计研究, 2010(11):77-84.
|
| [8] |
王铮, 刘扬, 周清波. 上海的GDP一般增长核算与绿色GDP核算[J]. 地理研究, 2006(2):185-192.
|
| [9] |
|
| [10] |
|
| [11] |
陈梦根. 绿色GDP理论基础与核算思路探讨[J]. 中国人口·资源与环境, 2005(1):6-10.
|
| [12] |
|
| [13] |
李江龙, 徐斌. “诅咒”还是“福音”:资源丰裕程度如何影响中国绿色经济增长?[J]. 经济研究, 2018(9):151-167.
|
| [14] |
杨文举. 基于DEA的绿色经济增长核算:以中国地区工业为例[J]. 数量经济技术经济研究, 2011(1):19-34.
|
| [15] |
王兵, 刘光天. 节能减排与中国绿色经济增长——基于全要素生产率的视角[J]. 中国工业经济, 2015(5):57-69.
|
| [16] |
谢婷婷, 刘锦华. 绿色信贷如何影响中国绿色经济增长?[J]. 中国人口·资源与环境, 2019(9):83-90.
|
| [17] |
孙付华, 李申达, 龚茗菲, 等. 异质性企业对外投资行为如何影响中国绿色经济增长?[J]. 产业经济研究, 2019(5):65-76.
|
| [18] |
汪莉, 邵雨卉, 陈登科. 地方寻租与区域绿色经济增长效率[J]. 世界经济文汇, 2019(3):85-103.
|
| [19] |
|
| [20] |
胡琰欣, 屈小娥, 李依颖. 我国对“一带一路”沿线国家OFDI的绿色经济增长效应[J]. 经济管理, 2019(6):5-21.
|
| [21] |
杨文举. 基于索洛扩展模型的中国地区工业绿色经济增长核算[J]. 统计与决策, 2015(19):13-17.
|
| [22] |
贾湖, 于秀丽. 基于MCDM的非货币化绿色GDP核算体系和六省市算例[J]. 干旱区资源与环境, 2013(8):6-13.
|
| [23] |
沈菊琴, 孙悦. 基于DPSIR模型的地区绿色GDP评价指标体系研究[J]. 河海大学学报:哲学社会科学版, 2016(6):56-61,95-96.
|
| [24] |
杨雪星. 包容性绿色经济增长指数构建与实证研究——基于G20国家数据[J]. 福建论坛:人文社会科学版, 2014(6):42-48.
|
| [25] |
|
| [26] |
|
| [27] |
|
| [28] |
尹向飞, 欧阳峣. 中国全要素生产率再估计及不同经济增长模式下的可持续性比较[J]. 数量经济技术经济研究, 2019(8):72-91.
|
| [29] |
谢瑾岚. 长江经济带绿色发展报告(2019)[M]. 北京: 社会科学文献出版社, 2020.
|
/
| 〈 |
|
〉 |