
湖南省开发区工业用地利用效率行业差异及投入强度不达标率
|
朱红梅(1967—),女,湖南慈利人,教授,硕士生导师,主要研究方向为土地利用与土地经济等。E-mail:512896860@qq.com |
收稿日期: 2020-03-16
修回日期: 2020-08-09
网络出版日期: 2025-04-23
基金资助
国家自然科学基金项目(41971219)
国家重点研发计划子课题(2016YFD0200809)
湖南省社会科学基金项目(18ZDB015)
2020年湖南省研究生科研创新项目(CX20200680)
Difference of the Industrial Land Use Efficiency and the Rate of Non-Compliance of Investment Intensity in the Development Zones of Hunan Province
Received date: 2020-03-16
Revised date: 2020-08-09
Online published: 2025-04-23
开发区工业用地利用效率行业差异与投入强度不达标率的研究对优化资源配置、产业结构升级具有重要意义。基于2018年湖南省800个规模以上工业企业用地情况的调查数据,构建投入强度不达标率的测度方法,并运用数据包络分析法对工业行业的用地效率及投入强度不达标率情况进行测度与分析。结果表明:湖南省开发区工业行业土地利用效率偏低,整体呈现通信电子、装备制造业、烟草制品业等主导行业用地效率高,食品加工、木材加工、纺织服务等轻工业行业用地效率低的特点;工业行业投入强度不达标率较低,但整体仍处于投入不足的阶段,应加大资金投入的同时提高现有土地的利用效率;工业行业用地在现有投入水平下出现产出不足,可适当进行二次开发,着力提升产出率。
关键词: 工业用地效率; 行业; 开发区; 数据包络分析法(DEA); 湖南省
朱红梅 , 王杰 , 于闽 , 蔡琼 , 谭雪兰 , 李禹 . 湖南省开发区工业用地利用效率行业差异及投入强度不达标率[J]. 经济地理, 2021 , 41(1) : 140 -146 . DOI: 10.15957/j.cnki.jjdl.2021.01.016
Hunan Province is the key region of China's industrial economic development and the gathering place of advanced manufacturing industry,it has a significant meaning to research the difference of the industrial land use efficiency and the rate of non-compliance of investment intensity in the development zones,which is conducive to optimizing inter-industry resource allocation and industrial structure upgrading. Based on the survey data which includes the land use situation of 800 industrial enterprises above designated size in Hunan Province in 2018,it is classified into 30 industries. It analyzes land use benefits of different industries applying the data envelopment analysis (DEA),and compares actual investment intensity and plot ratio with quota standards gap,it also analyzes the rate of non-compliance of the industry investment. The results show that the land use efficiency of the industrial industries is relatively low in the development zones of Hunan Province,which is characterized by high land use efficiency in the leading industries such as communication and electronics,equipment manufacturing,tobacco products and so on,and low land use efficiency in light industries such as food processing,textile service and wood processing. The the rate of non-compliance of investment intensity of industrial industry is good in the development zones of Hunan Province,and the whole industry is in the stage of insufficient investment. In that situation,we should not only increase the input of finance,but also improve the use efficiency of the current land. The output of industrial land in Hunan Province is insufficient under the current input level,so the secondary development of industrial land can be carried out appropriately to improve the output rate.
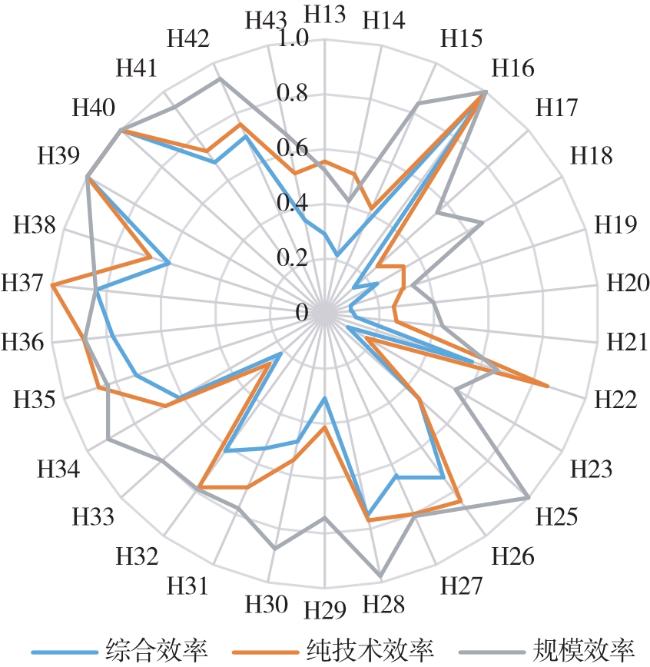
表1 2018年湖南省开发区分行业工业用地利用效率值Tab.1 The utilization efficiency of industrial land use by sector in the development zones of Hunan in 2018 |
| 行业分类 | 行业代码 | 综合效率 | 纯技术效率 | 规模效率 | |||||
|---|---|---|---|---|---|---|---|---|---|
| 排序 | 效率值 | 排序 | 效率值 | 排序 | 效率值 | ||||
| 农副食品加工业 | H13 | 22 | 0.2905 | 17 | 0.5550 | 26 | 0.5235 | ||
| 食品制造业 | H14 | 24 | 0.2185 | 20 | 0.5201 | 28 | 0.4201 | ||
| 酒、饮料和精制茶制造业 | H15 | 19 | 0.3526 | 22 | 0.4203 | 14 | 0.8390 | ||
| 烟草制品业 | H16 | 1 | 1.0000 | 1 | 1.0000 | 1 | 1.0000 | ||
| 纺织业 | H17 | 26 | 0.1426 | 28 | 0.2586 | 24 | 0.5514 | ||
| 纺织服装、服饰业 | H18 | 23 | 0.2205 | 24 | 0.3325 | 22 | 0.6632 | ||
| 皮革、毛皮、羽毛及其制品和制鞋业 | H19 | 29 | 0.1003 | 25 | 0.2980 | 30 | 0.3365 | ||
| 木材加工和木、竹、藤、棕、草制品业 | H20 | 28 | 0.1008 | 29 | 0.2530 | 29 | 0.3985 | ||
| 家具制造业 | H21 | 27 | 0.1139 | 27 | 0.2635 | 27 | 0.4322 | ||
| 造纸和纸制品业 | H22 | 15 | 0.5648 | 7 | 0.8531 | 23 | 0.6621 | ||
| 印刷和记录媒介复制业 | H23 | 30 | 0.0970 | 30 | 0.1761 | 25 | 0.5510 | ||
| 石油加工、炼焦和核燃料加工业 | H25 | 18 | 0.4628 | 21 | 0.4628 | 1 | 1.0000 | ||
| 化学原料和化学制品制造业 | H26 | 7 | 0.7365 | 8 | 0.8432 | 12 | 0.8734 | ||
| 医药制造业 | H27 | 11 | 0.6435 | 9 | 0.7982 | 16 | 0.8062 | ||
| 化学纤维制造业 | H28 | 6 | 0.7503 | 11 | 0.7688 | 5 | 0.9760 | ||
| 橡胶和塑料制品业 | H29 | 21 | 0.3071 | 23 | 0.4133 | 20 | 0.7430 | ||
| 非金属矿物制品业 | H30 | 17 | 0.4753 | 18 | 0.5435 | 11 | 0.8744 | ||
| 黑色金属冶炼和压延加工业 | H31 | 16 | 0.5361 | 14 | 0.6916 | 19 | 0.7751 | ||
| 有色金属冶炼和压延加工业 | H32 | 12 | 0.6173 | 10 | 0.7821 | 18 | 0.7893 | ||
| 金属制品业 | H33 | 25 | 0.2165 | 26 | 0.2710 | 17 | 0.7988 | ||
| 通用设备制造业 | H34 | 13 | 0.6122 | 15 | 0.6710 | 8 | 0.9124 | ||
| 专用设备制造业 | H35 | 8 | 0.7226 | 6 | 0.8661 | 15 | 0.8343 | ||
| 汽车制造业 | H36 | 5 | 0.7771 | 5 | 0.8832 | 10 | 0.8798 | ||
| 铁路、船舶、航空航天和其他运输设备制造业 | H37 | 4 | 0.8381 | 4 | 0.9982 | 13 | 0.8396 | ||
| 电气机械和器材制造业 | H38 | 14 | 0.5972 | 16 | 0.6684 | 9 | 0.8934 | ||
| 计算机、通信和其他电子设备制造业 | H39 | 1 | 1.0000 | 1 | 1.0000 | 1 | 1.0000 | ||
| 仪器仪表制造业 | H40 | 1 | 1.0000 | 1 | 1.0000 | 1 | 1.0000 | ||
| 其他制造业 | H41 | 10 | 0.6820 | 13 | 0.7325 | 7 | 0.9310 | ||
| 废弃资源综合利用业 | H42 | 9 | 0.7077 | 12 | 0.7553 | 6 | 0.9370 | ||
| 金属制品、机械和设备修理业 | H43 | 20 | 0.3485 | 19 | 0.5233 | 21 | 0.6660 | ||
| 平均值 | - | - | 0.5077 | - | 0.6201 | - | 0.7636 | ||
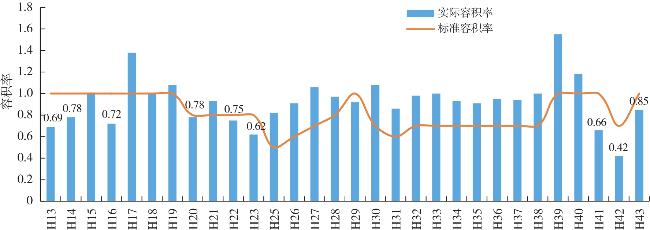
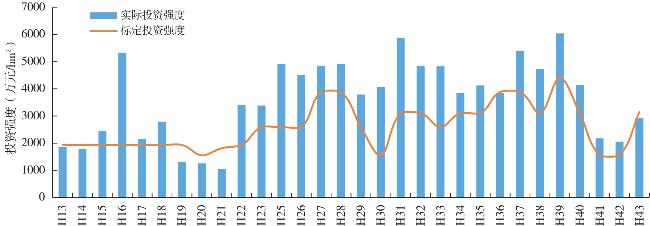
表2 2018年湖南省开发区工业行业投入损失Tab.2 The input loss of industrial sectors in the development zones of Hunan in 2018 |
| 行业 代码 | 实际容 积率(%) | 标准容 积率(%) | 实际投资强度 (万元/hm2) | 标准投资强度 (万元/hm2) |
|---|---|---|---|---|
| H13 | 0.69 | ≥1.0 | 1 852.31 | ≥1 935 |
| H14 | 0.78 | ≥1.0 | 1 789.25 | ≥1 935 |
| H15 | 1.01 | ≥1.0 | 2 438.14 | ≥1 935 |
| H16 | 0.72 | ≥1.0 | 5 325.62 | ≥1 935 |
| H17 | 1.38 | ≥1.0 | 2 158.36 | ≥1 935 |
| H18 | 1.00 | ≥1.0 | 2 788.03 | ≥1 935 |
| H19 | 1.08 | ≥1.0 | 1 314.07 | ≥1 935 |
| H20 | 0.78 | ≥0.8 | 1 257.33 | ≥1 555 |
| H21 | 0.93 | ≥0.8 | 1 052.39 | ≥1 815 |
| H22 | 0.75 | ≥0.8 | 3 406.10 | ≥1 935 |
| H23 | 0.62 | ≥0.8 | 3 382.59 | ≥2 590 |
| H25 | 0.82 | ≥0.5 | 4 911.11 | ≥2 590 |
| H26 | 0.91 | ≥0.6 | 4 503.05 | ≥2 590 |
| H27 | 1.06 | ≥0.7 | 4 847.85 | ≥3 885 |
| H28 | 0.97 | ≥0.8 | 4 916.14 | ≥3 885 |
| H29 | 0.92 | ≥1.0 | 3 788.47 | ≥2 590 |
| H30 | 1.08 | ≥0.7 | 4 067.61 | ≥1 555 |
| H31 | 0.86 | ≥0.6 | 5 872.53 | ≥3 105 |
| H32 | 0.98 | ≥0.7 | 4 838.68 | ≥3 105 |
| H33 | 1.00 | ≥0.7 | 4 830.85 | ≥2 590 |
| H34 | 0.93 | ≥0.7 | 3 842.35 | ≥3 105 |
| H35 | 0.91 | ≥0.7 | 4 125.18 | ≥3 105 |
| H36 | 0.95 | ≥0.7 | 3 847.19 | ≥3 885 |
| H37 | 0.94 | ≥0.7 | 5 388.15 | ≥3 885 |
| H38 | 1.00 | ≥0.7 | 4 722.82 | ≥3 105 |
| H39 | 1.55 | ≥1.0 | 6 038.59 | ≥4 400 |
| H40 | 1.18 | ≥1.0 | 4 134.86 | ≥3 105 |
| H41 | 0.66 | ≥1.0 | 2 177.55 | ≥1 555 |
| H42 | 0.42 | ≥0.7 | 2 055.12 | ≥1 555 |
| H43 | 0.85 | ≥1.0 | 2 923.01 | ≥3 150 |
图2 2018年湖南省开发区工业行业土地容积率比较Fig.2 The comparison of land plot ratio of industrial sectors in the development zones of Hunan in 2018 |
| [1] |
张落成, 武清华, 刘剑. 基于企业抽样调查的无锡省级开发区工业行业土地集约利用评价[J]. 长江流域资源与环境, 2012, 21(12):1486-1491.
|
| [2] |
魏宗财, 王开泳, 陈婷婷. 新型城镇化背景下开发区转型研究——以广州民营科技园为例[J]. 地理科学进展, 2015, 34(9):1195-1208.
|
| [3] |
魏宁宁, 陈会广, 徐雷. 开发区土地集约利用评价方法对比研究[J]. 长江流域资源与环境, 2017, 26(10):1556-1563.
|
| [4] |
吴双, 陈文波, 郑蕉. 基于分层线性模型的开发区工业用地集约利用影响因素研究[J]. 中国土地科学, 2020, 34(1):53-60.
|
| [5] |
李永乐, 舒帮荣, 吴群. 中国城市土地利用效率:时空特征、地区差距与影响因素[J]. 经济地理, 2014, 34(1):133-139.
|
| [6] |
王贺封, 石忆邵, 尹昌应. 基于DEA模型和Malmquist生产率指数的上海市开发区用地效率及其变化[J]. 地理研究, 2014, 33(9):1636-1646.
|
| [7] |
杨文白, 陈秀万. 开发区土地利用评价指标体系研究[J]. 地球信息科学, 2007(3):21-24,51.
|
| [8] |
梅波. 城市开发区土地集约利用评价[D]. 南京: 南京师范大学, 2018.
|
| [9] |
陈伟, 彭建超, 吴群. 中国省域工业用地利用效率时空差异及影响因素研究[J]. 资源科学, 2014, 36(10):2046-2056.
|
| [10] |
陈伟, 彭建超, 吴群. 城市工业用地利用损失与效率测度[J]. 中国人口·资源与环境, 2015, 25(2):15-22.
|
| [11] |
郭贯成, 熊强. 城市工业用地效率区域差异及影响因素研究[J]. 中国土地科学, 2014, 28(4):45-52.
|
| [12] |
陈伟, 吴群. 开发区土地利用效率及影响因素研究——以江苏省为例[J]. 国土资源科技管理, 2013, 30(4):1-7.
|
| [13] |
谈丹, 王杰, 朱红梅, 等. 湖南省工业用地利用效率评价分析[J]. 山东国土资源, 2019, 35(9):74-80.
|
| [14] |
庄红卫, 李红. 湖南省不同区域开发区工业用地利用效率评价研究[J]. 经济地理, 2011, 31(12):2100-2104.
|
| [15] |
施建刚, 徐天珩. 基于VRS-DEA模型与Malmquist指数的工业园区土地利用效率评价——以长三角城市群16个工业园区为例[J]. 资源科学, 2017, 39(6):1026-1036.
|
| [16] |
王丽, 樊杰, 郭锐, 等. 基于DEA方法的国家高新技术产业开发区运行效率评价[J]. 工业技术经济, 2019, 38(9):50-57.
|
| [17] |
吴群, 陈伟. 中国城市工业用地利用效率研究[M]. 北京: 科学出版社, 2015.
|
/
| 〈 |
|
〉 |