
青年流动人才空间分布及居留意愿影响因素——基于2017年全国流动人口动态监测数据
|
李琴(1977—),女,湖南新邵人,博士,副教授,硕士生导师。主要研究方向为劳动力流动。E-mail:595389985@qq.com。 |
收稿日期: 2020-02-15
修回日期: 2020-08-27
网络出版日期: 2025-04-23
基金资助
国家社会科学基金项目(17BFX149)
Spatial Distribution of Floating Young Talents and Influencing Factors of Their Settlement Intention-Based on the Dynamic Monitoring Data of the National Floating Population in 2017
Received date: 2020-02-15
Revised date: 2020-08-27
Online published: 2025-04-23
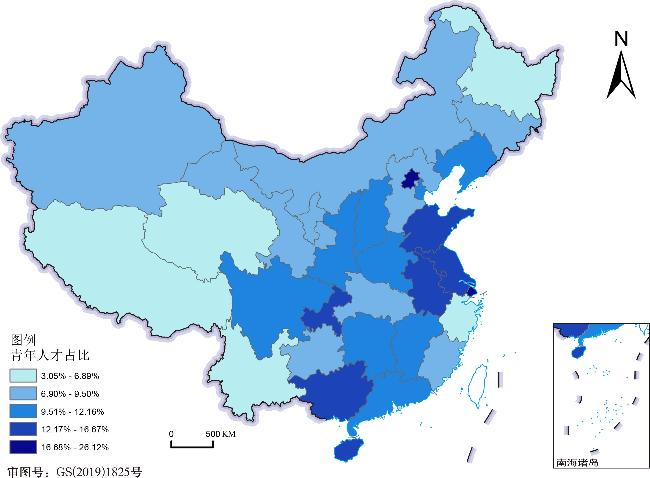
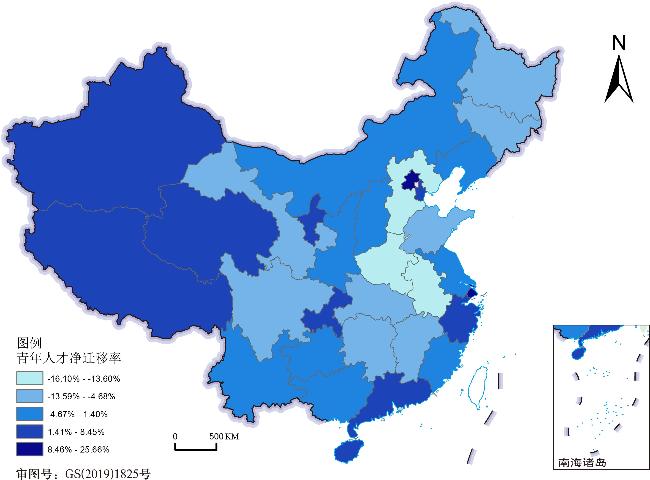
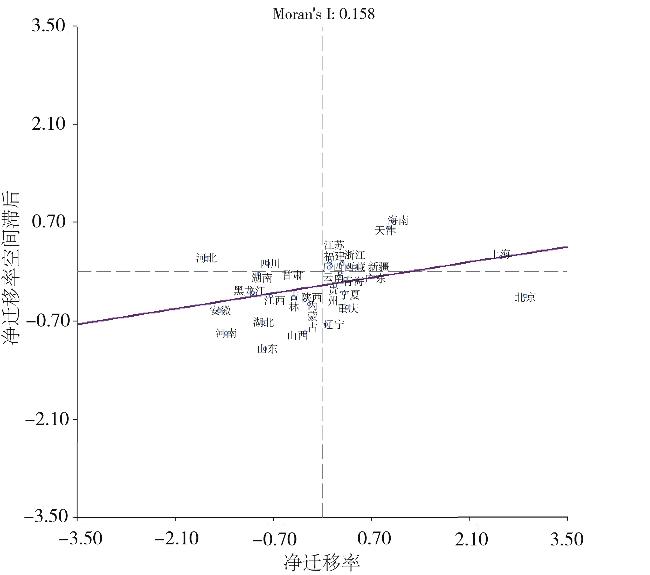
随着各地陆续颁布吸引人才的政策,青年人才流动问题受到越来越多的关注。文章基于2017年流动人口动态监测数据,综合运用ArcGIS和GeoDa的空间分析功能,结合二分类Logistic回归模型,对全国青年流动人才空间分布和居留意愿影响因素进行研究。结果发现:①青年流动人才的净迁移率呈现出“中部低、周围高”的空间格局,人口密度曲线呈现东高西低,南北较小幅度的倒“U”型趋势。②从空间集聚度来看,青年流动人才净迁移率分布呈现出明显的空间集聚特征,东部沿海省份和西部地区的新疆、西藏青年人才净迁移率相对较高,呈现出高高聚集特点,中部地区净迁移率相对较低,呈现出低低聚集特点。③青年流动人才的个体因素对居留意愿影响显著,女性居留意愿高于男性;年龄段最小的青年人才居留意愿最低;随着学历的提高,居留意愿增强。家庭因素中,配偶户籍地为流入地本地的青年人才居留意愿最高。经济因素中,随着住房支出增加,青年人才的居留意愿提升。社会因素方面,专业技术人员及办事人员居留意愿最强烈。各地在制定人才吸引政策时应充分考虑青年流动人才居留意愿影响因素。
李琴 , 谢治 . 青年流动人才空间分布及居留意愿影响因素——基于2017年全国流动人口动态监测数据[J]. 经济地理, 2020 , 40(9) : 27 -35 . DOI: 10.15957/j.cnki.jjdl.2020.09.003
With the successive promulgation of policies attracting talents, more and more attention has been paid to the flow of young talents. Based on the dynamic monitoring data of the floating population in 2017, this study applies the spatial analysis of ArcGIS and Geoda, and the binary logistic regression model to explore the spatial distribution of the flow of young talents and the influencing factors of their settlement intention in China. The results show that: 1) The net migration rate of young talents presents a spatial pattern which is low in the middle and high in the surrounding areas, and the population density curve shows the trend of "higher in the East and lower in the West" and a small inverted U-shaped trend in the North and the South. 2) From the perspective of spatial agglomeration, it exhibits the characteristics of obvious spatial agglomeration on the distribution of net migration rate of young talents. The net migration rate of young talents is relatively high in eastern coastal provinces, Xinjiang Uygur Autonomous Region and Tibet Autonomous Region( showing the characteristics of high-high aggregation) and relatively low in central China( showing the characteristics of low-low aggregation). 3)The individual factors of young talents have a significant impact on the willingness of settlement, settlement willingness of women is higher than that of men; the youngest talents have the lowest willingness to stay; the higher academic qualifications, the stronger willingness to stay. Among family factors, young talents whose spouse's domicile is the place of inflow have the highest willingness to settle. Among economic factors, with the increasement in housing expenditure, the settlement willingness of young talents will be stronger. In terms of social factors, professional and technical talents and clerks have the strongest willingness to stay. Formulating policies for attracting talents should fully consider factors affecting young talents' settlement willingness.
表1 各省青年人才流动情况Tab.1 The flow of young floating talents in various provinces |
| 省份 | 抽样人数(人) | 总数(人) | 比重(%) | 省际流入(人) | 省际流出(人) | 净流入人数(人) | 净迁移 率(%) |
|---|---|---|---|---|---|---|---|
| 北京 | 6 999 | 1 828 | 26.12 | 1 828 | 32 | 1 796 | 25.66 |
| 天津 | 5 000 | 497 | 9.94 | 497 | 108 | 389 | 7.78 |
| 河北 | 4 999 | 466 | 9.32 | 111 | 916 | -805 | -16.10 |
| 山西 | 5 000 | 529 | 10.58 | 120 | 276 | -156 | -3.12 |
| 内蒙古 | 5 000 | 475 | 9.50 | 80 | 213 | -133 | -2.66 |
| 辽宁 | 5 000 | 522 | 10.44 | 217 | 237 | -20 | -0.40 |
| 吉林 | 4 000 | 294 | 7.35 | 75 | 262 | -187 | -4.68 |
| 黑龙江 | 4 000 | 260 | 6.50 | 35 | 435 | -400 | -10.00 |
| 上海 | 7 000 | 1 600 | 22.86 | 1 600 | 25 | 1 575 | 22.50 |
| 江苏 | 8 000 | 1 057 | 13.21 | 556 | 545 | 11 | 0.14 |
| 浙江 | 10 000 | 689 | 6.89 | 446 | 270 | 176 | 1.76 |
| 安徽 | 5 000 | 719 | 14.38 | 58 | 777 | -719 | -14.38 |
| 福建 | 6 999 | 646 | 9.23 | 169 | 155 | 14 | 0.20 |
| 江西 | 4 000 | 438 | 10.95 | 120 | 425 | -305 | -7.63 |
| 山东 | 6 000 | 1 000 | 16.67 | 129 | 628 | -499 | -8.32 |
| 河南 | 4 999 | 592 | 11.84 | 72 | 752 | -680 | -13.60 |
| 湖北 | 5 000 | 420 | 8.40 | 85 | 518 | -433 | -8.66 |
| 湖南 | 5 000 | 608 | 12.16 | 60 | 520 | -460 | -9.20 |
| 广东 | 9 998 | 1 138 | 11.38 | 708 | 165 | 543 | 5.43 |
| 广西 | 4 999 | 723 | 14.46 | 141 | 141 | 0 | 0.00 |
| 海南 | 4 000 | 626 | 15.65 | 360 | 22 | 338 | 8.45 |
| 重庆 | 4 999 | 756 | 15.12 | 254 | 136 | 118 | 2.36 |
| 四川 | 5 000 | 564 | 11.28 | 94 | 496 | -402 | -8.04 |
| 贵州 | 5 000 | 394 | 7.88 | 106 | 66 | 40 | 0.80 |
| 云南 | 6 000 | 389 | 6.48 | 131 | 47 | 84 | 1.40 |
| 西藏 | 3 997 | 122 | 3.05 | 102 | 3 | 99 | 2.48 |
| 陕西 | 5 000 | 501 | 10.02 | 132 | 290 | -158 | -3.16 |
| 甘肃 | 4 000 | 345 | 8.63 | 89 | 308 | -219 | -5.48 |
| 青海 | 4 000 | 252 | 6.30 | 101 | 17 | 84 | 2.10 |
| 宁夏 | 4 000 | 305 | 7.63 | 104 | 27 | 77 | 1.93 |
| 新疆 | 7 000 | 564 | 8.06 | 273 | 41 | 232 | 3.31 |
| 总计 | 169 989 | 19 319 | - | - | - | - | - |
表2 自变量及其赋值Tab.2 Independent variables and respective numerical value |
| 变量类型 | 变量名称 | 变量赋值 |
|---|---|---|
| 个人因素 | 性别 | 1=男性,2=女性 |
| 年龄 | 1=18~25岁,2=26~35岁,3=36~45岁 | |
| 户口性质 | 1=农业,2=非农业 | |
| 受教育程度 | 1=大学专科,2=大学本科,3=研究生 | |
| 家庭因素 | 配偶户籍地 | 1=配偶本地户口,2=无配偶,3=配偶非本地户口 |
| 家庭成员人数 | 连续变量 | |
| 经济因素 | 月工资收入 | 1=0~3 000元,2=3 001~6 000元,3=6 001~9 000元,4=9 001元及以上 |
| 家庭月收支比 | 连续变量 | |
| 住房性质 | 1=低租金或免费住房(包括政府提供公租房、单位/雇主提供免费住房(不包括就业场所)、借住房、就业场所、其他非正规居所),2=租房(租住私房),3=自有住房(包括自购住房、自建房) | |
| 住房支出 | 1=0~999元,2=1 000~1 999元,3=2 000~2 999元,4=3 000元及以上 | |
| 社会因素 | 职业类型 | 1=专业技术及办事人员(包括“国家机关、党群组织、企事业单位负责人”、专业技术人员、公务员、办事人员和有关人员),2=商业服务业人员(包括经商、商贩、餐饮、家政、保洁、保安、装修、快递、“其他商业、服务业人员”),3=农业及产业工人(包括“农林牧渔、水利业生产人员”、生产、运输、建筑、“其他生产、运输设备操作人员及有关人员”),4=无固定职业及其他 |
表3 二元Logistic模型实证结果Tab.3 Empirical results of binary logistic model |
| 模型一 | 模型二 | 模型三 | 模型四 | |
|---|---|---|---|---|
| 性别(对照组:男性) | ||||
| 女性 | 1.245*** | 1.250*** | 1.298*** | 1.293*** |
| 年龄(对照组:18~25岁) | ||||
| 26~35岁 | 2.622*** | 2.175*** | 1.692*** | 1.699*** |
| 36~45岁 | 3.288*** | 2.460*** | 1.785*** | 1.791*** |
| 户口性质(对照组:农业) | ||||
| 非农业 | 1.499*** | 1.498*** | 1.342*** | 1.335*** |
| 受教育程度(对照组:大学专科) | ||||
| 大学本科 | 1.316*** | 1.312*** | 1.163*** | 1.140*** |
| 研究生 | 1.623*** | 1.604*** | 1.290*** | 1.232** |
| 配偶户籍地(对照组:配偶本地户口) | ||||
| 无配偶 | 0.167*** | 0.326*** | 0.328*** | |
| 配偶非本地户口 | 0.348*** | 0.462*** | 0.463*** | |
| 家庭成员数 | 1.345*** | 1.143*** | 1.143*** | |
| 月工资收入(对照组:0~3 000元) | ||||
| 3 001~6 000元 | 1.043 | 1.041 | ||
| 6 001~9 000元 | 1.114* | 1.111* | ||
| 9 001元及以上 | 1.270*** | 1.264*** | ||
| 家庭月收支比 | 0.996 | 0.997 | ||
| 住房性质(对照组:低租金或免费住房) | ||||
| 租房 | 1.358*** | 1.359*** | ||
| 自有住房 | 5.297*** | 5.300*** | ||
| 住房支出(对照组:0~999元) | ||||
| 1 000~1 999元 | 1.214*** | 1.215*** | ||
| 2 000~2 999元 | 1.474*** | 1.474*** | ||
| 3 000元及以上 | 1.692*** | 1.690*** | ||
| 职业类型(对照组:专业技术及办事人员) | ||||
| 商业服务业人员 | 0.820*** | |||
| 农业及产业工人 | 0.802*** | |||
| 无固定职业及其他 | 0.896 | |||
| _cons | 0.089*** | 0.139*** | 0.021*** | 0.026*** |
| Number of obs | 19 319 | 19 319 | 19 318 | 19 318 |
| LR chi2(i) | 961.81 | 1 486.70 | 3 567.20 | 3 584.80 |
| Prob>chi2 | 0.0000 | 0.0000 | 0.0000 | 0.0000 |
| Pseudo R2 | 0.0359 | 0.0555 | 0.1333 | 0.1339 |
| [1] |
刘旭阳, 金牛. 城市“抢人大战”政策再定位——聚焦青年流动人才的分析[J]. 中国青年研究, 2019(9):47-53.
|
| [2] |
|
| [3] |
|
| [4] |
Narasimhan. Labour out-migration to cities:search for an appropriate theory[J]. Man-and-Development, 1995, 17(1):78-88.
|
| [5] |
|
| [6] |
孟兆敏, 吴瑞君. 城市流动人口居留意愿研究——基于上海、苏州等地的调查分析[J]. 人口与发展, 2011, 17(3):11-18.
|
| [7] |
|
| [8] |
|
| [9] |
姚华松, 许学强. 西方人口迁移研究进展[J]. 世界地理研究, 2008(1):154-166.
|
| [10] |
刘盛和, 邓羽, 胡章. 中国流动人口地域类型的划分方法及空间分布特征[J]. 地理学报, 2010, 65(10):1187-1 197.
|
| [11] |
姚华松, 许学强, 薛德升. 广州流动人口空间分布变化特征及原因分析[J]. 经济地理, 2010, 30(1):40-46.
|
| [12] |
朱传耿, 顾朝林, 马荣华, 等. 中国流动人口的影响要素与空间分布[J]. 地理学报, 2001(5):548-559.
|
| [13] |
鲁奇, 王国霞, 杨春悦, 等. 流动人口分布与区域经济发展关系若干解释(1990、2000)[J]. 地理研究, 2006(5):765-774,949.
|
| [14] |
李树茁, 王维博, 悦中山. 自雇与受雇农民工城市居留意愿差异研究[J]. 人口与经济, 2014(2):12-21.
|
| [15] |
侯建明, 李晓刚. 我国流动老年人口居留意愿及其影响因素分析[J]. 人口学刊, 2017, 39(6):62-70.
|
| [16] |
于潇, 陈新造. “90后”流动青年的广东城市居留意愿及影响因素研究[J]. 商业研究, 2017(5):177-183.
|
| [17] |
蔚志新. 分地区流动人口居留意愿影响因素比较研究——基于全国5城市流动人口动态监测调查数据[J]. 人口与经济, 2013(4):12-20.
|
| [18] |
郭建玉. 中山市流动人口居留意愿研究[J]. 南京人口管理干部学院学报, 2010, 26(2):34-38,42.
|
| [19] |
|
| [20] |
|
| [21] |
孟兆敏, 吴瑞君. 城市流动人口居留意愿研究——基于上海、苏州等地的调查分析[J]. 人口与发展, 2011, 17(3):11-18.
|
| [22] |
王春兰, 丁金宏. 流动人口城市居留意愿的影响因素分析[J]. 南方人口, 2007(1):22-29.
|
| [23] |
杨雪, 魏洪英. 流动人口长期居留意愿的新特征及影响机制[J]. 人口研究, 2017, 41(5):63-73.
|
| [24] |
吕红军, 陈洋愉, 褚祝杰. 基于logit模型的城市高学历人群长期居留倾向研究[J]. 人口学刊, 2014, 36(1):105-112.
|
| [25] |
杨菊华. “代际改善”还是“故事重复”?——青年流动人口职业地位纵向变动趋势研究[J]. 中国青年研究, 2014(7):53-60.
|
| [26] |
徐鹏, 周长城. 新时代背景下流动青年社会融入的结构测度与影响因素——基于2017年湖北流动人口动态监测调查[J]. 中国青年研究, 2018(9):62-69.
|
| [27] |
杨菊华, 张莹, 陈志光. 北京市流动人口身份认同研究——基于不同代际、户籍及地区的比较[J]. 人口与经济, 2013(3):43-52.
|
| [28] |
肖昕茹. 大城市青年流动人口购房意愿及其影响因素分析——以上海为例[J]. 上海经济研究, 2014(8):121-129.
|
| [29] |
杨东亮, 韩枫. 京津冀地区青年流动人口幸福感影响因素分析[J]. 青年研究, 2015(4):29-37.
|
| [30] |
岳昌君. 大学生跨省流动的特点及影响因素分析[J]. 复旦教育论坛, 2011, 9(2):57-62.
|
| [31] |
张抗私, 周晓蒙. 大学毕业生就业的省际流动特征及其影响因素[J]. 人口与经济, 2018(1):69-78.
|
| [32] |
葛玉好, 牟小凡, 刘峰. 大学生就业地域选择的影响因素分析——基于扩展的托达罗人口流动模型[J]. 中国人民大学教育学刊, 2011(4):81-89.
|
| [33] |
|
| [34] |
景晓芬. 老年流动人口空间分布及长期居留意愿研究——基于2015年全国流动人口动态监测数据[J]. 人口与发展, 2019, 25(4):34-43.
|
| [35] |
李扬, 刘慧, 汤青. 1985—2010年中国省际人口迁移时空格局特征[J]. 地理研究, 2015, 34(6):1135-1 148.
|
| [36] |
张锦宗, 朱瑜馨, 李生明. ArcGIS地统计分析在甘肃省人口空间分布研究中的应用[J]. 西北人口, 2010, 31(3):91-94.
|
| [37] |
潘竟虎, 李天宇. 甘肃省人口流动空间格局和影响因素的ESDA分析[J]. 统计与信息论坛, 2009, 24(9):62-66.
|
| [38] |
戈艳霞. 当前我国“人才争夺战”的起因、潜在问题与对策建议[J]. 西南民族大学学报:人文社科版, 2020, 41(3):199-204.
|
| [39] |
崔佳伟, 周伟, 钱庆, 等. 中国城市流动人口居留意愿及影响因素研究[J]. 中华医学图书情报杂志, 2019, 28(5):20-28.
|
| [40] |
李辉, 段程允, 白宇舒. 我国流动人口留城意愿及影响因素研究[J]. 人口学刊, 2019, 41(1):80-88.
|
| [41] |
李辉, 王良健. 房价、房价收入比与流动人口长期居留意愿——来自流动人口的微观证据[J]. 经济地理, 2019, 39(6):86-96.
|
| [42] |
李琴, 粟湘惠, 李辉. 《对外劳务合作管理条例》对中国劳务输出的促进效应分析——基于双重差分模型[J]. 财经理论与实践, 2020, 41(3):140-147.
|
| [43] |
王化波. 迁入地类型的选择——基于五普资料的分析[J]. 人口学刊, 2008(6):32-36.
|
| [44] |
曾永明, 张利国. 户籍歧视、地域歧视与农民工工资减损——来自2015年全国流动人口动态监测调查的新证据[J]. 中南财经政法大学学报, 2018(5):141-150.
|
/
| 〈 |
|
〉 |