
我国区域协调发展时空分异及其影响因素
|
张超(1991—),男,安徽宣城人,博士研究生,讲师。主要研究方向为区域经济与区域协调。E-mail:nufezhangchao@126.com。 |
收稿日期: 2019-11-12
修回日期: 2020-06-11
网络出版日期: 2025-04-23
基金资助
国家社会科学基金重大招标项目(18VSJ023)
浙江省哲学社会科学规划重点课题(20NDJC28Z)
Spatio-Temporal Differentiation of Regional Coordinated Development and Its Influencing Factors in China
Received date: 2019-11-12
Revised date: 2020-06-11
Online published: 2025-04-23
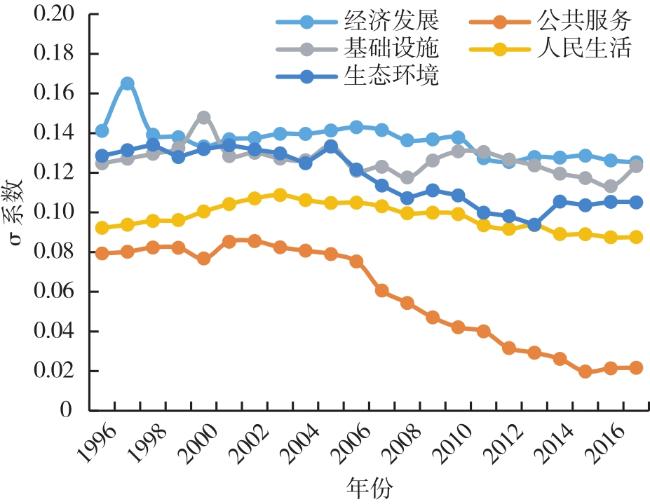
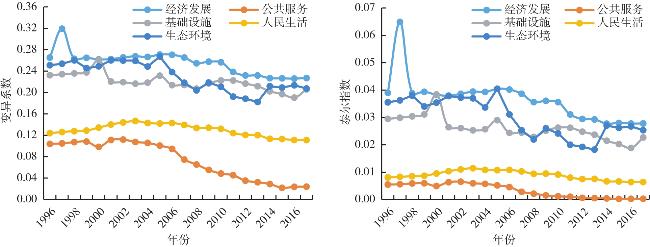
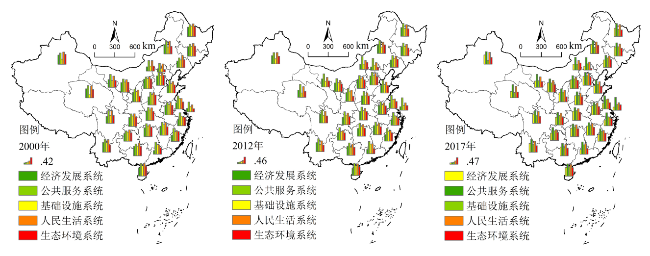
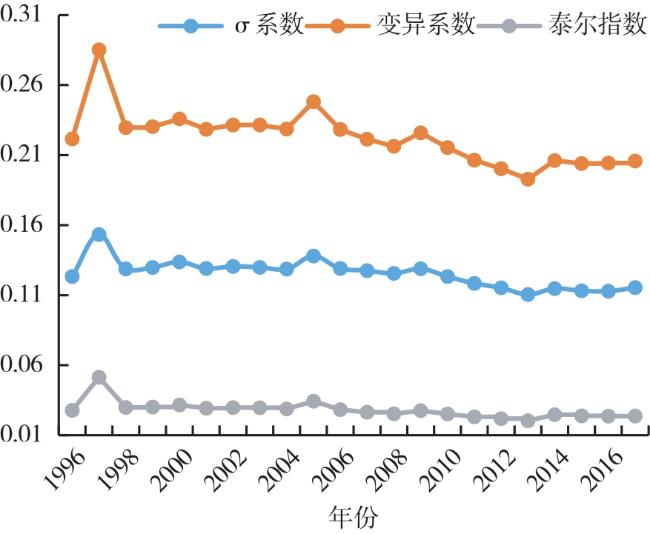
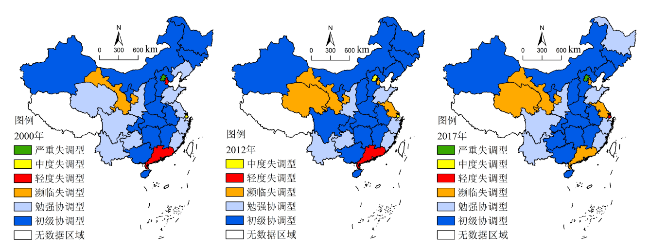
从新时代区域协调发展目标入手,基于经济发展、公共服务、基础设施、人民生活以及生态环境5个子系统构建区域协调发展综合评价体系,运用熵值法、局部协调发展测度法测算了1996—2017年我国30个省域的区域协调发展水平,借助σ系数、变异系数、泰尔指数及GIS可视化表达方法刻画了其时空分异特征,利用双向固定效应模型分析了其影响因素。结果表明:①各子系统区域协调发展的绝对差异和相对差异均呈缩减态势,除生态环境系统外,其余四个系统低等级协调发展类型省域数量均逐年递减,高等级协调发展类型省域数量均逐年增加。②区域协调发展的绝对差异和相对差异均呈缩小特征,各省区域协调发展水平普遍较低,最高水平的省域仅处于初级协调发展阶段,较高水平省域主要分布在中部地区,较低水平省域主要聚集于东部沿海和西北地区。③经济发展和生态环境系统协调发展对区域协调发展的正向作用较大,基础设施系统协调发展的正向作用较小,公共服务和人民生活系统协调发展均未产生显著正向作用。④东西部省域属于经济发展引领型的区域协调发展,而中部省域则属于生态环境引领型,我国区域协调发展的前两个阶段均属于经济发展引领型的区域协调发展,而当前阶段则属于生态环境引领型。
张超 , 钟昌标 , 蒋天颖 , 李兴远 . 我国区域协调发展时空分异及其影响因素[J]. 经济地理, 2020 , 40(9) : 15 -26 . DOI: 10.15957/j.cnki.jjdl.2020.09.002
Starting from the goal of regional coordinated development in the new era,a comprehensive evaluation system of regional coordinated development is established based on five subsystems of economic development,public service,infrastructure,people's life and ecological environment.In this paper,entropy method and local coordinated development measure method are used to measure the regional coordinated development level of 30 provinces in China from 1996 to 2017. With the help of σ coefficient,variation coefficient,Theil index and GIS visual expression method,the spatio-temporal differentiation characteristics are depicted,and the two-way fixed effect panel model is used to analyze the influencing factors.The results show that: 1) The absolute and relative differences of regional coordinated development of each subsystem are decreasing. Except for the ecological environment system,the number of low-level coordinated development type provinces in the other four systems is decreasing year by year,and the number of high-level coordinated development type provinces is increasing year by year. 2) The absolute and relative differences of regional coordinated development are narrowing. The level of regional coordinated development in all provinces is generally low. The highest level of provinces is only in the primary stage of coordinated development. The higher level provinces are mainly distributed in the central region,and the lower level provinces are mainly concentrated in the eastern coastal and northwest regions. 3) The coordinated development of economic development and ecological environment system has a greater positive effect on the coordinated development of the region,the positive effect of coordinated development of infrastructure system is smaller,and the coordinated development of public service and people's living system have no significant positive effect. 4) The eastern and Western provinces belong to the regional coordinated development led by economic development,while the central provinces belong to the ecological environment leading type.The first two stages of China's regional coordinated development belong to the economic development leading type of regional coordinated development,while the current stage belongs to the ecological environment leading type.
表1 区域发展综合评价指标体系Tab.1 Comprehensive evaluation index system of regional development |
| 目标层 | 一级指标 | 二级指标 | 三级指标 | 指标单位 | 指标性质 |
|---|---|---|---|---|---|
| 区域发展综合指数 | 经济发展系统 | 经济水平 | 人均GDP | 元/人 | + |
| 经济结构 | 第三产业占GDP 的比重 | % | + | ||
| 经济效益 | 人均财政收入 | 元/人 | + | ||
| 经济外向 | 外贸依存度 | % | + | ||
| 公共服务系统 | 公共教育 | 人均受教育年限 | 年/人 | + | |
| 就业服务 | 城镇居民就业率 | % | + | ||
| 医疗保障 | 每万人医疗机构床位 | 张/万人 | + | ||
| 文化建设 | 电视节目综合人口覆盖率 | % | + | ||
| 基础设施系统 | 交通设施 | 铁路密度 | km/万km2 | + | |
| 公路密度 | km/万km2 | + | |||
| 通信设施 | 人均邮电业务总量 | 元/人 | + | ||
| 人民生活系统 | 收入水平 | 农村居民人均可支配收入 | 元/人 | + | |
| 城镇居民人均可支配收入 | 元/人 | + | |||
| 消费水平 | 农村居民人均消费支出 | 元/人 | + | ||
| 城镇居民人均消费支出 | 元/人 | + | |||
| 生态环境系统 | 资源规模 | 人均电力供给 | kW·h/人 | + | |
| 人均供水总量 | m3/人 | + | |||
| 环境保护 | 城市绿地覆盖率 | % | + | ||
| 工业固体废物综合利用率 | % | + |
表2 中国区域协调发展度等级划分标准Tab.2 Classification standard of regional coordinated development degree in China |
| 协调区间 | [0,0.1) | [0.1,0.2) | [0.2,0.3) | [0.3,0.4) | [0.4,0.5] | [0.5,0.6) | [0.6,0.7) | [0.7,0.8) | [0.8,0.9) | [0.9,1] |
| 协调等级 | 极度失调 | 严重失调 | 中度失调 | 轻度失调 | 濒临失调 | 勉强协调 | 初级协调 | 中级协调 | 良好协调 | 优质协调 |
图1 1996—2017年我国五个子系统区域协调发展的σ系数Fig.1 σ coefficient of regional coordinated development of five subsystems in China from 1996 to 2017 |
表3 基准回归结果Tab.3 Benchmark regression results |
| 解释变量 | (1) | (2) | (3) | (4) | (5) | (6) |
|---|---|---|---|---|---|---|
| lnJJXT | 0.6822***(48.04) | 0.6508***(49.20) | 0.5344***(49.64) | 0.5400***(49.23) | 0.6778***(51.71) | 0.6448***(51.34) |
| lnGGXT | -0.1830***(-9.11) | -0.1650***(-8.91) | -0.1806***(-6.77) | -0.1581***(-8.07) | -0.1751***(-5.91) | -0.1757***(-6.02) |
| lnJCXT | 0.1116***(5.44) | 0.1160***(6.88) | 0.1180***(11.83) | 0.1175**(11.62) | 0.0897***(4.47) | 0.1026***(6.05) |
| lnSHXT | -0.1607***(-3.61) | -0.2095***(-5.84) | -0.0808***(-3.20) | -0.1088(-4.27) | 0.0376(0.81) | -0.0951***(-2.57) |
| lnSTXT | 0.4245***(29.41) | 0.4148***(32.55) | 0.4462***(42.44) | 0.4508***(42.97) | 0.4027***(29.40) | 0.3936***(30.80) |
| 常数项 | 0.1332***(7.06) | 0.0971***(7.60) | 0.0767***(13.98) | 0.0797(14.60) | 0.1483***(7.31) | 0.0874***(5.75) |
| R2 | 0.9669 | 0.9676 | 0.9711 | 0.9712 | 0.9659 | 0.9692 |
| F统计量 | 686.17(P=0.00) | 4 709.52(P=0.00) | 166.24(P=0.00) | |||
| 个体固定效应 | 是 | 否 | 否 | 否 | 是 | 否 |
| 个体随机效应 | 否 | 是 | 否 | 否 | 否 | 是 |
| 时间固定效应 | 否 | 否 | 是 | 否 | 是 | 否 |
| 时间随机效应 | 否 | 否 | 否 | 是 | 否 | 是 |
| F检验 | F=18.69,P=0.00 | F=3.27,P=0.00 | F=23.27,P=0.00 | |||
| Hausman检验 | chi2=61.02,P=0.00 | chi2=54.95,P=0.00 | chi2=59.64,P=0.00 | |||
表4 地区异质性分析结果Tab.4 Results of regional heterogeneity analysis |
| 解释变量 | 东部地区 | 中部地区 | 西部地区 |
|---|---|---|---|
| lnJJXT | 0.7473***(52.55) | 0.1695***(4.80) | 0.3557***(10.88) |
| lnGGXT | -0.3204***(-8.73) | 0.1506***(2.68) | 0.0607(1.14) |
| lnJCXT | 0.0943***(2.99) | 0.2059***(5.80) | 0.1051***(3.32) |
| lnSHXT | 0.0706(1.27) | -0.2584**(-2.25) | -0.0318(-0.38) |
| lnSTXT | 0.4995***(31.33) | 0.4363***(10.82) | 0.2279***(9.41) |
| 常数项 | 0.3528***(10.28) | -0.0548(-1.35) | -0.1329***(-3.44) |
| R2 | 0.9802 | 0.8221 | 0.7500 |
| F统计量 | 198.86(P=0.00) | 33.35(P=0.00) | 12.02(P=0.00) |
| 个体固定效应 | 是 | 是 | 是 |
| 时间固定效应 | 是 | 是 | 是 |
| F检验 | F=31.73,P=0.00 | F=7.97,P=0.00 | F=42.50,P=0.00 |
| Hausman检验 | chi2=62.26,P=0.00 | chi2=49.30,P=0.00 | chi2=18.21,P=0.00 |
表5 阶段异质性分析结果Tab.5 Results of stage heterogeneity analysis |
| 解释变量 | 1996—2000年 | 2001—2012年 | 2013—2017年 |
|---|---|---|---|
| lnJJXT | 0.8054***(54.38) | 0.4437***(19.81) | 0.2792***(6.96) |
| lnGGXT | -0.1122(-0.67) | 0.0184(0.67) | 0.0880(0.51) |
| lnJCXT | -0.0295(-0.44) | 0.1130***(5.65) | 0.1623***(3.77) |
| lnSHXT | 0.2235*(1.62) | 0.1335***(2.70) | 0.2100(1.13) |
| lnSTXT | 0.1566**(2.16) | 0.3071***(22.89) | 0.6569***(21.82) |
| 常数项 | 0.0552(0.47) | 0.0305(1.49) | 0.1996***(2.76) |
| R2 | 0.9363 | 0.9803 | 0.9772 |
| F统计量 | 375.71(P=0.00) | 106.81(P=0.00) | 72.19(P=0.00) |
| 个体固定效应 | 是 | 是 | 是 |
| 时间固定效应 | 是 | 是 | 是 |
| F检验 | F=15.73,P=0.00 | F=38.78,P=0.00 | F=16.90,P=0.00 |
| Hausman检验 | chi2=52.79, P=0.00 | chi2=21.13, P=0.00 | chi2=20.82, P=0.00 |
| [1] |
|
| [2] |
|
| [3] |
新华网. 习近平同志党的十九大报告[EB/OL]. http://www.xi-nhuanet.com//2017-10/27/c_1121867529.htm, 2017-10-27.
|
| [4] |
纪成君, 郭晓玲. 基于SVR的区域协调发展评价——以辽宁沿海经济带为例[J]. 科技与经济, 2013, 26(4):67-70.
|
| [5] |
尹秀英, 邱玉臣. 少数民族地区区域协调发展水平评价与分析——以呼伦贝尔市调查数据为例[J]. 黑龙江民族丛刊, 2016(5):73-77.
|
| [6] |
乔旭宁, 张婷, 安春华, 等. 河南省区域发展协调度评价[J]. 地域研究与开发, 2014, 33(3):33-38.
|
| [7] |
吴穹, 仲伟周. 区域协调发展与产业结构变迁——基于演化博弈理论的GMM实证分析[J]. 河南社会科学, 2018, 26(10):59-63.
|
| [8] |
姚鹏, 叶振宇. 中国区域协调发展指数构建及优化路径分析[J]. 财经问题研究, 2019(9):80-87.
|
| [9] |
王继源. 我国区域协调发展评价研究[J]. 宏观经济管理, 2019(3):41-49.
|
| [10] |
|
| [11] |
王维, 陈云, 王晓伟, 等. 长江经济带区域发展差异时空格局研究[J]. 长江流域资源与环境, 2017, 26(10):1489-1 497.
|
| [12] |
闫东升, 王晖, 孙伟. 长江三角洲区域发展差距时空演变驱动因素研究[J]. 长江流域资源与环境, 2019, 28(3):517-529.
|
| [13] |
曹玉华, 夏永祥, 毛广雄, 等. 淮河生态经济带区域发展差异及协同发展策略[J]. 经济地理, 2019, 39(9):213-221.
|
| [14] |
李宁, 李铁滨, 房艳刚, 等. 吉林省县域经济效率时空格局演化研究[J]. 地理科学, 2019, 39(8):1293-1 301.
|
| [15] |
晁静, 赵新正, 李同昇, 等. 长江经济带三大城市群经济差异演变及影响因素——基于多源灯光数据的比较研究[J]. 经济地理, 2019, 39(5):92-100.
|
| [16] |
于洋, 张丽梅, 陈才. 我国东部地区经济—能源—环境—科技四元系统协调发展格局演变[J]. 经济地理, 2019, 39(7):14-21.
|
| [17] |
周亮, 车磊, 孙东琪. 中国城镇化与经济增长的耦合协调发展及影响因素[J]. 经济地理, 2019, 39(6):97-107.
|
| [18] |
王耕, 李素娟, 马奇飞. 中国生态文明建设效率空间均衡性及格局演变特征[J]. 地理学报, 2018, 73(11):2198-2 209.
|
| [19] |
盖美, 展亚荣. 中国沿海省区海洋生态效率空间格局演化及影响因素分析[J]. 地理科学, 2019, 39(4):616-625.
|
| [20] |
|
| [21] |
|
| [22] |
王维. 长江经济带城乡协调发展评价及其时空格局[J]. 经济地理, 2017, 37(8):60-66,92.
|
| [23] |
王颖, 孙平军, 李诚固, 等. 2003年以来东北地区城乡协调发展的时空演化[J]. 经济地理, 2018, 38(7):59-66.
|
| [24] |
徐生霞, 刘强, 陆小莉. 中国区域发展不平衡的四维模式分解及影响因素研究——基于门限回归模型的测度[J]. 经济问题探索, 2019(4):13-26.
|
| [25] |
|
| [26] |
|
| [27] |
宋建, 王静. 区域城乡收入差距的动态收敛性与影响因素探究[J]. 经济经纬, 2019, 36(1):18-25.
|
| [28] |
|
| [29] |
|
| [30] |
高赢. 中国八大综合经济区绿色发展绩效及其影响因素研究[J]. 数量经济技术经济研究, 2019, 36(9):3-23.
|
| [31] |
黄禹铭. 东北三省城乡协调发展格局及影响因素[J]. 地理科学, 2019, 39(8):1302-1 311.
|
| [32] |
周佳宁, 秦富仓, 刘佳, 等. 多维视域下中国城乡融合水平测度、时空演变与影响机制[J]. 中国人口·资源与环境, 2019, 29(9):166-176.
|
| [33] |
中国新闻网. 习近平明确区域协调发展的三大目标[EB/OL]. http://www.chinanews.com/gn/2017/12-28/8411049.shtml, 2017-12-28/2019-10-10.
|
| [34] |
新华社. 中共中央国务院关于建立更加有效的区域协调发展新机制的意见[EB/OL]. http://www.gov.cn/zhengce/2018-11/29/content_5344537.htm, 2018-11-29/2019-10-10.
|
| [35] |
郭庆然, 陈政, 陈晓亮, 等. 我国农民工城市融入度测度及区域差异研究——来自CHIP数据的经验分析[J]. 经济地理, 2019, 39(1):140-148.
|
| [36] |
李红锦, 张宁, 李胜会. 区域协调发展:基于产业专业化视角的实证[J]. 中央财经大学学报, 2018(6):106-118.
|
| [37] |
白雪, 宋玉祥, 浩飞龙. 东北地区“五化”协调发展的格局演变及影响机制[J]. 地理研究, 2018, 37(1):67-80.
|
| [38] |
张改素, 王发曾, 康珈瑜, 等. 长江经济带县域城乡收入差距的空间格局及其影响因素[J]. 经济地理, 2017, 37(4):42-51.
|
| [39] |
蒋天颖, 张超, 孙平, 等. 浙江省县域金融创新空间分异及驱动因素[J]. 经济地理, 2019, 39(4):146-154.
|
| [40] |
许南, 黄颖. 中国金融服务业产业内贸易的影响因素与发展对策[J]. 经济地理, 2014, 34(5):91-96.
|
| [41] |
孙久文. 论新时代区域协调发展战略的发展与创新[J]. 国家行政学院学报, 2018(4):109-114,151.
|
/
| 〈 |
|
〉 |