
中国CO2排放的空间分异与驱动因素——基于198个地级及以上城市数据的分析
|
王兴民(1987—),男,山东平邑人,博士研究生。主要研究方向为城市经济与区域科学、环境经济与政策。E-mail:wxminmin1987@163.com。 |
收稿日期: 2019-09-20
修回日期: 2020-07-23
网络出版日期: 2025-04-22
基金资助
国家自然科学基金面上项目(41871219)
国家自然科学基金面上项目(41671396)
国家重点研发计划(973)
Spatial Differentiation and Driving Factors of CO2 Emissions:Analysis Based on 198 Cities at Prefecture Level and Above in China
Received date: 2019-09-20
Revised date: 2020-07-23
Online published: 2025-04-22
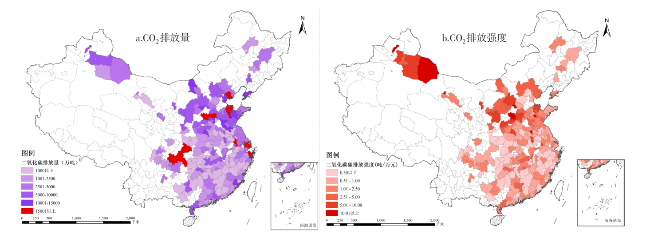
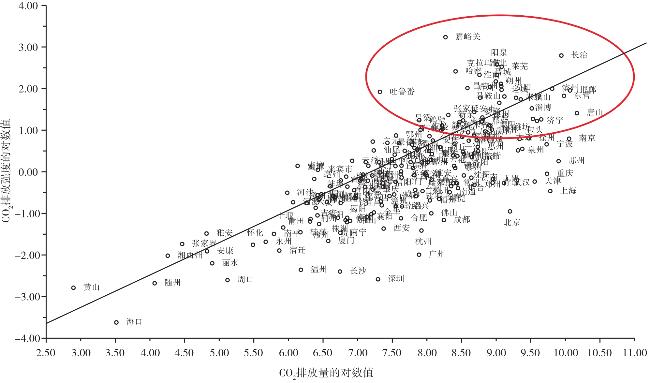
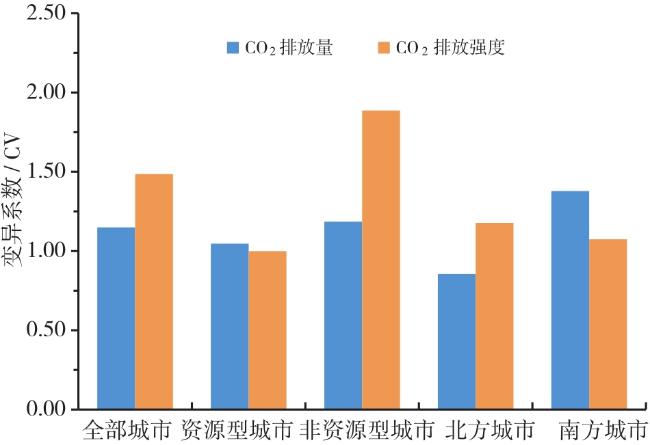
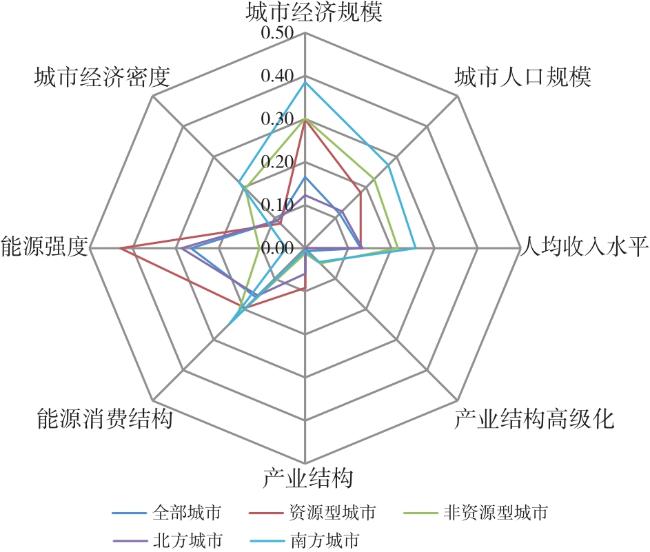
国家减排目标和政策的落实需要城市的深度参与和有力执行。但是,城市的CO2排放存在空间分异性,且驱动因素及其贡献度各有不同。文章综合运用排放系数法、变异系数法、K-means聚类和地理探测器等方法,对城市尺度的中国CO2排放空间分异与驱动因子进行探究,结论如下:①中国城市层面的CO2排放存在明显的空间分异,排放强度的空间分异性较为显著,而排放量的空间分异性相对较小,且以非资源型城市CO2排放强度的城市间差异最大。②能源强度是资源型和北方城市CO2排放空间分异的主导驱动因子,城市经济规模是非资源型和南方城市CO2排放空间分异的主导驱动因子,其他驱动因子的决定力排序和决定力大小则各有不同。③产业结构及其高级化水平对各类城市CO2排放空间分异的决定力均较小,城市经济密度对资源型和北方城市的CO2排放空间分异的决定力较小。④影响资源型和北方城市CO2排放空间分异的关键交互因子均包含能源强度,而影响非资源型和南方城市CO2排放空间分异的关键交互因子比较复杂,不存在对城市CO2空间分异格局起关键性决定作用的交互因子。⑤一些决定力微弱的因子在与其他因子叠加后,会产生非线性增强,会显著提高其对城市CO2排放空间分异的决定力水平。
王兴民 , 吴静 , 白冰 , 王铮 . 中国CO2排放的空间分异与驱动因素——基于198个地级及以上城市数据的分析[J]. 经济地理, 2020 , 40(11) : 29 -38 . DOI: 10.15957/j.cnki.jjdl.2020.11.004
The implementation of China's Emission reduction targets and policies requires the deep participation and strong implementation of cities. However,due to the differences in city scale,structure and technology level,there are spatial differentiation in urban CO2 emissions,the driving factors and contribution. In this paper,the methods of emission coefficient,coefficient of variation,K-means clustering and GeoDetector are used to explore the spatial differentiation and driving factors of urban CO2 emissions in China. The conclusions are as follows: 1) There are obvious spatial differentiation of urban CO2 emissions in China,and the spatial differentiation of emission intensity are more significant,while the spatial differentiation of emissions are relatively small; moreover,the differences of CO2 emission intensity in non-resource-based cities are the greatest among cities. 2) Energy intensity is the dominant driving factor for spatial differentiation of CO2 emissions in resource-based cities and Northern cities. Urban economic scale is the dominant driving factor for spatial differentiation of CO2 emissions in non-resource-based cities and Southern cities,while the ranking and contribution of other driving factors are different. 3) The industrial structure and the upgrading of industrial structure have less decisive power on spatial differentiation of CO2 emissions,and the economic density of cities has less decisive power spatial differentiation of CO2 emissions in resource-based cities and Northern cities. 4) The key interaction factors including energy intensity affect the spatial differentiation of carbon emissions in resource-based cities and Northern cities; while the key interaction factors affecting the spatial differentiation of carbon dioxide emissions in non-resource-based cities and Southern cities are more complex,and there is no spatial superposition of single factor with other factors,which plays a key role in the spatial differentiation of urban CO2. 5) Some driving factors with weak determinants will be non-linear enhanced when they are superimposed with other factors. These interactive factors will significantly improve the determinants of spatial differentiation of urban CO2 emissions. The above conclusions are of great significance for different cities to formulate differentiated low-carbon policies.
表1 不同能源品种的标准煤折算系数和CO2排放系数Tab.1 Standard coal conversion coefficient and CO2 emission coefficient of different energy types |
| 能源品种 | 标准煤折算系数(kgce/kg) | CO2排放系数(104t/104t) | 能源品种 | 标准煤折算系数(kgce/kg) | CO2排放系数(104t/104t) | |
|---|---|---|---|---|---|---|
| 原煤 | 0.7143 | 2.492 | 燃料油 | 1.4286 | 2.219 | |
| 洗精煤 | 0.9000 | 2.631 | 液化石油气 | 1.7143 | 1.828 | |
| 其他洗煤 | 0.2857 | 2.492 | 天然气 | 1.2143 | 2.162 | |
| 煤制品 | 0.6000 | 2.631 | 液化天然气 | 1.7572 | 2.660 | |
| 焦炭 | 0.9714 | 2.977 | 炼厂干气 | 1.5714 | 1.654 | |
| 其他焦化产品 | 1.3000 | 2.341 | 其他石油制品 | 1.2000 | 2.126 | |
| 原油 | 1.4286 | 2.104 | 焦炉煤气 | 0.6143 kgce/m3 | 1.288 | |
| 汽油 | 1.4714 | 1.988 | 高炉煤气 | 0.1286 kgce/m3 | 7.523 | |
| 煤油 | 1.4714 | 2.051 | 其他煤气 | 0.3571 kgce/m3 | 1.288 | |
| 柴油 | 1.4571 | 2.167 | 其他燃料 | 2.4567 |
表2 中国城市尺度的CO2排放空间分异格局驱动因素指标体系Tab.2 Index system of driving factors about spatial differentiation pattern of urban CO2 emissions in China |
| 驱动因素 | 探测因子 | 指标解释 |
|---|---|---|
| 总量因素 | 城市经济规模(GRP) | 地区生产总值(单位:万元) |
| 城市人口规模(URS) | 市区常住人口(单位:万人) | |
| 发展水平 | 人均收入水平(PGRP) | 人均地区生产总值(单位:元) |
| 产业结构高级化(HIS) | 第三产业增加值与第二产业增加值之比(单位:%) | |
| 结构因素 | 产业结构(INS) | 第二产业占城市地区生产总值的比重(单位:%) |
| 能源消费结构(ECS) | 煤炭能源占能源消费总量的比重(单位:%) | |
| 效率因素 | 能源强度(ECI) | 单位地区生产总值的能耗(单位:t/万元) |
| 城市经济密度(UED) | 地区生产总值与行政区土地面积的比值(单位:万元/km2) |
图4 中国地级以上城市CO2排放空间分异驱动因子的决定力分布Fig.4 Determinant distribution of driving factors for spatial differentiation of CO2 emissions in prefectural cities of China |
表3 中国地级以上城市CO2排放空间分异的交互作用因子探测结果Tab.3 Detection of interaction factor for spatial differentiation of CO2 emissions in prefectural cities of China |
| 探测因子 | 全部 城市 | 资源型 城市 | 非资源 型城市 | 北方 城市 | 南方 城市 |
|---|---|---|---|---|---|
| 0.210 | 0.368 | 0.343 | 0.243 | 0.451 | |
| 0.272 | 0.413 | 0.382 | 0.251 | 0.464 | |
| 0.184 | 0.313 | 0.327 | 0.164 | 0.414 | |
| 0.226 | 0.492 | 0.360 | 0.281 | 0.467 | |
| 0.326 | 0.573 | 0.473 | 0.332 | 0.638 | |
| 0.641 | 0.873 | 0.493 | 0.766 | 0.456 | |
| 0.252 | 0.500 | 0.424 | 0.219 | 0.505 | |
| 0.334 | 0.473 | 0.494 | 0.339 | 0.628 | |
| 0.134 | 0.212 | 0.258 | 0.210 | 0.299 | |
| 0.163 | 0.352 | 0.278 | 0.251 | 0.368 | |
| 0.353 | 0.523 | 0.519 | 0.468 | 0.730 | |
| 0.535 | 0.709 | 0.421 | 0.655 | 0.337 | |
| 0.197 | 0.398 | 0.353 | 0.285 | 0.409 | |
| 0.162 | 0.177 | 0.271 | 0.217 | 0.359 | |
| 0.242 | 0.248 | 0.363 | 0.291 | 0.461 | |
| 0.350 | 0.426 | 0.508 | 0.390 | 0.690 | |
| 0.498 | 0.716 | 0.382 | 0.560 | 0.333 | |
| 0.244 | 0.265 | 0.323 | 0.280 | 0.355 | |
| 0.072 | 0.128 | 0.091 | 0.120 | 0.132 | |
| 0.231 | 0.228 | 0.375 | 0.240 | 0.506 | |
| 0.317 | 0.460 | 0.176 | 0.350 | 0.102 | |
| 0.136 | 0.112 | 0.271 | 0.112 | 0.295 | |
| 0.296 | 0.375 | 0.378 | 0.418 | 0.402 | |
| 0.327 | 0.552 | 0.162 | 0.417 | 0.061 | |
| 0.167 | 0.194 | 0.271 | 0.192 | 0.264 | |
| 0.459 | 0.600 | 0.377 | 0.510 | 0.300 | |
| 0.258 | 0.460 | 0.416 | 0.405 | 0.454 | |
| 0.462 | 0.604 | 0.357 | 0.526 | 0.276 |
| [1] |
|
| [2] |
|
| [3] |
|
| [4] |
|
| [5] |
方叶兵, 王礼茂, 牟初夫, 等. 中国石油终端利用碳排放空间分异及影响因素[J]. 资源科学, 2017, 39(12):2233-2 246.
|
| [6] |
赵领娣, 吴栋. 中国能源供给侧碳排放核算与空间分异格局[J]. 中国人口·资源与环境, 2018, 28(2):48-58.
|
| [7] |
|
| [8] |
|
| [9] |
|
| [10] |
|
| [11] |
|
| [12] |
|
| [13] |
|
| [14] |
|
| [15] |
王劲峰, 徐成东. 地理探测器:原理与展望[J]. 地理学报, 2017, 72(1):116-134.
|
| [16] |
秦耀辰, 等. 低碳城市研究的模型与方法[M]. 北京: 科学出版社, 2013.
|
| [17] |
丁悦, 蔡建明, 任周鹏, 等. 基于地理探测器的国家级经济技术开发区经济增长率空间分异及影响因素[J]. 地理科学进展, 2014, 33(5):657-666.
|
| [18] |
程钰, 任建兰, 陈延斌, 等. 中国环境规制效率空间格局动态演变及其驱动机制[J]. 地理研究, 2016, 35(1):123-136.
|
| [19] |
|
| [20] |
|
| [21] |
|
| [22] |
|
| [23] |
|
| [24] |
|
| [25] |
|
| [26] |
王兴民, 吴静, 王铮, 等. 中国城市CO2排放核算及其特征分析[J]. 城市与环境研究, 2020(1):67-80.
|
/
| 〈 |
|
〉 |