
中国大陆上市公司研发投入空间格局及动力机制——以500强为例
|
沈泽洲(1997—),男,江苏镇江人,硕士研究生。主要研究方向为区域经济与区域创新。E-mail:1104150152@qq.com。 |
收稿日期: 2019-12-05
修回日期: 2020-07-04
网络出版日期: 2025-04-22
基金资助
国家自然科学基金项目(41571110)
上海市科委软科学重点课题(20692102600)
中国侨联课题(19BZQK240)
Analysis on the Spatial Pattern and Dynamic Mechanism of R&D Investment of Listed Companies in Mainland China:Take the Top 500 as an Example
Received date: 2019-12-05
Revised date: 2020-07-04
Online published: 2025-04-22
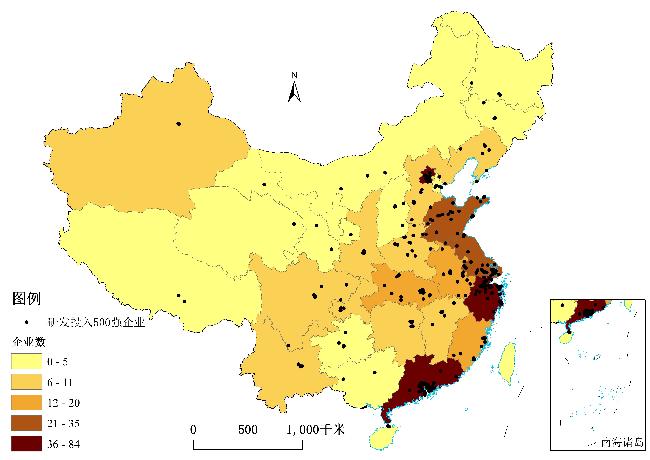
基于2017年中国大陆上市公司500强的研发投入(R&D)数据,运用探索性空间数据分析、核密度分析、主成分回归分析等方法,探究其空间分布特征和动力机制。研究发现:500强企业空间分布特征与经济整体格局相吻合,呈“东强西弱”的特点。第二产业呈现出由中部向西部转移的态势,第三产业则处于由东部向中部转移的趋势。500强企业的空间集聚特征表现为“三核心”模式,研发投入金额的集聚特征表现为“单核心”模式,研发费用占营业收入的比重的集聚特征表现为“一主核两次核”模式。研发投入的热点区域位于京津冀地区,冷点区域位于河南省以及河南、安徽、山东、江苏交界处。各省市对于企业研发投入影响的空间异质性并不明显;以高校和研究所为代表的产学研联系对企业研发投入的促进作用最为显著;其次为产业环境;最后经济基础、交通条件、政府支持、劳动力基础四个方面都对企业的研发投入具有一定的促进作用。
沈泽洲 , 王承云 , 王永正 . 中国大陆上市公司研发投入空间格局及动力机制——以500强为例[J]. 经济地理, 2020 , 40(11) : 131 -139 . DOI: 10.15957/j.cnki.jjdl.2020.11.015
Based on the top 500 research and development investment data of Listed Companies in mainland China in 2017,exploratory spatial data analysis,nuclear density analysis,principal component regression analysis and other methods are used to explore their spatial distribution characteristics and dynamic mechanism. It is found that the spatial distribution characteristics of the top 500 enterprises are consistent with the overall economic pattern,showing the characteristics of "strong in the East and weak in the west". The second industry is in the development trend of transferring from the middle to the west,and the third industry is in the development trend of transferring from the east to the middle. The spatial agglomeration characteristics of the top 500 R&D investment enterprises are shown as "three core" mode,the agglomeration characteristics of R&D investment amount are shown as "single core" mode,and the agglomeration characteristics of R&D expenses as a proportion of business income are shown as "one main core and two core" mode. The hot spot area of R&D investment is located in Beijing Tianjin Hebei region,and the cold spot area is located in Henan Province and the junction of Henan,Anhui,Shandong and Jiangsu. The spatial heterogeneity of the impact of provinces and cities on the R&D investment of enterprises is not obvious. The industry university research association,represented by universities and research institutes,plays the most significant role in promoting the R&D investment of enterprises; secondly,the industrial environment; finally,the economic basis,traffic conditions,government support,and labor force basis all play a certain role in promoting the R&D investment of enterprises.
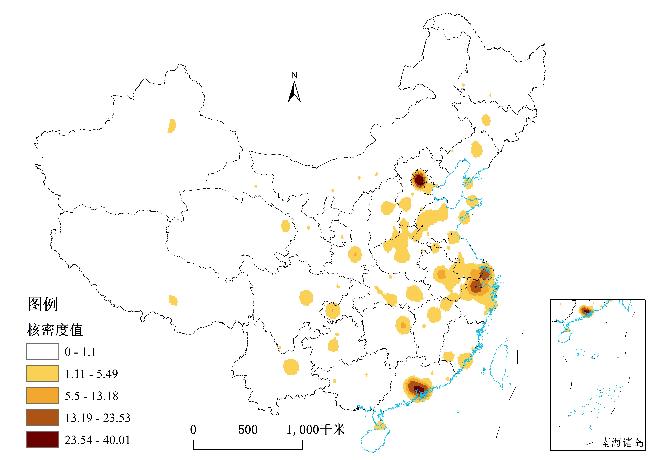
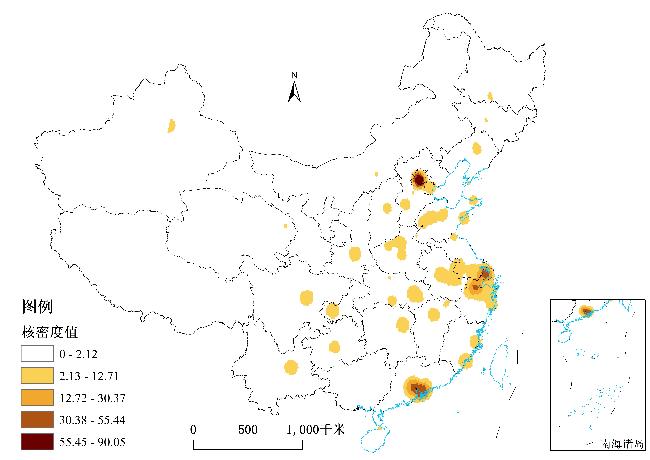
图5 中国大陆上市公司研发投入500强空间集聚情况Fig.5 Spatial agglomeration of R&D investment of top 500 listed companies in mainland China |
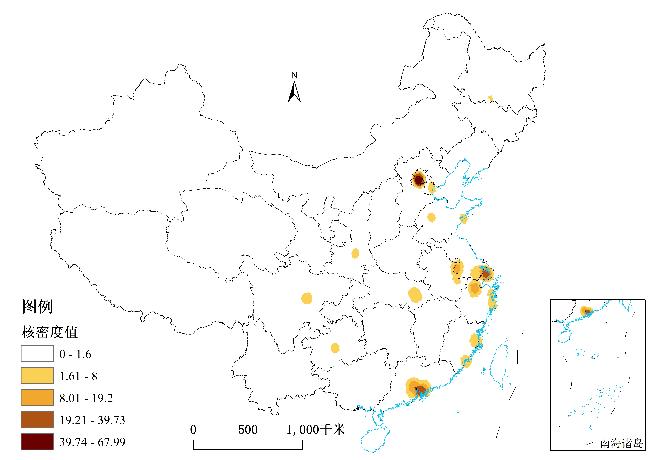
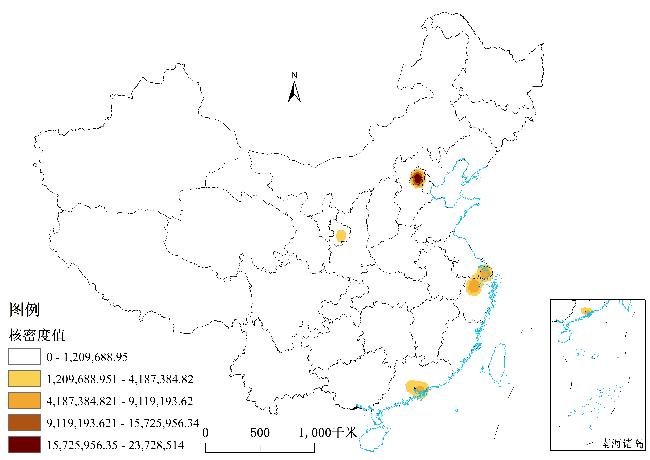
图6 中国大陆上市公司研发投入500强研发投入额集聚情况Fig.6 R&D investment concentration of top 500 listed companies in mainland China |
表1 研发投入强度空间分异动力机制Tab.1 Dynamic mechanism of spatial differentiation of R&D input intensity |
| 一级指标 | 二级指标 | 单位 |
|---|---|---|
| 政府支持 | 政府R&D经费内部支出X1 | 万元 |
| 劳动力基础 | R&D人员全时当量X2 | 万人/年 |
| 研发环境 | 高等学校数X3 | 个 |
| 研究与开发机构数X4 | 个 | |
| 经济基础 | 地方GDP X5 | 亿元 |
| 产业环境 | 第二产业增加值X6 | 亿元 |
| 交通条件 | 第三产业增加值X7 | 亿元 |
| 客运量X8 | 万人 |
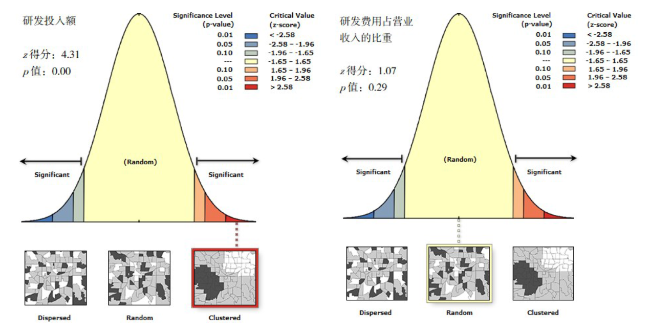
图8 中国大陆上市公司研发投入500强空间自相关Fig.8 Spatial autocorrelation of 500 strong R & D investment in Chinese mainland listed companies |
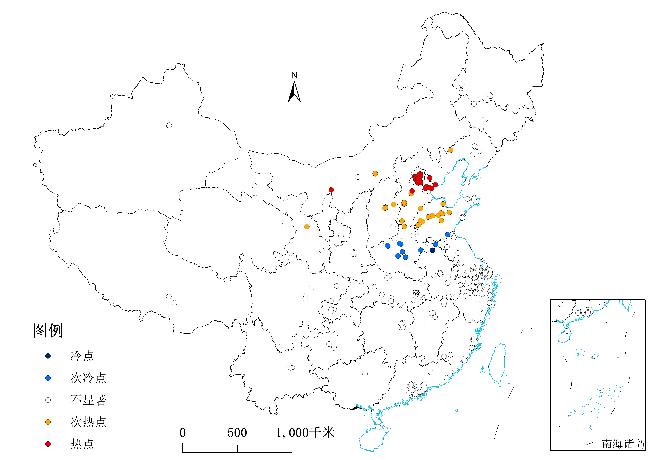
图9 中国大陆上市公司研发投入500强企业热点分布图Fig.9 Hot spots of top 500 R&D investment enterprises of Listed Companies in mainland China |
表2 因子评分系数矩阵Tab.2 Factor scoring coefficient matrix |
| 被解释因子 | F1 | F2 |
|---|---|---|
| 政府R&D经费内部支出(万元) | -0.170 | 0.596 |
| R&D人员全时当量(万人/年) | 0.163 | 0.031 |
| 高等学校数(个) | 0.178 | -0.017 |
| 研究与开发机构数(个) | -0.104 | 0.510 |
| 地方GDP(亿元) | 0.210 | -0.062 |
| 第二产业增加值(亿元) | 0.245 | -0.156 |
| 第三产业增加值(亿元) | 0.165 | 0.042 |
| 客运量(万人) | 0.195 | -0.087 |
表3 空间依赖性检验Tab.3 Spatial dependence test |
| TEST | MI/DF | 统计值 | P值 |
|---|---|---|---|
| Moran's I (error) | 0.0207 | 0.7382 | 0.46041 |
| Lagrange Multiplier (lag) | 1 | 0.0072 | 0.93239 |
| Robust LM (lag) | 1 | 0.1384 | 0.70987 |
| Lagrange Multiplier (error) | 1 | 0.0461 | 0.82994 |
| Robust LM (error) | 1 | 0.1773 | 0.67367 |
| Lagrange Multiplier (SARMA) | 2 | 0.1845 | 0.91186 |
表4 GWR估计结果Tab.4 Estimated results of GWR |
| 省市 | 局部R2 | F1系数 | F2系数 | 残差 | 省市 | 局部R2 | F1系数 | F2系数 | 残差 |
|---|---|---|---|---|---|---|---|---|---|
| 黑龙江 | 0.636655 | 0.075135 | 0.693374 | -0.491140 | 广西 | 0.630489 | 0.075022 | 0.689076 | -0.263580 |
| 新疆 | 0.635951 | 0.073263 | 0.690500 | -0.026110 | 广东 | 0.630288 | 0.075325 | 0.689339 | 0.308713 |
| 山西 | 0.633974 | 0.074804 | 0.691155 | -0.408130 | 海南 | 0.629213 | 0.075229 | 0.688475 | 0.290499 |
| 宁夏 | 0.634010 | 0.074491 | 0.690774 | 0.469412 | 吉林 | 0.635597 | 0.075238 | 0.692804 | -0.226530 |
| 西藏 | 0.633441 | 0.073573 | 0.689197 | 0.380700 | 辽宁 | 0.634944 | 0.075172 | 0.692284 | -0.594290 |
| 山东 | 0.633651 | 0.075142 | 0.691378 | -0.403480 | 天津 | 0.634396 | 0.075000 | 0.691694 | -0.150480 |
| 河南 | 0.633032 | 0.074991 | 0.690763 | -0.163040 | 青海 | 0.634014 | 0.073958 | 0.690085 | 0.325538 |
| 江苏 | 0.632804 | 0.075333 | 0.691056 | -0.337570 | 甘肃 | 0.634291 | 0.074211 | 0.690601 | -0.158810 |
| 安徽 | 0.632494 | 0.075257 | 0.690747 | -0.114490 | 陕西 | 0.633418 | 0.074694 | 0.690637 | -0.639560 |
| 湖北 | 0.632303 | 0.075010 | 0.690295 | -0.280340 | 内蒙古 | 0.635608 | 0.074645 | 0.692045 | -0.074580 |
| 浙江 | 0.631826 | 0.075506 | 0.690622 | 2.491134 | 重庆 | 0.632138 | 0.074783 | 0.689886 | 0.311799 |
| 江西 | 0.631397 | 0.075319 | 0.690086 | -0.049600 | 河北 | 0.634448 | 0.074932 | 0.691640 | 0.064951 |
| 湖南 | 0.631429 | 0.075086 | 0.689801 | -0.215510 | 上海 | 0.632363 | 0.075503 | 0.690981 | -0.053280 |
| 云南 | 0.631021 | 0.074522 | 0.688783 | -0.245660 | 北京 | 0.634615 | 0.074926 | 0.691744 | 0.779836 |
| 贵州 | 0.631323 | 0.074815 | 0.689373 | 0.059652 | 台湾 | 0.630408 | 0.075768 | 0.690005 | 0.470145 |
| 福建 | 0.631000 | 0.075505 | 0.690060 | -0.068380 | 四川 | 0.632430 | 0.074464 | 0.689667 | -1.008390 |
表5 研发投入强度空间分异动力系数Tab.5 Spatial Differentiation dynamic coefficient of R&D input intensity |
| 一级指标 | 二级指标 | 系数 |
|---|---|---|
| 政府支持 | 政府R&D经费内部支出(万元) | 1.143 |
| 劳动力基础 | R&D人员全时当量(万人/年) | 1.049 |
| 研发环境 | 高等学校数(个) | 163.332 |
| 研究与开发机构数(个) | 217.568 | |
| 经济基础 | 地方GDP(亿元) | 5.543 |
| 产业环境 | 第二产业增加值(亿元) | -40.564 |
| 第三产业增加值(亿元) | 16.283 | |
| 交通条件 | 客运量(万人) | 5.147 |
| [1] |
|
| [2] |
滕堂伟, 方文婷. 新长三角城市群创新空间格局演化与机理[J]. 经济地理, 2017, 37(4):66-75.
|
| [3] |
方远平, 谢蔓. 创新要素的空间分布及其对区域创新产出的影响——基于中国省域的ESDA-GWR分析[J]. 经济地理, 2012, 32(9):8-14.
|
| [4] |
吕拉昌, 黄茹, 廖倩. 创新地理学研究的几个理论问题[J]. 地理科学, 2016, 36(5):653-661.
|
| [5] |
|
| [6] |
|
| [7] |
邹琳, 曹贤忠, 曾刚. 基于ESDA的长三角城市群研发投入空间分异特征及时空演化[J]. 经济地理, 2015, 35(3):73-79.
|
| [8] |
何键芳, 张虹鸥, 叶玉瑶, 等. 广东省区域创新产出的空间相关性研究[J]. 经济地理, 2013, 33(2):117-121,140.
|
| [9] |
刘青, 李贵才, 仝德, 等. 基于ESDA的深圳市高新技术企业空间格局及影响因素[J]. 经济地理, 2011, 31(6):926-933.
|
| [10] |
谭俊涛, 张平宇, 李静. 中国区域创新绩效时空演变特征及其影响因素研究[J]. 地理科学, 2016, 36(1):39-46.
|
| [11] |
徐维祥, 齐昕, 刘程军, 等. 企业创新的空间差异及影响因素研究 ——以浙江为例[J]. 经济地理, 2015, 35(12):50-56.
|
| [12] |
滕堂伟, 覃柳婷, 胡森林. 长三角地区众创空间的地理分布及影响机制[J]. 地理科学, 2018, 38(8):1266-1 272.
|
| [13] |
丁军, 黄茹, 吕拉昌. 基于专利授权数的长江经济带创新差异的多尺度分析[J]. 长江流域资源与环境, 2016, 25(6):868-876.
|
| [14] |
郭泉恩, 孙斌栋. 中国高技术产业创新空间分布及其影响因素——基于面板数据的空间计量分析[J]. 地理科学进展, 2016, 35(10):1218-1 227.
|
| [15] |
李小建. 经济地理学(第二版)[M]. 北京: 高等教育出版社, 1999.
|
| [16] |
何舜辉, 杜德斌, 焦美琪, 等. 中国地级以上城市创新能力的时空格局演变及影响因素分析[J]. 地理科学, 2017, 37(7):1014-1 022.
|
| [17] |
李国平, 王春杨. 我国省域创新产出的空间特征和时空演化——基于探索性空间数据分析的实证[J]. 地理研究, 2012, 31(1):95-106.
|
| [18] |
王承云, 孙飞翔. 长三角城市创新空间的集聚与溢出效应[J]. 地理研究, 2017, 36(6):1046-1 048.
|
| [19] |
王越, 王承云. 长三角城市创新联系网络及辐射能力[J]. 经济地理, 2018, 38(9):130-137.
|
| [20] |
|
| [21] |
|
| [22] |
杜德斌, 孙一飞, 盛垒. 跨国公司在华R&D机构的空间集聚研究[J]. 世界地理研究, 2010, 19(3):1-13.
|
| [23] |
吕国庆, 曾刚, 郭金龙. 长三角装备制造业产学研创新网络体系的演化分析[J]. 地理科学, 2014, 34(9):1051-1 059.
|
| [24] |
曹贤忠, 曾刚, 邹琳. 长三角城市群R&D资源投入产出效率分析及空间分异[J]. 经济地理, 2015, 35(1):104-111.
|
| [25] |
刘树峰, 杜德斌, 覃雄合, 等. 基于创新价值链视角下中国创新效率时空格局与影响因素分析[J]. 地理科学, 2019, 39(2):173-182.
|
| [26] |
汪涛,
|
| [27] |
舒元, 才国伟. 我国省际技术进步及其空间扩散分析[J]. 经济研究, 2007, 16(6):106-118.
|
| [28] |
王春杨, 张超. 中国地级区域创新产出的时空模式研究——基于ESDA的实证[J]. 地理科学, 2014, 34(12):1438-1 444.
|
| [29] |
中国科技发展战略研究小组. 中国区域创新能力报告2013[R]. 北京: 科学出版社, 2014.
|
| [30] |
王鹏. 区域性创新能力评价与指标分析——以河北省为例[J]. 地理与地理信息科学, 2015, 31(6):100-103.
|
| [31] |
张波. 2000—2015年中国大陆人才的空间聚集及时空格局演变分析[J]. 世界地理研究, 2019, 28(4):124-133.
|
| [32] |
毕亮亮, 施祖麟. 长三角城市科技创新能力评价及“区域科技创新圈”的构建—基于因子分析与聚类分析模型的初探[J]. 经济地理, 2008, 28(6):946-951,954.
|
| [33] |
浩飞龙, 关皓明, 王士君. 中国城市电子商务发展水平空间分布特征及影响因素[J]. 经济地理, 2016, 36(2):1-10.
|
| [34] |
张建伟, 苗长虹, 肖文杰. 河南省承接产业转移区域差异及影响因素[J]. 经济地理, 2018, 38(3):106-112.
|
| [35] |
侯纯光, 程钰, 任建兰, 等. 中国创新能力时空格局演变及其影响因素[J]. 地理科学进展, 2016(10): 1 206-1 217.
|
/
| 〈 |
|
〉 |