
中国海洋三次产业经济效率时空演变及影响因素分析
|
王泽宇(1981—),女,辽宁铁岭人,博士,教授。主要研究方向为海洋经济地理。E-mail:wangzeyu2008@163.com。 |
收稿日期: 2020-02-28
修回日期: 2020-09-24
网络出版日期: 2025-04-22
基金资助
国家自然科学基金项目(41671119)
辽宁省社会科学规划基金项目(L20AJY003)
辽宁省社科联青年项目(2020lslktqn-048)
大连市社科院重大调研课题(2020dlskyzz004)
Temporal and Spatial Evolution of the Economic Efficiency of China's Marine Three Industries and Its Influencing Factors
Received date: 2020-02-28
Revised date: 2020-09-24
Online published: 2025-04-22
基于2006—2016年中国沿海11省市面板数据,采用Super-SBM模型、Malmquist生产率指数分解法测度中国海洋三次产业的经济效率及全要素生产率(TFP)变化,利用面板Tobit回归模型分析影响因素。研究表明:①中国沿海11省市海洋三次产业静态效率值绝大部分低于1,存在效率缺失的状况,纯技术效率水平偏低,规模发展相对不足。海洋三次产业TFP年均增长率分别达1.4%、2.8%、0.9%,技术进步对海洋三次产业TFP的提升作用明显。②海洋三次产业TFP增长率变动规律可划分为持续下降期、波动调整期和平稳上升期。三个阶段的海洋经济发展依次受到海洋政策制度、要素驱动作用和产业结构调整的影响。③海洋三次产业TFP增长率及对经济贡献率呈现出显著的部门差异和地区差异。从部门看,海洋三次产业TFP增长率对海洋经济增长的贡献率分别为10.3%、24.8%和6.1%,海洋第二产业对投入要素依赖较小。从整个沿海11省市来看,辽宁、河北、山东和海南海洋第一产业TFP增长率及其贡献率较高,辽宁、河北、天津和上海海洋第二产业TFP增长率及其贡献率较高,河北、山东、上海和浙江海洋第三产业TFP增长率及其贡献率较高。④对外开放程度有利于海洋二、三产业经济效率的提升,但对海洋第一产业经济效率的影响不明显,陆域经济水平、区位优势对海洋第二产业经济效率产生显著正向作用。
王泽宇 , 张梦雅 , 王焱熙 , 范元兴 . 中国海洋三次产业经济效率时空演变及影响因素分析[J]. 经济地理, 2020 , 40(11) : 121 -130 . DOI: 10.15957/j.cnki.jjdl.2020.11.014
Based on the panel data of 11 coastal provinces and cities in China from 2006 to 2016,this study measures the changes of economic efficiency and total factor productivity of China's marine three industries using the Super-SBM model and the Malmquist index decomposition method,and analyzes its influencing factors applying the panel Tobit regression model. The results show that: 1) Most of the static efficiency values of marine three industries in 11 coastal provinces and cities in China are lower than 1 with efficiency deficiency and low-level pure technical efficiency,and it is relatively insufficient in the scale of marine three industries. During the study period,the average annual growth rate of TFP in China's marine three industries was 1.4%,2.8% and 0.9% respectively,the technological progress plays an important role in the promotion of TFP. 2) The variation law of TFP growth rate of marine three industries can be divided into three stages: continuous decline period,fluctuating adjustment period and stable rise period. The development of marine economy in the three stages is influenced by the marine policy system,the driving role of factors and the adjustment of industrial structure. 3) TFP growth rate and economic contribution rate of the three marine industries show significant sectoral and regional differences. In terms of sectors,the contribution of TFP growth rate of marine three industries to marine economic growth is 10.3%,24.8% and 6.1% respectively,and the secondary industry of marine industry is less dependent on input factors. From the whole coastal area,Liaoning,Hebei,Shandong and Hainan have higher growth rate and contribution rate of marine primary industry TFP,Liaoning,Hebei,Tianjin and Shanghai have higher growth rate and contribution rate of marine secondary industry TFP,and Hebei,Shandong,Shanghai and Zhejiang have higher growth rate and contribution rate of marine tertiary industry TFP. 4) The degree of opening to the outside world is conducive to the improvement of the economic efficiency of the marine secondary and tertiary industries,but the impact on the economic efficiency of the marine primary industry is not obvious. The economic level and location advantages of the land area have a significant positive effect on the economic efficiency of the marine secondary industry.
表1 2006—2016年中国海洋三次产业静态经济效率平均情况Tab.1 Average static economic efficiency of the marine three industries in China in 2006-2016 |
| 地区 | 海洋第一产业 | 海洋第二产业 | 海洋第三产业 | ||||||||
|---|---|---|---|---|---|---|---|---|---|---|---|
| EC 综合效率 | PFC 纯技术效率 | SEC 规模效率 | EC 综合效率 | PEC 纯技术效率 | SEC 规模效率 | EC 综合效率 | PEC 纯技术效率 | SEC 规模效率 | |||
| 天津 | 0.041 | 0.073 | 0.562 | 0.867 | 1.095 | 0.792 | 0.345 | 0.374 | 0.922 | ||
| 河北 | 0.405 | 1.103 | 0.367 | 0.799 | 1.213 | 0.659 | 0.805 | 1.268 | 0.635 | ||
| 辽宁 | 0.823 | 0.874 | 0.942 | 0.440 | 0.488 | 0.902 | 0.276 | 0.284 | 0.970 | ||
| 上海 | 0.027 | 0.027 | 1.000 | 1.344 | 1.921 | 0.700 | 1.521 | 2.305 | 0.660 | ||
| 江苏 | 0.834 | 0.901 | 0.926 | 0.357 | 0.344 | 1.038 | 0.487 | 0.520 | 0.937 | ||
| 浙江 | 1.127 | 1.216 | 0.927 | 0.392 | 0.427 | 0.918 | 0.432 | 0.438 | 0.987 | ||
| 福建 | 0.921 | 1.030 | 0.894 | 0.440 | 0.333 | 1.321 | 0.382 | 0.388 | 0.984 | ||
| 山东 | 1.142 | 1.779 | 0.642 | 0.451 | 0.417 | 1.082 | 0.474 | 0.475 | 0.997 | ||
| 广东 | 0.758 | 1.125 | 0.674 | 0.745 | 0.590 | 1.263 | 0.651 | 1.160 | 0.561 | ||
| 广西 | 0.790 | 1.125 | 0.702 | 0.382 | 1.026 | 0.372 | 0.290 | 1.169 | 0.248 | ||
| 海南 | 1.014 | 1.164 | 0.871 | 0.672 | 2.247 | 0.299 | 0.323 | 0.793 | 0.407 | ||
| 平均 | 0.465 | 0.624 | 0.745 | 0.573 | 0.737 | 0.777 | 0.474 | 0.678 | 0.699 | ||
表2 2006—2016年中国海洋三次产业 Malmquist生产率指数及其分解情况Tab.2 Malmquist productivity index and its decomposition of marine three industries in China in 2006-2016 |
| 时段 | 海洋第一产业 | 海洋第二产业 | 海洋第三产业 | ||||||||
|---|---|---|---|---|---|---|---|---|---|---|---|
| TFP | TC | EC | TFP | TC | EC | TFP | TC | EC | |||
| 2006—2007 | 1.052 | 1.058 | 0.994 | 1.097 | 1.060 | 1.035 | 1.074 | 1.181 | 0.910 | ||
| 2007—2008 | 0.997 | 1.021 | 0.977 | 1.062 | 0.952 | 1.115 | 1.049 | 1.062 | 0.988 | ||
| 2008—2009 | 1.008 | 0.964 | 1.045 | 1.073 | 1.160 | 0.925 | 1.034 | 1.286 | 0.804 | ||
| 2009—2010 | 1.016 | 1.067 | 0.952 | 1.004 | 0.832 | 1.207 | 0.996 | 0.995 | 1.001 | ||
| 2010—2011 | 1.031 | 1.062 | 0.970 | 1.101 | 1.036 | 1.063 | 1.023 | 1.093 | 0.936 | ||
| 2011—2012 | 1.006 | 1.029 | 0.978 | 0.941 | 0.907 | 1.038 | 0.983 | 1.067 | 0.921 | ||
| 2012—2013 | 1.008 | 1.030 | 0.979 | 0.989 | 1.023 | 0.966 | 0.976 | 1.047 | 0.932 | ||
| 2013—2014 | 1.003 | 1.055 | 0.951 | 0.985 | 1.010 | 0.975 | 0.974 | 1.088 | 0.895 | ||
| 2014—2015 | 0.988 | 1.004 | 0.984 | 0.977 | 1.007 | 0.971 | 0.967 | 1.016 | 0.952 | ||
| 2015—2016 | 1.032 | 1.027 | 1.005 | 1.065 | 1.261 | 0.845 | 1.016 | 1.043 | 0.974 | ||
| 平均值 | 1.014 | 1.031 | 0.983 | 1.028 | 1.018 | 1.009 | 1.009 | 1.085 | 0.930 | ||
注:TFP表示全要素生产率指数变化,TC表示技术进步变化,EC表示技术效率变化。 |
表3 2006—2016年海洋三次产业纯技术效率与规模效率变动Tab.3 Changes in pure technical efficiency and scale efficiency of marine three industries in 2006-2016 |
| 时段 | 海洋第一产业 | 海洋第二产业 | 海洋第三产业 | |||||
|---|---|---|---|---|---|---|---|---|
| PEC | SEC | PEC | SEC | PEC | SEC | |||
| 2006—2007 | 1.277 | 0.778 | 1.011 | 1.024 | 0.922 | 0.987 | ||
| 2007—2008 | 0.985 | 0.991 | 1.064 | 1.048 | 0.981 | 1.007 | ||
| 2008—2009 | 0.765 | 1.367 | 0.923 | 1.002 | 0.848 | 0.948 | ||
| 2009—2010 | 0.956 | 0.996 | 1.139 | 1.059 | 1.016 | 0.986 | ||
| 2010—2011 | 0.972 | 0.998 | 1.014 | 1.048 | 0.955 | 0.979 | ||
| 2011—2012 | 0.988 | 0.990 | 1.064 | 0.976 | 0.985 | 0.936 | ||
| 2012—2013 | 1.001 | 0.978 | 1.024 | 0.944 | 0.953 | 0.979 | ||
| 2013—2014 | 1.006 | 0.945 | 0.986 | 0.989 | 0.944 | 0.948 | ||
| 2014—2015 | 0.996 | 0.988 | 0.977 | 0.993 | 0.954 | 0.998 | ||
| 2015—2016 | 1.007 | 0.998 | 0.905 | 0.933 | 0.974 | 1.000 | ||
| 平均值 | 0.989 | 0.994 | 1.009 | 1.001 | 0.952 | 0.977 | ||
注:PEC表示纯技术效率变化,SEC表示规模效率变化。 |
表4 中国海洋三次产业TFP增长对海洋经济增长贡献率(%)Tab.4 The contribution rate of TFP growth to economic growth of the marine three industries in China (%) |
| 产业 | GOP 增长率 | TC 增长率 | PEC 增长率 | SEC 增长率 | TFP 增长率 | TFP 贡献率 | 要素 贡献率 |
|---|---|---|---|---|---|---|---|
| 第一产业 | 13.6 | 3.1 | -1.1 | -0.6 | 1.4 | 10.3 | 89.7 |
| 第二产业 | 11.3 | 1.8 | 0.9 | 0.1 | 2.8 | 24.8 | 75.2 |
| 第三产业 | 14.7 | 8.5 | -4.8 | -2.3 | 0.9 | 6.1 | 93.9 |
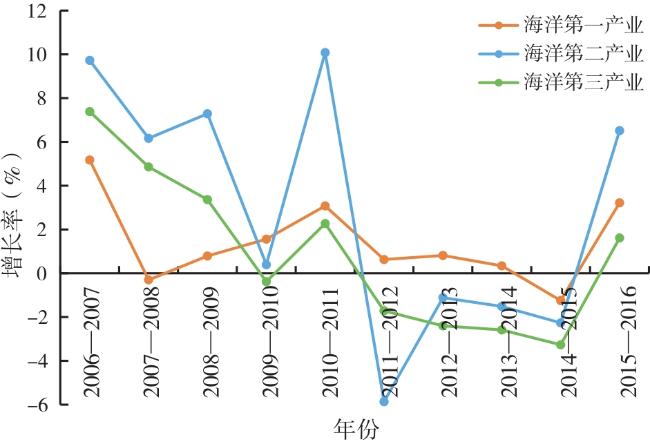
图1 2006—2016年中国海洋三次产业TFP增长率变动Fig.1 Changes in TFP growth rate of marine three industries in China in 2006-2016 |
表5 不同阶段TFP增长率变化与海洋三次产业产出、要素份额变动度Tab.5 Changes in TFP growth rate at different stages and changes in output and factor share of marine three industries |
| 时段 | 产业结构 | EC(%) | TC(%) | TFP(%) | 产出 | 资本 | 劳动力 |
|---|---|---|---|---|---|---|---|
| 2006—2009 | 第一产业 | 0.54 | 1.43 | 1.89 | 0.12 | 0.05 | 0.00 |
| 第二产业 | 2.51 | 5.73 | 7.73 | 0.07 | -0.65 | 0.01 | |
| 第三产业 | -9.96 | 17.60 | 5.20 | -0.20 | 0.60 | 0.00 | |
| 2010—2013 | 第一产业 | -3.02 | 4.70 | 1.52 | -0.13 | 0.09 | 0.00 |
| 第二产业 | 6.86 | -5.06 | 0.88 | -0.18 | -1.25 | 0.00 | |
| 第三产业 | -5.25 | 5.05 | -0.55 | 0.31 | 1.16 | 0.00 | |
| 2014—2016 | 第一产业 | -2.00 | 2.87 | 0.77 | -0.12 | 0.21 | 0.00 |
| 第二产业 | -6.98 | 9.26 | 0.91 | -3.08 | 0.32 | 0.00 | |
| 第三产业 | -5.94 | 4.90 | -1.41 | 3.21 | -0.53 | 0.00 |
注:第i产业平均变动度=(Sit-Si0)/t,S代表产出、劳动力、资本所占总产出、总劳动力、总资本的份额比重;t和0分别代表报告期和基期。 |
表6 2006—2016年中国沿海地区海洋三次产业TFP增长及其贡献率Tab.6 Growth and contribution rate of TFP marine three industries in China's coastal areas in 2006-2016 |
| 地区 | 海洋第一产业 | 海洋第二产业 | 海洋第三产业 | ||||||||
|---|---|---|---|---|---|---|---|---|---|---|---|
| TFP | GOP | 贡献率 | TFP | GOP | 贡献率 | TFP | GOP | 贡献率 | |||
| 天津 | -1.64 | 17.23 | -9.52 | 5.38 | 9.57 | 56.22 | -1.11 | 17.11 | -6.49 | ||
| 河北 | 8.37 | 14.43 | 58.00 | 5.16 | 4.72 | 109.32 | 3.02 | 10.65 | 28.36 | ||
| 辽宁 | 4.86 | 12.72 | 38.21 | 4.25 | 4.95 | 85.86 | -1.53 | 13.00 | -11.77 | ||
| 上海 | -3.74 | 2.68 | -139.55 | 3.19 | 3.53 | 90.37 | 8.04 | 9.29 | 86.54 | ||
| 江苏 | -0.80 | 24.84 | -3.22 | 1.04 | 20.98 | 4.96 | -0.36 | 16.01 | -2.25 | ||
| 浙江 | 0.40 | 14.46 | 2.77 | 4.31 | 12.77 | 33.75 | 0.75 | 14.56 | 5.15 | ||
| 福建 | -1.64 | 13.40 | -12.24 | -1.53 | 15.41 | -9.93 | -1.72 | 18.16 | -9.47 | ||
| 山东 | 5.74 | 9.97 | 57.57 | 3.30 | 12.55 | 26.29 | 4.09 | 15.76 | 25.95 | ||
| 广东 | -2.08 | 5.02 | -41.43 | 3.02 | 15.72 | 19.21 | -0.09 | 14.98 | -0.60 | ||
| 广西 | 0.50 | 16.94 | 2.95 | -1.11 | 13.50 | -8.22 | -2.41 | 17.32 | -13.91 | ||
| 海南 | 6.14 | 17.84 | 34.42 | 4.09 | 10.10 | 40.50 | -2.74 | 15.14 | -18.10 | ||
表7 2006—2016年中国海洋三次产业经济效率影响因素结果Tab.7 Results of influencing factors on economic efficiency of three marine industries in China's coastal areas in 2006-2016 |
| 产业 | 变量 | ||||
|---|---|---|---|---|---|
| dp | op | th | la | Cons_ | |
| 海洋第一产业 | -0.536***(-3.89) | -0.137(-1.61) | 0.167(0.94) | -0.132**(-2.04) | 1.185***(13.23) |
| 海洋第二产业 | 0.033***(3.11) | 0.248***(3.75) | 0.213(1.54) | 0.148***(2.92) | 0.123*(1.76) |
| 海洋第三产业 | -0.009(-0.75) | 0.639***(8.41) | 0.000(0.00) | 0.059(-1.02) | 0.317***(3.97) |
注:***、**、*分别表示回归系数在1%、5%、10%下的显著性水平,括号内为统计量z值。 |
| [1] |
王泽宇, 卢雪凤, 孙才志, 等. 中国海洋经济重心演变及影响因素[J]. 经济地理, 2017, 37(5):12-19.
|
| [2] |
狄乾斌, 於哲, 徐礼祥. 高质量增长背景下海洋经济发展的时空协调模式研究——基于环渤海地区地级市的实证[J]. 地理科学, 2019, 39(10):1621-1 630.
|
| [3] |
王泽宇, 卢函, 孙才志, 等. 中国海洋经济系统稳定性评价与空间分异[J]. 资源科学, 2017, 39(3):566-576.
|
| [4] |
狄乾斌, 韩雨汐. 熵视角下的中国海洋生态系统可持续发展能力分析[J]. 地理科学, 2014, 34(6):664-671.
|
| [5] |
孙才志, 于广华, 王泽宇, 等. 环渤海地区海域承载力测度与时空分异分析[J]. 地理科学, 2014, 34(5):513-521.
|
| [6] |
李博, 田闯, 史钊源, 等. 辽宁沿海地区海洋经济增长质量空间特征及影响要素[J]. 地理科学进展, 2019, 38(7):1080-1 092.
|
| [7] |
|
| [8] |
|
| [9] |
|
| [10] |
Barroscp,
|
| [11] |
|
| [12] |
|
| [13] |
|
| [14] |
|
| [15] |
|
| [16] |
|
| [17] |
|
| [18] |
|
| [19] |
卢昆, 郝平. 基于SFA的中国远洋渔业生产效率分析[J]. 农业技术经济, 2016(9):84-91.
|
| [20] |
程娜. 基于DEA方法的我国海洋第二产业效率研究[J]. 财经问题研究, 2012(6):28-34.
|
| [21] |
于谨凯, 潘菁. 基于超效率DEA-Malmquist模型的我国海洋交通运输业效率分析[J]. 海洋经济, 2015, 5(5):3-12.
|
| [22] |
李淑娟, 周珊. 滨海城市旅游发展效率时空分异与驱动因素研究——以山东半岛蓝色经济区为例[J]. 中国海洋大学学报:社会科学版, 2015(4):8-15.
|
| [23] |
孙康, 季建文, 李丽丹, 等. 基于非期望产出的中国海洋渔业经济效率评价与时空分异[J]. 资源科学, 2017, 39(11):2040-2 051.
|
| [24] |
王洪清. 不同管控模式对港口空间结构和交易效率的影响比较——以中国沿海港口群为例[J]. 经济地理, 2019, 39(1):104-112.
|
| [25] |
范斐, 孙才志, 张耀光. 环渤海经济圈沿海城市海洋经济效率的实证研究[J]. 统计与决策, 2011(6):119-123.
|
| [26] |
杜军, 鄢波, 冯瑞敏. 我国沿海省份海洋经济效率评价研究[J]. 农业技术经济, 2016(6):47-55.
|
| [27] |
邹玮, 孙才志, 覃雄合. 基于Bootstrap-DEA模型环渤海地区海洋经济效率空间演化与影响因素分析[J]. 地理科学, 2017, 37(6):859-867.
|
| [28] |
盖美, 朱静敏, 孙才志, 等. 中国沿海地区海洋经济效率时空演化及影响因素分析[J]. 资源科学, 2018, 40(10):1966-1 979.
|
| [29] |
盖美, 刘丹丹, 曲本亮. 中国沿海地区绿色海洋经济效率时空差异及影响因素分析[J]. 生态经济, 2016, 32(12):97-103.
|
| [30] |
胡伟, 韩增林, 葛岳静, 等. 基于能值的中国海洋生态经济系统发展效率[J]. 经济地理, 2018, 38(8):162-171.
|
| [31] |
赵林, 张宇硕, 吴迪, 等. 考虑非期望产出的中国省际海洋经济效率测度及时空特征[J]. 地理科学, 2016, 36(5):671-680.
|
| [32] |
狄乾斌, 梁倩颖. 中国海洋生态效率时空分异及其与海洋产业结构响应关系识别[J]. 地理科学, 2018, 38(10):1606-1 615.
|
| [33] |
戴彬, 金刚, 韩明芳. 中国沿海地区海洋科技全要素生产率时空格局演变及影响因素[J]. 地理研究, 2015, 34(2):328-340.
|
| [34] |
李汝资, 刘耀彬, 谢德金. 中国产业结构变迁中的经济效率演进及影响因素[J]. 地理学报, 2017, 72(12):2179-2 198.
|
| [35] |
|
| [36] |
|
| [37] |
国家海洋局. 中国海洋统计年鉴[M]. 北京: 海洋出版社, 2007—2017.
|
| [38] |
国家统计局. 中国统计年鉴[M]. 北京: 中国统计出版社, 2007—2017.
|
/
| 〈 |
|
〉 |