
土地要素投入对城市经济增长空间溢出效应
|
杨喜(1990—),男,安徽马鞍山人,博士,讲师。主要研究方向为城市土地利用与国土空间治理。E-mail:956707424@qq.com。 |
收稿日期: 2019-12-05
修回日期: 2020-06-19
网络出版日期: 2025-04-21
基金资助
国家自然科学基金青年项目(41901256)
国家自然科学基金面上项目(71673096)
Spatial Spillover Effect of Land Element Input on Urban Economic Growth in China
Received date: 2019-12-05
Revised date: 2020-06-19
Online published: 2025-04-21
杨喜 , 卢新海 , 沈纬辰 . 土地要素投入对城市经济增长空间溢出效应[J]. 经济地理, 2020 , 40(10) : 83 -90 . DOI: 10.15957/j.cnki.jjdl.2020.10.010
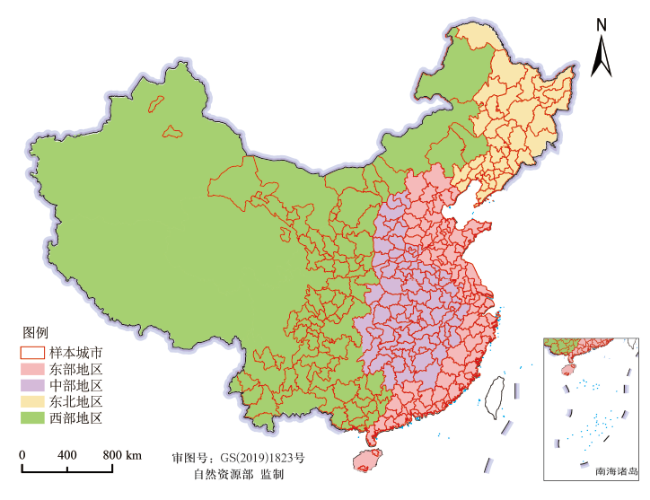
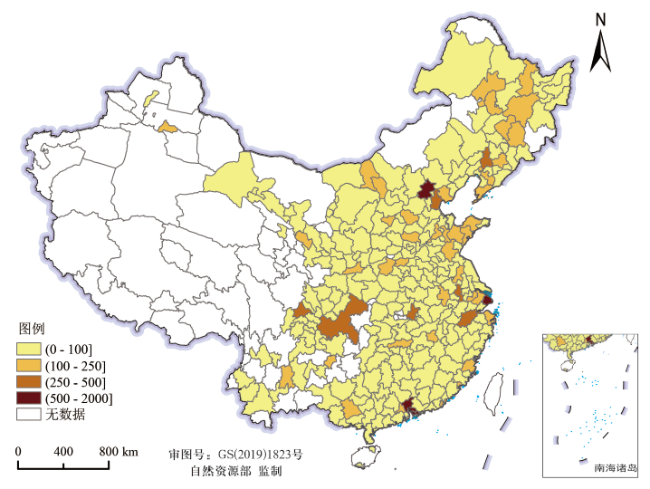
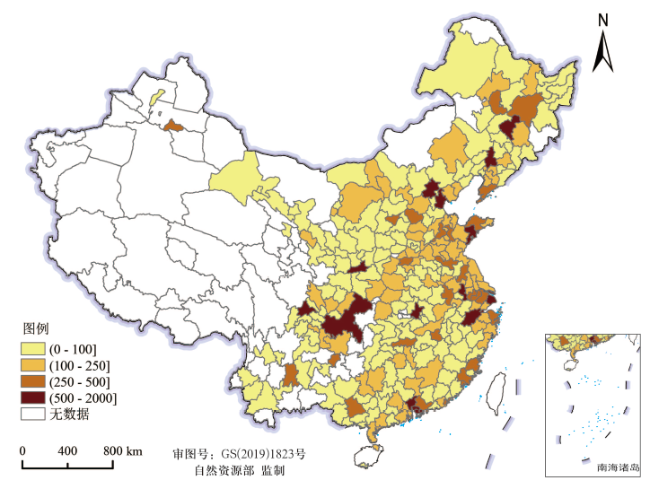
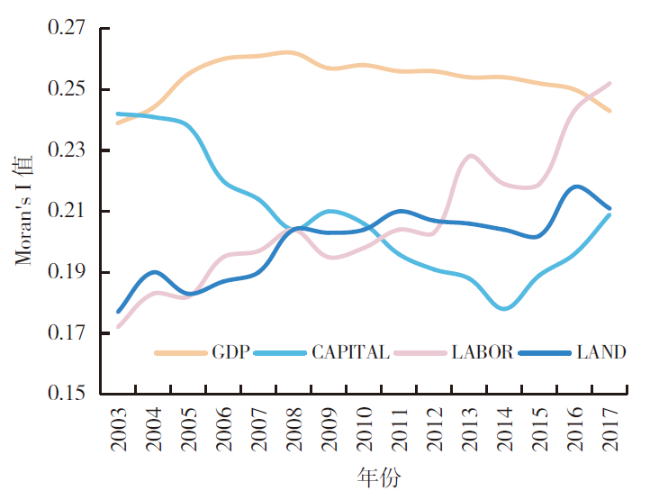
Based on the panel data of 283 prefecture-level cities and above in China from 2003 to 2017,a three-element C-D production function economic growth model was constructed,spatial autocorrelation and spatial panel Dubin models were used to analyze the spatial spillover effect of land element input on the urban economic growth of the national and four major economic plates. The results indicated that: 1) China's urban capital,labor,and land input and economic output have a significant positive global spatial correlation. 2) On a national scale,the input of land element can not only promote the economic growth of local cities,but also promote the economic growth of neighboring cities through positive spatial spillover effects. But the spatial spillover effect of land element input is smaller than labor and capital element input. 3) On the four major economic plates,there are regional differences in the spatial spillover effects of land element input on urban economic growth. It has a significant negative spatial spillover effect in the eastern region and a significant positive spatial spillover effect in the western region. However,significant spatial spillover effects have not yet formed in the central and northeast regions. Finally,the input of land element needs to comprehensively consider regional characteristics and spatial spillover effects,implement differentiated land development and utilization and industrial layout policies,and strengthen cooperation and joint development between neighboring cities.
表1 空间计量模型检验Tab.1 Spatial econometric model test |
| 检验指标 | 检验方法 | 统计值 | p-value |
|---|---|---|---|
| LM检验 | LM test no spatial lag | 860.956 | 0.000 |
| LM test no spatial error | 544.107 | 0.000 | |
| Robust LM检验 | Robust LM no test spatial lag | 470.464 | 0.000 |
| Robust LM no test spatial error | 153.616 | 0.000 | |
| Wald检验 | Wald test spatial lag | 122.836 | 0.000 |
| Wald test spatial error | 39.144 | 0.000 | |
| LR检验 | LR test spatial lag | 118.951 | 0.000 |
| LR test lag spatial error | 41.418 | 0.000 | |
| Hausman检验 | Hausman test | 22.345 | 0.000 |
表2 空间面板杜宾模型估计结果Tab.2 Spatial panel dubin model estimation results |
| 变量 | 全国 | 东部 | 中部 | 西部 | 东北 | ||||||||||||||
|---|---|---|---|---|---|---|---|---|---|---|---|---|---|---|---|---|---|---|---|
| 系数 | t-stat | 系数 | t-stat | 系数 | t-stat | 系数 | t-stat | 系数 | t-stat | ||||||||||
| lnK | 0.477*** | 35.723 | 0.640*** | 22.416 | 0.457*** | 21.613 | 0.350*** | 13.232 | 0.485*** | 15.379 | |||||||||
| lnL | 0.399*** | 25.113 | 0.296*** | 10.284 | 0.430*** | 15.491 | 0.587*** | 21.435 | 0.071 | 1.283 | |||||||||
| lnT | 0.270*** | 16.714 | 0.237*** | 9.528 | 0.255*** | 7.899 | 0.206*** | 6.584 | 0.674*** | 13.178 | |||||||||
| W×lnK | -0.203*** | -9.674 | -0.419*** | -10.840 | -0.048 | -1.058 | -0.155*** | -4.165 | 0.224*** | 3.477 | |||||||||
| W×lnL | 0.061*** | 2.329 | 0.072* | 1.730 | -0.005 | -0.106 | 0.240*** | 5.379 | 0.117 | 1.172 | |||||||||
| W×lnT | 0.045* | 1.745 | -0.156*** | -4.377 | -0.038 | -0.667 | 0.225*** | 4.607 | 0.154* | 1.701 | |||||||||
| 0.193*** | 10.516 | 0.406*** | 17.874 | 0.124*** | 3.522 | 0.052* | 1.698 | -0.271*** | -5.254 | ||||||||||
| R2 | 0.931 | 0.936 | 0.919 | 0.925 | 0.925 | ||||||||||||||
| 样本数 | 4 245 | 1 305 | 1 200 | 1 230 | 510 | ||||||||||||||
表3 全国尺度空间效应分解Tab.3 Decomposition of national scale spatial effects |
| 变量 | 直接效应 | 溢出效应 | 总效应 | |||||
|---|---|---|---|---|---|---|---|---|
| 系数 | t-stat | 系数 | t-stat | 系数 | t-stat | |||
| lnK | 0.470*** | 36.035 | -0.131*** | -5.699 | 0.339*** | 14.308 | ||
| lnL | 0.407*** | 25.451 | 0.165*** | 5.614 | 0.572*** | 17.009 | ||
| lnT | 0.274*** | 17.127 | 0.113*** | 3.793 | 0.387*** | 11.221 | ||
表4 四大板块尺度空间效应分解Tab.4 Decomposition of the spatial effect of four major economic plates |
| 区域 | 变量 | 直接效应 | 溢出效应 | 总效应 | ||||||
|---|---|---|---|---|---|---|---|---|---|---|
| 系数 | t-stat | 系数 | t-stat | 系数 | t-stat | |||||
| 东部 | lnK | 0.622*** | 21.888 | -0.248*** | -4.997 | 0.374*** | 6.936 | |||
| lnL | 0.319*** | 10.642 | 0.301*** | 5.050 | 0.620*** | 8.863 | ||||
| lnT | 0.228*** | 8.733 | -0.092* | -1.731 | 0.137** | 2.054 | ||||
| 中部 | lnK | 0.456*** | 21.303 | 0.010 | 0.219 | 0.466*** | 9.339 | |||
| lnL | 0.434*** | 15.591 | 0.053 | 1.070 | 0.486*** | 8.596 | ||||
| lnT | 0.254*** | 7.599 | 0.008 | -0.125 | 0.246*** | 3.360 | ||||
| 西部 | lnK | 0.348*** | 13.225 | -0.150*** | -4.089 | 0.198*** | 4.445 | |||
| lnL | 0.592*** | 21.580 | 0.291*** | 6.630 | 0.883*** | 16.983 | ||||
| lnT | 0.210*** | 6.382 | 0.253*** | 5.003 | 0.462*** | 7.962 | ||||
| 东北 | lnK | 0.476*** | 15.150 | 0.082 | 1.611 | 0.558*** | 11.791 | |||
| lnL | 0.063 | 1.058 | 0.085 | 0.929 | 0.148* | 1.741 | ||||
| lnT | 0.677*** | 12.102 | -0.028 | -0.361 | 0.648*** | 9.365 | ||||
| [1] |
亚当·斯密. 国富论[M]. 北京: 中国华侨出版社, 2019.
|
| [2] |
黄乾. 中国步入人口质量红利时代[J]. 人民论坛, 2019(14):68-69.
|
| [3] |
陆铭. 中国经济的症结是空间错配[J]. 深圳大学学报:人文社会科学版, 2019, 36(1):77-85.
|
| [4] |
毛振强, 左玉强. 土地投入对中国二三产业发展贡献的定量研究[J]. 中国土地科学, 2007(3):59-63.
|
| [5] |
李效顺, 蒋冬梅, 曲福田, 等. 边际土地利用与经济增长关系计量研究[J]. 中国人口·资源与环境, 2009, 19(3):92-95.
|
| [6] |
杨志荣, 靳相木. 基于面板数据的土地投入对经济增长的影响——以浙江省为例[J]. 长江流域资源与环境, 2009, 18(5):409-415.
|
| [7] |
徐枫, 王占岐. 中部6省土地要素投入对城市经济增长效率影响研究[J]. 中国土地科学, 2015, 29(10):4-11.
|
| [8] |
张俊峰, 张安录. 基于要素贡献率的建设用地差别化管理——以武汉城市圈为例[J]. 经济地理, 2015, 35(10):171-178,193.
|
| [9] |
李明月, 张志鸿, 胡竹枝. 土地要素对经济增长的贡献研究——基于土地资源与土地资产双重属性的视角[J]. 城市发展研究, 2018, 25(7):61-67.
|
| [10] |
王志锋, 朱中华, 黄志基. 土地政策的偏向性对我国区域间经济差距的影响研究[J]. 经济纵横, 2020(1):74-83.
|
| [11] |
|
| [12] |
叶剑平, 马长发, 张庆红. 土地要素对中国经济增长贡献分析——基于空间面板模型[J]. 财贸经济, 2011(4):111-116,124.
|
| [13] |
李鑫, 张瑞平, 欧名豪, 等. 建设用地二三产业增长贡献及空间相关性研究[J]. 中国人口·资源与环境, 2011, 21(9):64-68.
|
| [14] |
谭术魁, 饶映雪, 朱祥波. 土地投入对中国经济增长的影响[J]. 中国人口·资源与环境, 2012, 22(9):61-67.
|
| [15] |
王建康, 谷国锋. 土地要素对中国城市经济增长的贡献分析[J]. 中国人口·资源与环境, 2015, 25(8):10-17.
|
| [16] |
|
| [17] |
邹琳, 曾刚, 曹贤忠. 基于ESDA的长三角城市群研发投入空间分异特征及时空演化[J]. 经济地理, 2015, 35(3):73-79.
|
| [18] |
|
| [19] |
夏方舟, 严金明, 徐一丹. 基于随机边界分析的土地要素对中国经济技术效率影响研究[J]. 中国土地科学, 2014, 28(7):4-10.
|
| [20] |
张军, 吴桂英, 张吉鹏. 中国省际物质资本存量估算:1952—2000[J]. 经济研究, 2004(10):35-44.
|
| [21] |
|
| [22] |
伍骏骞, 方师乐, 李谷成, 等. 中国农业机械化发展水平对粮食产量的空间溢出效应分析[J]. 中国农村经济, 2017(6):44-57.
|
| [23] |
郭庆旺, 赵旭杰. 地方政府投资竞争与经济周期波动[J]. 世界经济, 2012, 35(5):3-21.
|
| [24] |
陆铭, 张航, 梁文泉. 偏向中西部的土地供应如何推升了东部的工资[J]. 中国社会科学, 2015(5):59-83,204-205.
|
| [25] |
彭连清. 关于中部地区经济增长溢出效应的实证分析[J]. 经济经纬, 2008(1):63-66.
|
| [26] |
陆铭, 李鹏飞, 钟辉勇. 发展与平衡的新时代——新中国70年的空间政治经济学[J]. 管理世界, 2019, 35(10):11-23,63,219.
|
| [27] |
和军. 东北经济的结构、体制关键障碍与突破路径[J]. 当代经济研究, 2019(8):96-106.
|
/
| 〈 |
|
〉 |