
中国区域经济差异与收敛的时空演进特征
|
董雪兵(1974—),男,浙江安吉人,博士,教授。主要研究方向为区域经济学、发展经济学与法律经济学。E-mail:dxb@zju.edu.cn。 |
收稿日期: 2019-09-09
修回日期: 2020-07-07
网络出版日期: 2025-04-21
基金资助
浙江省自然科学基金项目(LY18G030010)
Characteristics of the Temporal and Spatial Pattern of the Economic Disparity and Convergence Between Different Regions in China
Received date: 2019-09-09
Revised date: 2020-07-07
Online published: 2025-04-21
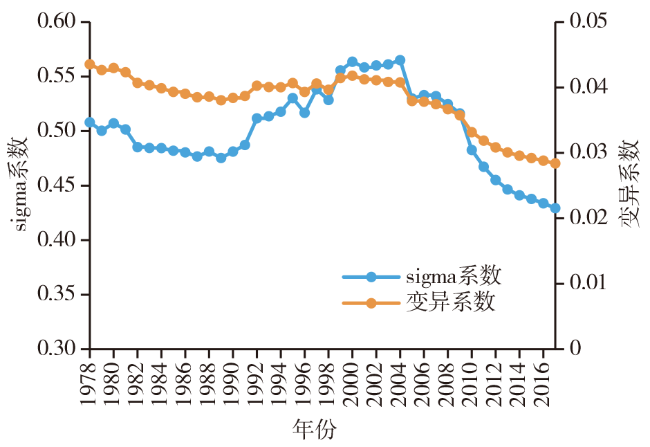
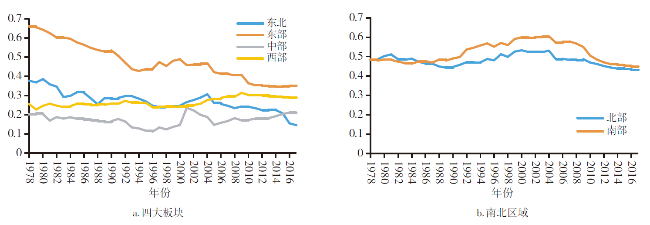
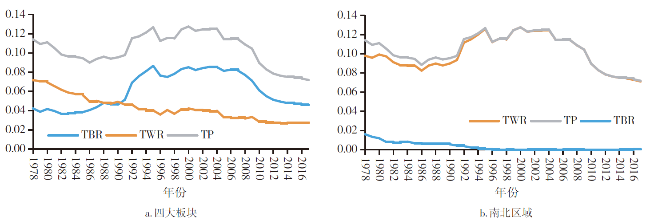
文章利用1978—2017年各省人均实际GDP数据,分别采用空间横截面数据模型和空间动态面板数据模型,从时间和空间两个维度分析中国经济收敛性特征。研究发现,改革开放40年,中国全域经济经历了“收敛—发散—收敛”的过程;中国经济区域收敛特征随时间推移而变化:四大板块间经历了“俱乐部收敛”“俱乐部收敛”不显著到“四大板块内部分化”的过程,南北区域间经历了不存在“俱乐部收敛”“俱乐部收敛”到“南方经济分化,北方经济收敛”的过程。这意味着我国四大板块间差距逐渐缩小,南北区域间差距逐渐扩大。进一步从创新要素视角讨论南北差距逐渐扩大的原因,认为可能是创新能力差距、人力资本流向、营商环境等因素影响了南北方区域创新能力,从而造成南北区域经济差距扩大。
董雪兵 , 池若楠 . 中国区域经济差异与收敛的时空演进特征[J]. 经济地理, 2020 , 40(10) : 11 -21 . DOI: 10.15957/j.cnki.jjdl.2020.10.002
Based on the spatial cross-sectional data model and spatial dynamic panel data model,this paper analyzes the characteristics of China's economic convergence from two perspectives of time and space exploiting real GDP per capita data of each province in China from 1978 to 2017 and. The study found that during the 40 years of reform and opening-up,China's global economy has experienced a "convergence-divergence-convergence" process. The regional convergence characteristics of the Chinese economy have changed over time. The four major sectors have gone through three stages: 1) the "club convergence" stage,2) the insignificant "club convergence" stage,and 3) the stage of differentiation within the four major sectors. The North and South regions have developed three phases: 1) the insignificant "club convergence" stage,2) the "club convergence" stage,and 3) the stage of economic differentiation within the southern region and economic convergence northern. These conclusions imply that the gap among the four major sectors has gradually narrowed,while between the north and south regions widened. This article further discusses the reasons for the widening gap between the North and the South from the perspective of innovation factors and believes that factors such as the gap in innovation capacity,the flow direction of human capital,and business environment et al. have affected the innovation capacity of the North and South regions,and widen the economic gap between North and South regions.
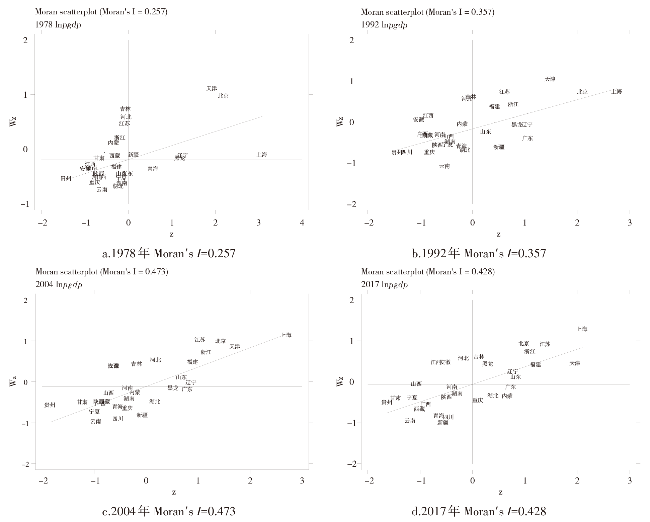
表1 经济空间相关性变化Tab.1 Change on economic spatial correlation |
| 类型 | 期初类型 | 期末类型 | 省份 |
|---|---|---|---|
| 类型一:本省经济发展水平提高 | L-H | H-H | 浙江、江苏 |
| L-L | H-H | 山东、福建 | |
| L-L | H-L | 湖北、重庆、广东 | |
| 类型二:本身经济发展水平不足 | H-L | L-L | 青海 |
| 类型三:邻省经济发展水平提高 | L-L | L-H | 安徽、江西、山西 |
| 类型四:邻省经济发展水平不足 | L-H | L-L | 西藏、甘肃、新疆 |
| 类型五:经济空间相关性保持相对稳定 | 内蒙古、吉林、河北、贵州、云南、陕西、河南、湖南、四川、宁夏、广西、黑龙江、辽宁、上海、北京、天津 | ||
表2 经典β收敛空间计量模型的选择Tab.2 Choice on spatial econometric model of classical beta convergence |
| (1) OLS | (2) SAR | (3) SEM | (4) SDM | (5) SEM | |
|---|---|---|---|---|---|
| -0.425***(0.120) | -0.432***(0.112) | -0.544***(0.129) | -0.604***(0.121) | -0.572***(0.148) | |
| 常数 | 8.414***(1.402) | 7.530(1.458) | 9.783***(1.511) | 1.334(2.771) | 10.583***(1.775) |
| 0.274(0.201) | 0.472**(0.191) | ||||
| 0.648**(0.259) | |||||
| (g) | 0.491**(0.205) | 0.305(0.312) | |||
| -0.333(0.339) | |||||
| -0.360(0.255) | |||||
| 样本量 | 30 | 30 | 30 | 30 | 30 |
| Pseudo R2 | 0.301 | 0.277 | 0.309 | 0.355 | 0.441 |
| LM-Lag检验 | 1.531 | ||||
| 稳健LM-lag检验 | 2.854* | ||||
| LM-Error检验 | 5.482*** | ||||
| 稳健LM-Error检验 | 6.805*** | ||||
| 空间项Wald检验 | 1.84 | 5.74** | 9.06** | ||
| 空间项LR检验 | 5.45** | 2.67 | |||
| Wald检验( ) | 3.60 |
表3 空间横截面数据模型:分时段—分区域Tab.3 Spatial cross-section data model:devided by time and reigon |
| 变量 | (1) | (2) | (3) | (4) | (5) | |
|---|---|---|---|---|---|---|
| 1978-2017 | 1978—1990 | 1990—2000 | 2000—2012 | 2012—2017 | ||
| 第1部分: 全域收敛性分析 | -0.544***(0.129) | -0.097(0.061) | -0.043(0.064) | -0.193***(0.053) | -0.054**(0.024) | |
| 常数 | 9.783***(1.512) | 1.998***(0.712) | 1.480*(0.824) | 3.674***(0.716) | 1.156***(0.355) | |
| (g) | 0.491**(0.205) | 0.089(0.242) | 0.768***(0.125) | 0.023(0.240) | 0.550***(0.195) | |
| 样本量 | 30 | 30 | 30 | 30 | 30 | |
| Pseudo R2 | 0.309 | 0.078 | -0.073 | 0.32 | 0.233 | |
| 收敛速度 | 1.96% | 0.78% | 0.40% | 1.65% | 0.93% | |
| 稳态值 | 6.34 | 1.82 | 1.42 | 3.08 | 1.10 | |
| 半收敛周期(年) | 35.31 | 88.31 | 173.48 | 42.02 | 74.92 | |
| 第2部分: 四大板块收敛性分析 | -0.767***(0.102) | -0.241***(0.053) | -0.184***(0.057) | -0.271***(0.094) | -0.056**(0.027) | |
| 0.021*(0.011) | 0.013**(0.005) | 0.029***(0.005) | -0.011(0.007) | 0.004(0.003) | ||
| -0.02(0.013) | -0.008(0.007) | 0.002(0.006) | -0.013*(0.007) | 0.003(0.003) | ||
| -0.037***(0.013) | -0.011*(0.006) | -0.011*(0.006) | -0.022***(0.008) | 0.006**(0.003) | ||
| 常数 | 12.545***(1.242) | 3.697***(0.637) | 3.196***(0.726) | 4.937***(1.281) | 1.130***(0.399) | |
| (g) | -0.325(0.309) | -0.332(0.258) | -0.067(0.316) | -0.578*(0.307) | 0.592***(0.200) | |
| 样本量 | 30 | 30 | 30 | 30 | 30 | |
| Pseudo R2 | 0.654 | 0.463 | 0.745 | 0.339 | 0.342 | |
| 稳态值: | ||||||
| 东部 | 7.18 | 3.01 | 2.77 | 3.85 | 1.07 | |
| 中部 | 7.02 | 2.96 | 2.70 | 3.85 | 1.07 | |
| 西部 | 6.95 | 2.95 | 2.67 | 3.82 | 1.08 | |
| 东北 | 7.10 | 2.98 | 2.70 | 3.88 | 1.07 | |
| 收敛速度: | ||||||
| 东部 | 3.43% | 1.99% | 1.53% | 2.55% | 0.89% | |
| 中部 | 3.87% | 2.20% | 1.83% | 2.57% | 0.91% | |
| 西部 | 4.07% | 2.23% | 1.97% | 2.67% | 0.85% | |
| 东北 | 3.64% | 2.12% | 1.85% | 2.43% | 0.96% | |
| 第3部分: 南北区域收敛性分析 | -0.514***(0.130) | -0.078(0.063) | -0.034(0.061) | -0.192***(0.052) | -0.062***(0.017) | |
| -0.018(0.013) | -0.005(0.005) | -0.013**(0.006) | 0.002(0.004) | -0.004***(0.001) | ||
| 常数 | 9.555***(1.523) | 1.805**(0.730) | 1.454*(0.784) | 3.646***(0.703) | 1.307***(0.247) | |
| (g) | 0.487**(0.210) | 0.031(0.255) | 0.766***(0.127) | -0.013(0.258) | -0.048(0.310) | |
| 样本量 | 30 | 30 | 30 | 30 | 30 | |
| Pseudo R2 | 0.363 | 0.109 | 0.087 | 0.323 | 0.514 | |
| 稳态值: | ||||||
| 北部 | 6.237 | 1.667 | 1.389 | 3.064 | 1.226 | |
| 南部 | 6.311 | 1.674 | 1.406 | 3.059 | 1.231 | |
| 收敛速度: | ||||||
| 北部 | 1.90% | 0.67% | 0.44% | 1.62% | 1.14% | |
| 南部 | 1.80% | 0.62% | 0.31% | 1.64% | 1.07% |
表4 空间动态面板数据模型Tab.4 Spatial dynamic panel data model |
| (1) | (2) | (3) | (4) | (5) | (6) | |
|---|---|---|---|---|---|---|
| 78~17 | 78~17(均值) | 78~14(间隔) | 79~15(间隔) | 80~16(间隔) | 81~17(间隔) | |
| 0.976***(0.008) | 0.967***(0.029) | 0.905***(0.036) | 0.978***(0.034) | 0.926***(0.035) | 0.932***(0.035) | |
| -0.105**(0.041) | -0.176**(0.079) | -0.129(0.083) | -0.180**(0.080) | -0.118(0.085) | -0.179**(0.084) | |
| 0.057***(0.010) | 0.271***(0.037) | 0.307***(0.051) | 0.275***(0.043) | 0.222***(0.037) | 0.177***(0.033) | |
| -0.006(0.021) | 0.083(0.135) | -0.001(0.059) | -1.247***(0.471) | -0.290(0.313) | 0.052(0.077) | |
| 0.107***(0.041) | 0.220***(0.075) | 0.218***(0.077) | 0.225***(0.074) | 0.146*(0.081) | 0.205***(0.079) | |
| 样本量 | 1 170 | 270 | 270 | 270 | 270 | 270 |
| 收敛速度(%) | 2.43 | 0.84 | 2.50 | 0.56 | 1.92 | 1.76 |
| 0.00 | 0.67 | 1.55 | 0.57 | 0.10 | 0.05 | |
| R-squared | 0.998 | 0.99 | 0.987 | 0.987 | 0.988 | 0.987 |
表5 空间动态面板模型:分时段—分区域Tab.5 Spatial dynamic panel data model:divided by time and region |
| (1) 1978—2017 | (2) 1978—1990 | (3) 1990—2000 | (4) 2000—2012 | (5) 2012—2017 | ||
|---|---|---|---|---|---|---|
| 第1部分: 全域收敛性分析 | 0.979***(0.009) | 0.965***(0.032) | 0.730***(0.044) | 1.106***(0.026) | 0.994***(0.052) | |
| -0.104**(0.042) | -0.046(0.088) | -0.096(0.086) | -0.066(0.084) | 0.320**(0.146) | ||
| 0.060***(0.010) | -0.057(0.063) | 0.055(0.040) | 0.028(0.018) | 0.014(0.009) | ||
| -0.006(0.021) | 0.058(0.087) | -0.135(0.126) | -0.489**(0.202) | -0.001(0.006) | ||
| 0.108***(0.041) | 0.060(0.081) | 0.158*(0.086) | 0.126(0.077) | -0.294**(0.142) | ||
| 样本量 | 1 140 | 330 | 300 | 360 | 150 | |
| R-squared | 0.998 | 0.992 | 0.990 | 0.996 | 0.999 | |
| 第2部分: 四大板块收敛性分析 | 0.997***(0.011) | 1.026***(0.041) | 0.670***(0.066) | 1.119***(0.033) | 1.307***(0.071) | |
| -0.079*(0.042) | -0.080(0.090) | -0.240**(0.098) | -0.249***(0.088) | 0.587***(0.150) | ||
| 0.046***(0.012) | -0.046(0.062) | 0.070*(0.039) | 0.020(0.018) | 0.008(0.009) | ||
| 0.016(0.021) | 0.066(0.087) | -0.217*(0.127) | -0.328(0.201) | 0.013*(0.007) | ||
| -0.012***(0.005) | -0.076***(0.026) | 0.039(0.049) | -0.116***(0.023) | -0.206***(0.044) | ||
| -0.005(0.005) | -0.091***(0.028) | 0.015(0.047) | -0.072***(0.019) | -0.284***(0.049) | ||
| -0.002(0.004) | -0.095***(0.026) | -0.057(0.040) | -0.072***(0.018) | -0.308***(0.046) | ||
| 0.102**(0.041) | 0.034(0.082) | 0.102(0.089) | 0.101(0.079) | -0.209(0.144) | ||
| 样本量 | 1 140 | 330 | 300 | 360 | 150 | |
| R-squared | 0.994 | 0.786 | 0.717 | 0.463 | 0.495 | |
| 第3部分: 南北区域收敛性分析 | 0.978***(0.009) | 0.964***(0.033) | 0.724***(0.043) | 1.157***(0.027) | 1.004***(0.051) | |
| -0.105**(0.042) | -0.047(0.089) | -0.103(0.086) | 0.112(0.086) | 0.184(0.146) | ||
| 0.061***(0.010) | -0.058(0.063) | 0.060(0.040) | 0.028(0.018) | 0.013(0.009) | ||
| -0.006(0.021) | 0.057(0.087) | -0.133(0.125) | 0.080(0.201) | 0.004(0.006) | ||
| -0.002(0.002) | -0.004(0.014) | -0.029(0.021) | -0.054***(0.010) | -0.068***(0.023) | ||
| 0.107***(0.041) | 0.061(0.081) | 0.152*(0.086) | 0.089(0.078) | -0.413***(0.144) | ||
| 样本量 | 1 140 | 330 | 300 | 360 | 150 | |
| R-squared | 0.998 | 0.989 | 0.797 | 0.802 | 0.515 |
| [1] |
|
| [2] |
|
| [3] |
|
| [4] |
朱国忠, 乔坤元, 虞吉海. 中国各省经济增长是否收敛[J]. 经济学(季刊), 2014, 13(3):1171-1 194.
|
| [5] |
魏后凯. 中国地区经济增长及其收敛性[J]. 中国工业经济, 1997(3):31-37.
|
| [6] |
刘强. 中国经济增长的收敛性分析[J]. 经济研究, 2001(6):70-77.
|
| [7] |
张胜, 郭军, 陈金贤. 中国省际长期经济增长绝对收敛的经验分析[J]. 世界经济, 2001(6):67-70.
|
| [8] |
林光平, 龙志和, 吴梅. 我国地区经济收敛的空间计量实证分析:1978—2002年[J]. 经济学(季刊), 2005,4(s1):71-86.
|
| [9] |
沈坤荣, 唐文健. 大规模劳动力转移条件下的经济收敛性分析[J]. 中国社会科学, 2006(5):46-57.
|
| [10] |
傅晓霞, 吴利学. 技术效率、资本深化与地区差异——基于随机前沿模型的中国地区收敛分析[J]. 经济研究, 2006(10):52-61.
|
| [11] |
潘文卿. 中国区域经济差异与收敛[J]. 中国社会科学, 2010(1):72-84.
|
| [12] |
史修松, 赵曙东. 中国经济增长的地区差异及其收敛机制(1978—2009年)[J]. 数量经济技术经济研究, 2011(1):51-62.
|
| [13] |
覃成林, 刘迎霞, 李超. 空间外溢与区域经济增长趋同——基于长江三角洲的案例分析[J]. 中国社会科学, 2012(5):76-94.
|
| [14] |
盛来运, 郑鑫, 周平, 等. 我国经济发展南北差距扩大的原因分析[J]. 管理世界, 2018, 34(9):22-30.
|
| [15] |
江孝君, 杨青山, 张郁, 等. 中国经济社会协调发展水平空间分异特征[J]. 经济地理, 2017, 37(8):17-26.
|
| [16] |
樊新生, 闫妍, 罗庆. 基于相对优势的中国城市产业转型及区域差异[J]. 经济地理, 2019, 39(10):87-93.
|
| [17] |
周敏, 匡兵, 陶雪飞. 空间收敛视角下中国城市土地开发强度演变特征[J]. 经济地理, 2018, 38(11):98-122.
|
| [18] |
滕建州, 梁琪. 中国区域经济增长收敛吗?——基于时序列的随机收敛和收敛研究[J]. 管理世界, 2006(12):32-41.
|
| [19] |
周亚虹, 朱保华, 刘俐含. 中国经济收敛速度的估计[J]. 经济研究, 2009(6):40-51.
|
| [20] |
沈坤荣, 马俊. 中国经济增长的“俱乐部收敛”特征及其成因研究[J]. 经济研究, 2002(1):33-39.
|
| [21] |
王志刚. 质疑中国经济增长的条件收敛性[J]. 管理世界, 2004(3):25-30.
|
| [22] |
|
| [23] |
王赟赟, 陈宪. 高铁通勤成本对地区收入差距的影响研究——基于城市群集聚效应的分析[J]. 价格理论与实践, 2018(9):95-98.
|
| [24] |
山川网. 中国城市高新技术企业数量排名:长三角、珠三角城市群成绩亮眼[EB/OL]. http://www.sohu.com/a/278528964_99964340,2018-11-29.
|
| [25] |
夏后学, 谭清美, 白俊红. 营商环境、企业寻租与市场创新——来自中国企业营商环境调查的经验证据[J]. 经济研究, 2019(4):84-98.
|
/
| 〈 |
|
〉 |