
长江经济带三大城市群经济差异演变及影响因素——基于多源灯光数据的比较研究
|
晁静(1993—),女,陕西扶风人,博士研究生。主要研究方向为经济地理与区域规划。E-mail:cherubj25@hotmail.com。 |
收稿日期: 2018-11-15
修回日期: 2019-01-23
网络出版日期: 2025-04-20
基金资助
国家自然科学基金项目(41771129)
国家自然科学基金项目(41401184)
教育部人文社会科学研究项目(14YJCZH222)
陕西省软科学研究计划(2019KRM071)
陕西省重点实验室开放基金(SKLESS201806)
Spatial-Temporal Evolution and Influencing Factors of Economic Disparities Among Three Urban Agglomerations in the Yangtze River Economic Belt: A Comparative Study Based on Multisource Nighttime Light Data
Received date: 2018-11-15
Revised date: 2019-01-23
Online published: 2025-04-20
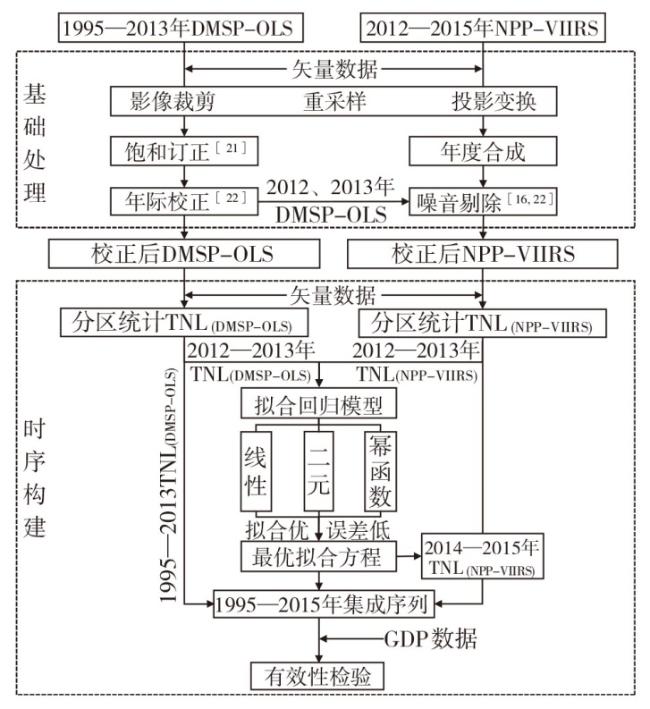
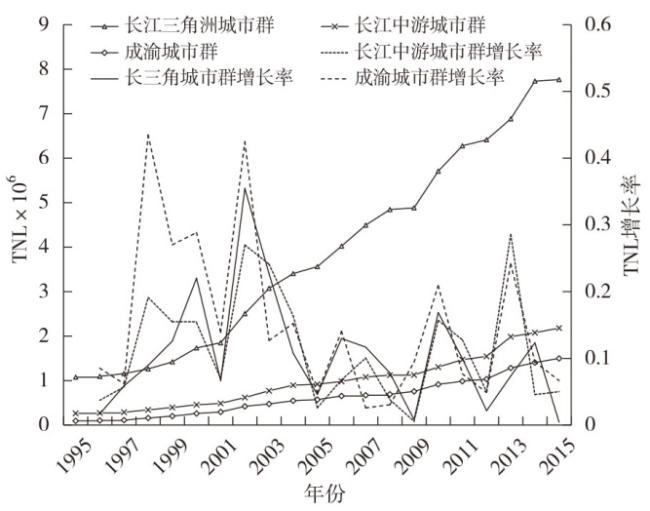
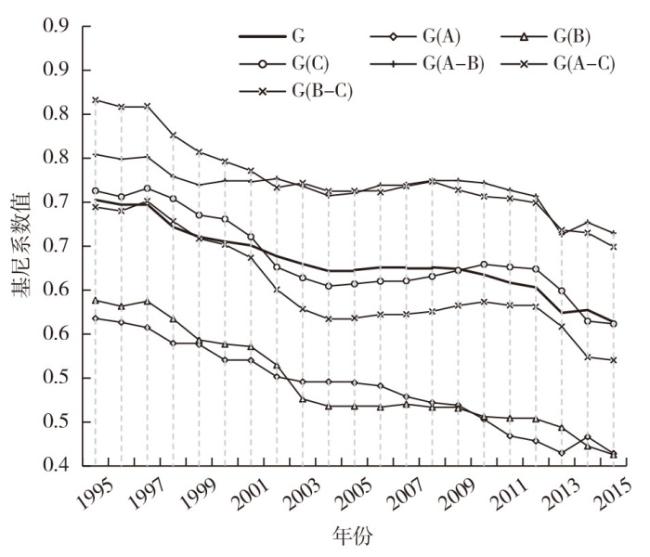
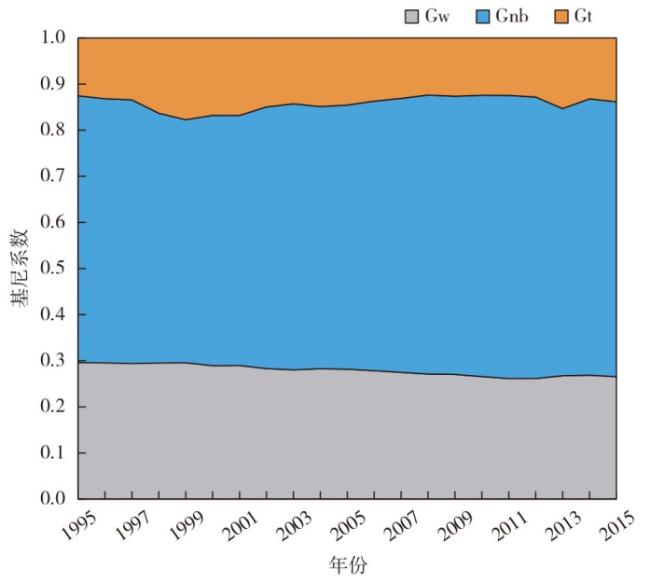
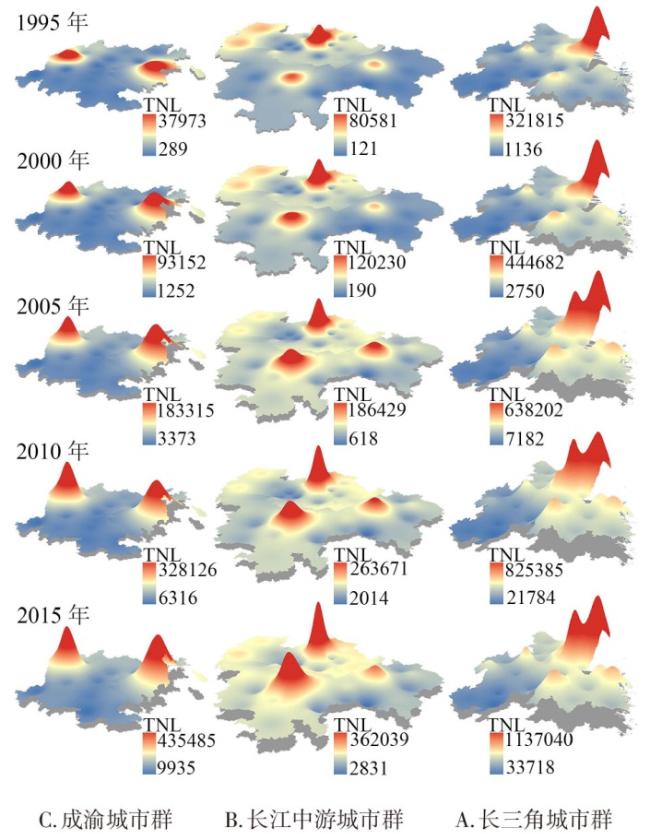
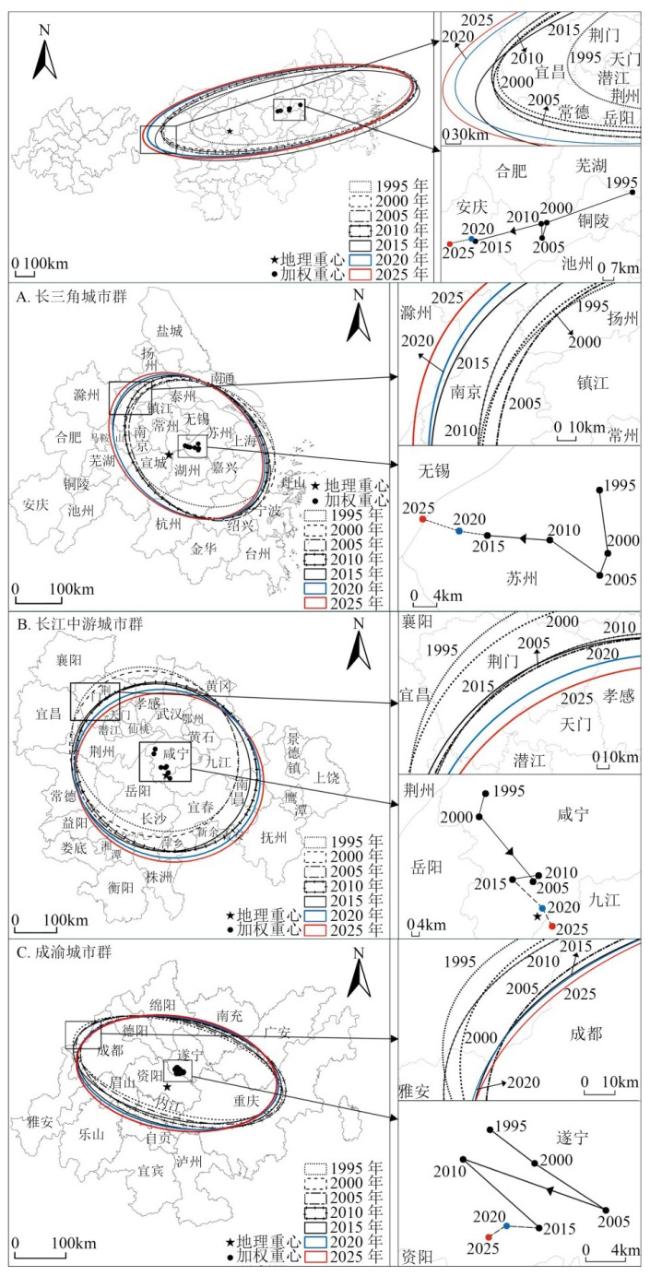
基于DMSP-OLS和NPP-VIIRS夜间灯光数据构建夜间灯光总量集成序列,采用Dagum基尼系数、标准差椭圆、重心转移模型及地理探测器等定量方法,系统比较1995—2015年长江经济带三大城市群经济差异时空演变及影响因素。结果表明:①三大城市群经济规模呈东中西梯度递减特征,经济增速呈西中东梯度递减特征。总体差异、群内差异及群间差异均逐年缩小,群间差异为总体差异的主要来源。②三大城市群经济空间结构均存在“路径依赖”现象,在期初的基础上不断强化。经济空间分布均呈西北—东南走向,但呈现出不同的离散趋势。③政府投资、市场水平及对外开放是推动三大城市群之间及各城市群内部经济差异的核心因素,人口规模、医疗水平、文教水平及交通水平等因子的作用随城市群区域及阶段的变化而有所差异。
晁静 , 赵新正 , 李同昇 , 青雨馨 . 长江经济带三大城市群经济差异演变及影响因素——基于多源灯光数据的比较研究[J]. 经济地理, 2019 , 39(5) : 92 -100 . DOI: 10.15957/j.cnki.jjdl.2019.05.011
Based on the DMSP-OLS and NPP-VIIRS nighttime light data, this study develops a time series of total nighttime light (TNL) from 1995 to 2015 and multidimensionally analyzes the spatial-temporal evolution and influencing factors of economic disparities among three urban agglomerations in the Yangtze River Economic Belt applying the method of Dagum Gini coefficient, standard deviational ellipse, gravity-center model and geographical detector model. Results indicate that: 1) TNL of three urban agglomerations appears a gradient descent from east to west, while the growth rate of TNL presents a gradient decline from west to east. Overall disparity among the three urban agglomerations is downgrade year by year, as well as discrepancies between and within urban agglomerations. Differentia between urban agglomerations is mainspring of the overall disparity. 2) Path dependence phenomenon exists in the spatial structure evolution of each urban agglomeration, which is constantly strengthened on the basis of the early stage. 3) Government investment, market situation and openness are the core factors influencing economic differentiation of the three urban agglomerations. The effects of population scale, medical level, educational level and traffic level differ with the changes of regions and development stages of urban agglomerations. Results can provide a scientific basis for the optimization of economic spatial distribution in each urban agglomeration and promoting the coordinated development of the three urban agglomerations.
表1 主要探测因子Tab.1 The main detection factors |
| 变量 | 解释变量 | 变量类型 |
|---|---|---|
| X1人口规模 | 年末总人口数(万人) | 连续变量 |
| X2经济水平 | 人均GDP(元) | 连续变量 |
| X3产业结构 | 二三产占比(%) | 连续变量 |
| X4医疗水平 | 每万人拥有床位数(个) | 连续变量 |
| X5文教水平 | 每万人拥有专任教师数(人) | 连续变量 |
| X6投资水平 | 固定资产投资(万元) | 连续变量 |
| X7市场水平 | 社会零售品消费额(万元) | 连续变量 |
| X8开放程度 | 外商直接投资(万美元) | 连续变量 |
| X9交通水平 | 年末总客运量(万人) | 连续变量 |
| X10区位条件 | 是否沿长江干流或沿海(是=1,否=0) | 虚拟变量 |
表2 影响因子探测结果Tab.2 Detected results of influence factors |
| 年份 | 三大城市群 | 长三角城市群 | 长江中游城市群 | 成渝城市群 | |||||||||||||||||||
|---|---|---|---|---|---|---|---|---|---|---|---|---|---|---|---|---|---|---|---|---|---|---|---|
| 1995 | 2000 | 2005 | 2010 | 2015 | 1995 | 2000 | 2005 | 2010 | 2015 | 1995 | 2000 | 2005 | 2010 | 2015 | 1995 | 2000 | 2005 | 2010 | 2015 | ||||
| X1 | 0.294 | 0.236 | 0.548 | 0.297 | 0.326 | 0.865 | 0.894 | 0.678 | 0.639 | 0.722 | 0.157 | 0.237 | 0.281 | 0.276 | 0.371 | 0.438 | 0.991 | 0.986 | 0.985 | 0.985 | |||
| X2 | 0.576 | 0.571 | 0.730 | 0.499 | 0.585 | 0.522 | 0.521 | 0.683 | 0.450 | 0.446 | 0.397 | 0.584 | 0.780 | 0.517 | 0.397 | 0.998 | 0.996 | 0.982 | 0.984 | 0.979 | |||
| X3 | 0.221 | 0.270 | 0.399 | 0.438 | 0.345 | 0.298 | 0.355 | 0.673 | 0.447 | 0.553 | 0.180 | 0.193 | 0.420 | 0.228 | 0.209 | 0.414 | 0.988 | 0.981 | 0.983 | 0.973 | |||
| X4 | 0.195 | 0.231 | 0.262 | 0.213 | 0.266 | 0.243 | 0.198 | 0.269 | 0.192 | 0.252 | 0.365 | 0.592 | 0.463 | 0.788 | 0.846 | 0.991 | 0.445 | 0.985 | 0.980 | 0.972 | |||
| X5 | 0.062 | 0.030 | 0.224 | 0.250 | 0.443 | 0.187 | 0.334 | 0.242 | 0.162 | 0.203 | 0.287 | 0.811 | 0.607 | 0.589 | 0.721 | 0.973 | 0.221 | 0.885 | 0.984 | 0.985 | |||
| X6 | 0.628 | 0.716 | 0.762 | 0.705 | 0.720 | 0.963 | 0.968 | 0.902 | 0.612 | 0.609 | 0.887 | 0.853 | 0.879 | 0.844 | 0.864 | 0.989 | 0.992 | 0.984 | 0.997 | 0.975 | |||
| X7 | 0.639 | 0.717 | 0.853 | 0.659 | 0.742 | 0.979 | 0.980 | 0.894 | 0.797 | 0.828 | 0.898 | 0.924 | 0.816 | 0.829 | 0.850 | 0.992 | 0.994 | 0.989 | 0.988 | 0.986 | |||
| X8 | 0.728 | 0.727 | 0.935 | 0.946 | 0.729 | 0.713 | 0.706 | 0.926 | 0.919 | 0.762 | 0.902 | 0.855 | 0.801 | 0.774 | 0.862 | 0.989 | 0.453 | 0.991 | 0.985 | 0.975 | |||
| X9 | 0.137 | 0.188 | 0.379 | 0.617 | 0.550 | 0.112 | 0.139 | 0.327 | 0.251 | 0.598 | 0.214 | 0.446 | 0.366 | 0.274 | 0.246 | 0.989 | 0.989 | 0.980 | 0.980 | 0.972 | |||
| X10 | 0.072 | 0.081 | 0.055 | 0.008 | 0.016 | 0.058 | 0.065 | 0.091 | 0.109 | 0.061 | 0.160 | 0.165 | 0.120 | 0.113 | 0.118 | 0.043 | 0.024 | 0.029 | 0.030 | 0.026 | |||
| [1] |
陆大道. 建设经济带是经济发展布局的最佳选择:长江经济带经济发展的巨大潜力[J]. 地理科学, 2014, 34(7):769-772.
|
| [2] |
方创琳, 周成虎, 王振波. 长江经济带城市群可持续发展战略问题与分级梯度发展重点[J]. 地理科学进展, 2015, 34(11):1398-1408.
|
| [3] |
谈佳洁, 刘士林. 长江经济带三大城市群经济产业比较研究[J]. 山东大学学报:哲学社会科学版, 2018(1):138-146.
|
| [4] |
涂建军, 李琪, 朱月, 等. 基于不同视角的长江经济带经济发展差异研究[J]. 工业技术经济, 2018, 37(3):113-121.
|
| [5] |
王维, 陈云, 王晓伟, 等. 长江经济带区域发展差异时空格局研究[J]. 长江流域资源与环境, 2017, 26(10):1489-1497.
|
| [6] |
曾浩, 余瑞祥, 左桠菲, 等. 长江经济带市域经济格局演变及其影响因素[J]. 经济地理, 2015, 35(5):25-31.
|
| [7] |
白永亮, 郭珊. 长江经济带经济实力的时空差异:沿线城市比较[J]. 改革, 2015(1):99-108.
|
| [8] |
朱道才, 任以胜, 徐慧敏, 等. 长江经济带空间溢出效应时空分异[J]. 经济地理, 2016, 36(6):26-33.
|
| [9] |
冯兴华, 钟业喜, 陈琳, 等. 长江经济带县域经济空间格局演变分析[J]. 经济地理, 2016, 36(6):18-25.
|
| [10] |
张改素, 王发曾, 康珈瑜, 等. 长江经济带县域城乡收入差距的空间格局及其影响因素[J]. 经济地理, 2017, 37(4):42-51.
|
| [11] |
李晶晶, 苗长虹. 长江经济带人口流动对区域经济差异的影响[J]. 地理学报, 2017, 72(2):197-212.
|
| [12] |
孟德友, 李小建, 陆玉麒, 等. 长江三角洲地区城市经济发展水平空间格局演变[J]. 经济地理, 2014, 34(2):50-57.
|
| [13] |
谢磊, 李景保, 袁华斌, 等. 长江中游经济区县域经济差异时空演变[J]. 经济地理, 2014, 34(4):19-24,39.
|
| [14] |
彭颖, 陆玉麒. 成渝经济区经济发展差异的时空演变分析[J]. 经济地理, 2010, 30(6):912-917,943.
|
| [15] |
刘华军, 杜广杰. 中国经济发展的地区差距与随机收敛检验——基于2000—2013年DMSP/OLS夜间灯光数据[J]. 数量经济技术经济研究, 2017, 34(10):43-59.
|
| [16] |
|
| [17] |
|
| [18] |
|
| [19] |
何春阳, 史培军, 李景刚, 等. 基于DMSP/OLS夜间灯光数据和统计数据的中国大陆20世纪90年代城市化空间过程重建研究[J]. 科学通报, 2006, 51(7):856-861.
|
| [20] |
方创琳. 中国城市群形成发育的政策影响过程与实施效果评价[J]. 地理科学, 2012, 32(3):257-264.
|
| [21] |
|
| [22] |
|
| [23] |
金淑婷, 李博, 杨永春, 等. 中国城市分布特征及其影响因素[J]. 地理研究, 2015, 34(7):1352-1366.
|
| [24] |
郑德凤, 郝帅, 孙才志, 等. 中国大陆生态效率时空演化分析及其趋势预测[J]. 地理研究, 2018, 37(5):1034-1046.
|
| [25] |
方叶林, 黄震方, 陈文娣, 等. 2001—2010年安徽省县域经济空间演化[J]. 地理科学进展, 2013, 32(5):831-839.
|
| [26] |
王劲峰, 徐成东. 地理探测器:原理与展望[J]. 地理学报, 2017, 72(1):116-134.
|
| [27] |
沈惊宏, 余兆旺, 石张宇, 等. 多尺度的泛长江三角洲经济空间格局演变[J]. 经济地理, 2016, 36(2):19-26.
|
| [28] |
张建伟, 苗长虹, 肖文杰. 河南省承接产业转移区域差异及影响因素[J]. 经济地理, 2018, 38(3):106-112.
|
| [29] |
郭源园, 李莉. 西部内陆省区区域经济差异影响因素——以重庆为例[J]. 地理研究, 2017, 36(5):926-944.
|
| [30] |
王婧, 李裕瑞. 中国县域城镇化发展格局及其影响因素——基于2000和2010年全国人口普查分县数据[J]. 地理学报, 2016, 71(4):621-636.
|
| [31] |
刘林, 郭莉, 李建波, 等. 高等教育和人才集聚投入对区域经济增长的共轭驱动研究——以江苏、浙江两省为例[J]. 经济地理, 2013, 33(11):15-20.
|
| [32] |
宋涛, 程艺, 刘卫东, 等. 中国边境地缘经济的空间差异及影响机制[J]. 地理学报, 2017, 72(10):1731-1745.
|
| [33] |
李恩康, 陆玉麒, 黄群芳, 等. 泛珠江—西江经济带经济差异时空演变及其驱动因素[J]. 经济地理, 2017, 37(5):20-27.
|
| [34] |
纪小美, 付业勤, 陶卓民, 等. 福建省县域经济差异的时空动态与变迁机制[J]. 经济地理, 2016, 36(2):36-44.
|
| [35] |
于婷婷, 宋玉祥, 浩飞龙, 等. 吉林省经济效率差异及空间格局演变[J]. 地理科学, 2016, 36(7):1066-1072.
|
/
| 〈 |
|
〉 |