
环渤海地区海洋经济系统脆弱性评价
|
孙才志(1970—),男,山东烟台人,博士,教授,博士生导师。主要研究方向为水资源与海洋经济。E-mail:suncaizhi@lnnu.edu.cn。 |
收稿日期: 2018-09-03
修回日期: 2018-11-19
网络出版日期: 2025-04-20
基金资助
教育部人文社会科学重点研究基地重大课题(16JJD790021)
国家自然科学基金项目(41671119)
Vulnerability Evaluation of Marine Economic System in the Coastal Area of Bohai Rim
Received date: 2018-09-03
Revised date: 2018-11-19
Online published: 2025-04-20
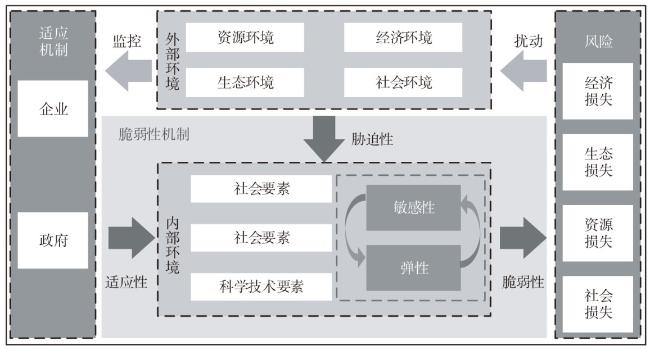
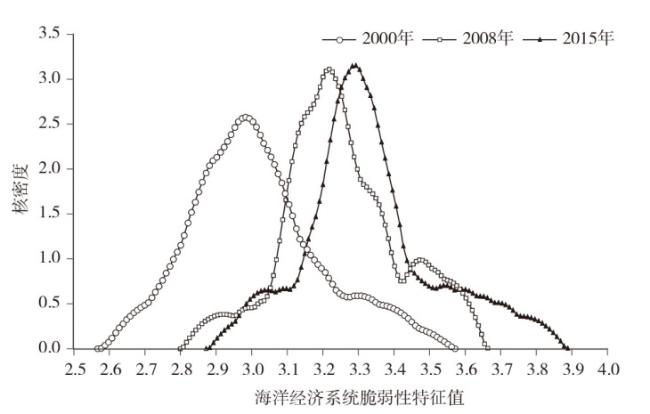
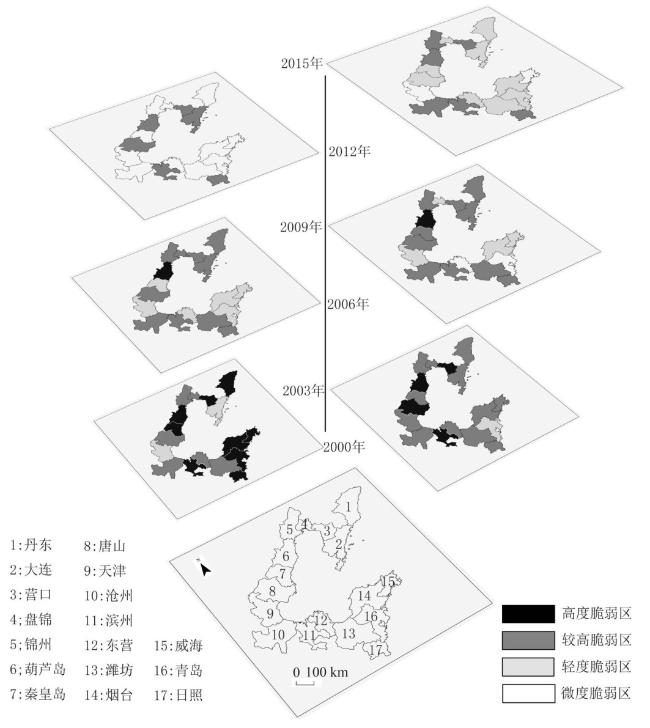
基于海洋经济系统与脆弱性内涵,提出海洋经济系统脆弱性概念,并对海洋经济系统脆弱性发生机制及属性特征进行分析。在此基础上建立以胁迫性、敏感性、弹性、适应性为基础的指标体系。鉴于海洋经济系统脆弱性评价具有模糊性,选用基于信息扩散技术的模糊综合评价方法对2000—2015年环渤海17个沿海城市进行评价,最后运用核密度估计以及信息可视化技术对环渤海地区海洋经济系统脆弱性进行时空分异分析。结果表明:①环渤海地区海洋经济系统脆弱性的整体水平及差距逐渐减小,并呈现由快到慢变化的阶段性现象。②环渤海地区海洋经济系统脆弱性时空演变脉络清晰,驱动因素差异明显。其中,大连脆弱性有所增加,青岛、威海降幅较为突出,营口、锦州、葫芦岛、沧州、潍坊未发生明显变化,其余9市均得到缓解。
孙才志 , 曹强 , 王泽宇 . 环渤海地区海洋经济系统脆弱性评价[J]. 经济地理, 2019 , 39(5) : 37 -46 . DOI: 10.15957/j.cnki.jjdl.2019.05.005
Based on the understanding of marine economic system and vulnerability, this article proposes the concept of vulnerability of marine economic system and analyzes the occurrence and attribute characteristics of vulnerability of marine economic system. On this basis, it establishes an index system based on the pressure, sensitivity, elasticity and adaptability aspects, and evaluates the vulnerability of marine economic system of the 17 coastal cities in Bohai Sea from 2000 to 2015 utilizing fuzzy comprehensive evaluation method which is based on the information diffusion technology. Finally, this paper analyzes its spatial and temporal diversity by kernel density estimation and information visualization technology. The results of the study indicate that the overall level and gap of the vulnerability of marine economic system in the 17 coastal cities of Bohai Rim region gradually decrease and its change rate is from fast to slow. From 2000 to 2015, spatiotemporal evolution path of the vulnerability of marine economic system is clear, and the driving factors are obviously different. Among 17 coastal cities, the vulnerability of Dalian has increased; the vulnerability of Qingdao, Weihai has a big drop; the vulnerability of Yingkou, Jingzhou, Huludao, Cangzhou, Weifang has no significant change; and the other 9 cities are alleviated.
表1 海洋经济系统脆弱性评价指标体系及权重Tab.1 Indicator system for vulnerability assessment of marine economic system |
| 准则层 | 子准则层 | 指标层 | 主观权重 | 客观权重 | 综合权重 |
|---|---|---|---|---|---|
| 胁迫性 | 资源胁迫性 | 海区资源相对开发率P1 | 0.094 | 0.063 | 0.070 |
| 百万元海洋GDP能耗P2 | 0.026 | 0.036 | 0.031 | ||
| 百万元海洋GDP取水P3 | 0.032 | 0.069 | 0.077 | ||
| 环境胁迫性 | 海岸线工业废水直排入海量/km P4 | 0.054 | 0.145 | 0.101 | |
| 敏感性 | 经济状态 | GDP增长率S1 | 0.019 | 0.004 | 0.010 |
| 海洋GDP增长率S2 | 0.099 | 0.019 | 0.066 | ||
| 海洋经济结构 | 海洋产业系统结构熵S3 | 0.099 | 0.024 | 0.045 | |
| 非渔产业结构指数S4 | 0.045 | 0.052 | 0.044 | ||
| 货物出口总额占海洋GDP比重S5 | 0.031 | 0.046 | 0.060 | ||
| 弹性 | 人才储备 | 科研综合技术服务业人员比重E1 | 0.059 | 0.057 | 0.060 |
| 基础设施 | 海岸线生产用码头泊位数/km E2 | 0.057 | 0.125 | 0.078 | |
| 人均城市道路面积E3 | 0.019 | 0.027 | 0.021 | ||
| 资源环境承载力 | 人均水资源量E4 | 0.020 | 0.037 | 0.036 | |
| 人均海岸线长度E5 | 0.032 | 0.090 | 0.049 | ||
| 建成区绿地覆盖率E6 | 0.020 | 0.009 | 0.014 | ||
| 适应性 | 人才引入 | 就业人口增长率A1 | 0.110 | 0.012 | 0.050 |
| 海洋经济创新投入 | 海洋产业创新投入率A2 | 0.071 | 0.024 | 0.056 | |
| 资源环境管制 | 海洋自然保护区个数A3 | 0.021 | 0.099 | 0.065 | |
| 三废综合处理率A4 | 0.059 | 0.011 | 0.021 | ||
| 污染年治理投资占海洋GDP比重A5 | 0.033 | 0.051 | 0.046 |
表2 评价指标分级标准Tab.2 Classification standards of assessment indexes |
| 指标 | 类型 | 弱 | 较弱 | 一般 | 较强 | 强 |
|---|---|---|---|---|---|---|
| P1 | 逆 | 1.00~0.45 | 0.45~0.20 | 0.20~0.09 | 0.09~0.04 | 0.04~0 |
| P2 | 正 | 0.02~0.01 | 0.03~0.02 | 0.06~0.03 | 0.10~0.06 | 0.19~0.10 |
| P3 | 正 | 2.76~1.14 | 6.67~2.76 | 16.13~6.67 | 39.03~16.13 | 94.44~39.03 |
| P4 | 正 | 1.00~0 | 2.14~1.00 | 4.57~2.14 | 9.77~4.57 | 20.90~9.77 |
| S1 | 逆 | 21.30~17.24 | 17.24~13.95 | 13.95~11.30 | 11.30~9.14 | 9.14~-7.40 |
| S2 | 逆 | 194.21~122.55 | 122.55~77.33 | 77.33~48.80 | 48.80~30.79 | 30.79~-19.43 |
| S3 | 逆 | 404.18~393.11 | 393.11~382.35 | 382.35~371.87 | 371.87~361.69 | 361.69~351.78 |
| S4 | 逆 | 33.20~4.69 | 4.69~0.66 | 0.66~0.09 | 0.09~0.01 | 0.01~0 |
| S5 | 逆 | 514.02~193.84 | 193.84~73.10 | 73.10~27.57 | 27.57~10.40 | 10.40~3.92 |
| E1 | 逆 | 0.93~0.43 | 0.43~0.20 | 0.20~0.09 | 0.09~0.04 | 0.04~0.02 |
| E2 | 逆 | 1.03~0.32 | 0.32~0.10 | 0.10~0.03 | 0.03~0.01 | 0.01~0 |
| E3 | 逆 | 28.85~17.44 | 17.44~10.54 | 10.54~6.37 | 6.37~3.85 | 3.85~2.33 |
| E4 | 逆 | 128.11~65.56 | 65.56~33.55 | 33.55~17.17 | 17.17~8.79 | 8.79~4.50 |
| E5 | 逆 | 0.63~0.27 | 0.27~0.12 | 0.12~0.05 | 0.05~0.02 | 0.02~0.01 |
| E6 | 逆 | 60.58~47.03 | 47.03~36.52 | 36.52~28.35 | 28.35~22.01 | 22.01~17.09 |
| A1 | 逆 | 47.25~38.52 | 38.52~31.40 | 31.40~25.60 | 25.60~20.87 | 20.87~-17.01 |
| A2 | 逆 | 7.23~3.56 | 3.56~1.75 | 1.75~0.86 | 0.86~0.43 | 0.43~0.21 |
| A3 | 逆 | 17~8 | 8~4 | 4~2 | 2~1 | 1~0 |
| A4 | 逆 | 1.00~0.45 | 0.45~0.20 | 0.20~0.09 | 0.09~0.04 | 0.04~0 |
| A5 | 逆 | 44~11.76 | 11.76~3.14 | 3.14~0.84 | 0.84~0.22 | 0.22~0.06 |
注:表中“正”指效益型指标,是指对海洋经济系统脆弱性有正作用;“逆”指成本型指标,是指对海洋经济系统脆弱性有副作用。 |
表3 环渤海地区海洋经济系统脆弱性级别特征值Tab.3 Characteristic values of vulnerability of marine economic system in Bohai Rim region |
| 2001 | 2003 | 2005 | 2007 | 2009 | 2011 | 2013 | 2015 | 平均值 | |
|---|---|---|---|---|---|---|---|---|---|
| 天津 | 3.215 | 3.128 | 3.199 | 3.397 | 3.353 | 3.653 | 3.618 | 3.625 | 3.401 |
| 唐山 | 3.105 | 2.961 | 3.094 | 3.017 | 3.036 | 3.000 | 3.278 | 3.348 | 3.117 |
| 秦皇岛 | 2.951 | 3.100 | 3.078 | 3.109 | 3.149 | 3.279 | 3.362 | 3.321 | 3.180 |
| 沧州 | 3.052 | 3.127 | 3.044 | 3.211 | 3.236 | 3.355 | 3.258 | 3.192 | 3.191 |
| 大连 | 3.221 | 3.005 | 3.205 | 3.099 | 3.227 | 3.301 | 3.271 | 3.322 | 3.213 |
| 丹东 | 3.045 | 3.081 | 3.097 | 3.135 | 3.237 | 3.459 | 3.439 | 3.304 | 3.208 |
| 锦州 | 3.051 | 3.068 | 3.093 | 3.178 | 3.238 | 3.296 | 3.319 | 3.254 | 3.201 |
| 营口 | 2.788 | 2.796 | 2.968 | 3.004 | 3.115 | 3.289 | 3.067 | 3.080 | 3.020 |
| 盘锦 | 3.077 | 3.080 | 3.154 | 3.275 | 3.292 | 3.397 | 3.335 | 3.307 | 3.245 |
| 葫芦岛 | 2.863 | 2.865 | 2.929 | 2.878 | 2.862 | 2.959 | 3.142 | 3.006 | 2.942 |
| 青岛 | 3.234 | 3.327 | 3.388 | 3.453 | 3.520 | 3.478 | 3.576 | 3.556 | 3.420 |
| 东营 | 3.202 | 3.211 | 3.335 | 3.439 | 3.555 | 3.557 | 3.447 | 3.448 | 3.398 |
| 烟台 | 3.004 | 3.082 | 3.217 | 3.214 | 3.348 | 3.396 | 3.382 | 3.394 | 3.238 |
| 潍坊 | 3.063 | 3.036 | 3.003 | 3.139 | 3.156 | 3.191 | 3.298 | 3.270 | 3.147 |
| 威海 | 2.965 | 3.145 | 3.082 | 3.325 | 3.416 | 3.662 | 3.678 | 3.759 | 3.356 |
| 日照 | 2.993 | 3.072 | 2.980 | 3.137 | 3.127 | 3.236 | 3.393 | 3.238 | 3.133 |
| 滨州 | 2.871 | 2.955 | 2.973 | 3.148 | 3.161 | 3.251 | 3.319 | 3.234 | 3.101 |
| [1] |
|
| [2] |
|
| [3] |
|
| [4] |
|
| [5] |
李博, 苏飞, 杨智, 等. 基于脆弱性视角的环渤海地区人海关系地域系统时空特征及演化分析[J]. 生态学报, 2018, 38(4):1436-1445.
|
| [6] |
|
| [7] |
卢亚灵, 颜磊, 许学工. 环渤海地区生态脆弱性评价及其空间自相关分析[J]. 资源科学, 2010, 32(2):303-308.
|
| [8] |
苏飞, 张平宇, 李鹤. 中国煤矿城市经济系统脆弱性评价[J]. 地理研究, 2008, 27(4):907-916.
|
| [9] |
|
| [10] |
杨振, 丁启燕, 王念, 等. 中国人口健康脆弱性地区差异与影响因素分析[J]. 地理科学, 2018, 38(1):135-142.
|
| [11] |
方创琳, 王岩. 中国城市脆弱性的综合测度与空间分异特征[J]. 地理学报, 2015, 70(2):234-247.
|
| [12] |
|
| [13] |
|
| [14] |
彭飞, 孙才志, 刘天宝, 等. 中国沿海地区海洋生态经济系统脆弱性与协调性时空演变[J]. 经济地理, 2018, 38(3):165-174.
|
| [15] |
王泽宇, 卢函, 孙才志. 中国海洋资源开发与海洋经济增长关系[J]. 经济地理, 2017, 37(11):117-126.
|
| [16] |
李博, 杨智, 苏飞. 基于集对分析的大连市人海经济系统脆弱性测度[J]. 地理研究, 2015, 34(5):967-976.
|
| [17] |
李博, 杨智, 苏飞, 等. 基于集对分析的中国海洋经济系统脆弱性研究[J]. 地理科学, 2016, 36(1):47-54.
|
| [18] |
彭飞, 韩增林, 杨俊, 等. 基于BP神经网络的中国沿海地区海洋经济系统脆弱性时空分异研究[J]. 资源科学, 2015, 37(12):2441-2450.
|
| [19] |
孙才志, 覃雄合, 李博, 等. 基于WSBM模型的环渤海地区海洋经济脆弱性研究[J]. 地理科学, 2016, 36(5):705-714.
|
| [20] |
苏为华. 多指标综合评价理论与方法问题研究[D]. 厦门: 厦门大学, 2000.
|
| [21] |
|
| [22] |
|
| [23] |
|
| [24] |
|
| [25] |
孙才志, 陈富强. 鸭绿江口滨海湿地景观生态健康评价[J]. 湿地科学, 2017, 15(1):40-46.
|
| [26] |
|
| [27] |
孙才志, 于广华, 王泽宇, 等. 环渤海地区海域承载力测度与时空分异分析[J]. 地理科学, 2014, 34(5):513-521.
|
/
| 〈 |
|
〉 |