
2000年以来中国高耗能产业的空间格局演化及其成因
|
刘汉初(1989—),男,四川内江人,博士后。主要研究方向为产业空间布局及其环境效应。E-mail:liuhanc521@sina.com。 |
收稿日期: 2018-07-13
修回日期: 2019-02-27
网络出版日期: 2025-04-20
基金资助
国家自然科学基金重点项目(41630644)
The Evolution of Spatial Distribution and Its Influencing Factors of High-Energy Intensive Industry in China Since 2000
Received date: 2018-07-13
Revised date: 2019-02-27
Online published: 2025-04-20
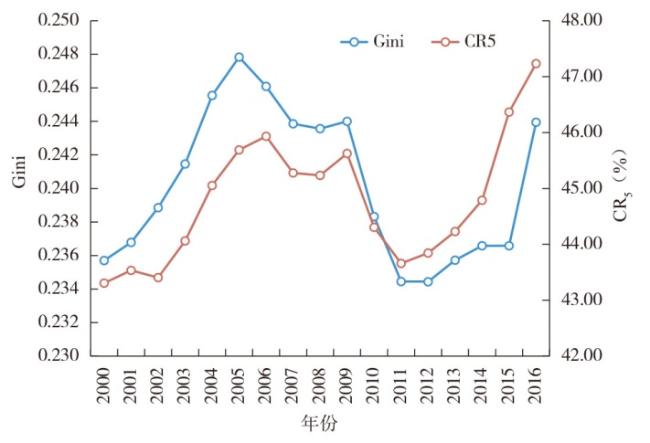
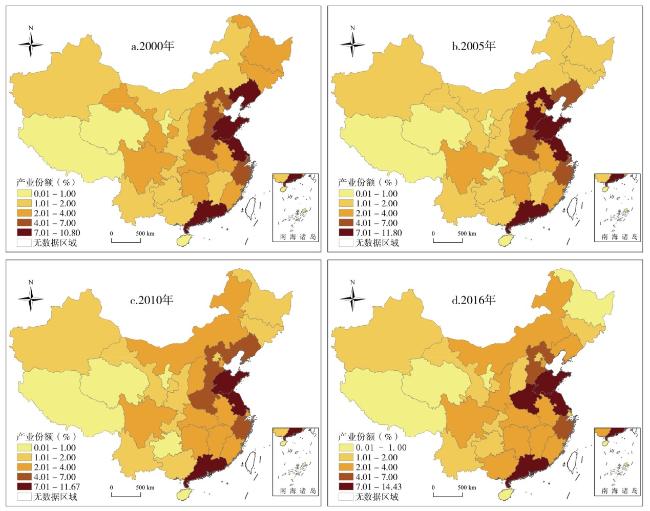
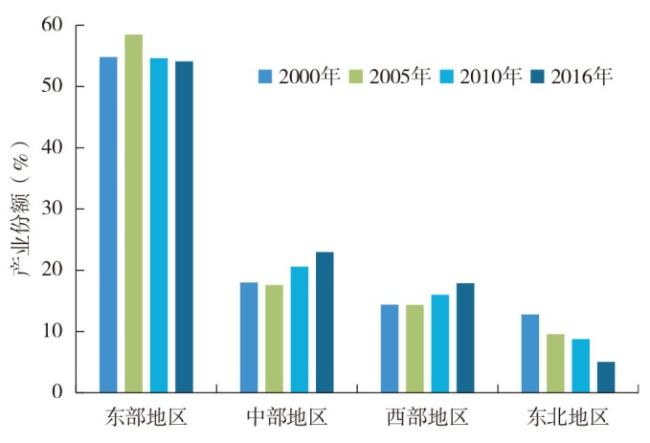
优化高耗能产业空间布局对新时期推进经济高质量发展和生态文明建设都具有重要意义。基于2000—2016年的省级面板数据,文章探讨中国高耗能产业的空间布局演化及其成因。通过计算区位基尼系数、产业集中度,发现高耗能产业省区分布较为集中,主要分布在山东、江苏、河南、广东等少数省份。动态格局方面,高耗能产业的空间格局发生重大变化,集疏过程经历“集聚—扩散—集聚”的阶段性变化。区域间主要表现为东北地区向中西部地区转移,东部地区产业份额总体不变,但区域内部格局变化显著,表现为北京、上海和广东向山东和江苏发生大规模转移。基于相关理论,文章构建高耗能产业空间分布影响因素的计量模型。统计分析表明,经济发展水平和历史基础是影响高耗能产业布局的主要因素,但影响强度正在逐步弱化;资源禀赋和经济全球化通过影响企业原材料和中间产品获取途径作用于高耗能产业的空间布局,但前者作用强度正逐渐减弱,而后者的影响则日益突出;环境规制和政府干预正逐渐成为促使高耗能产业空间扩散的重要驱动力。
刘汉初 , 樊杰 , 周道静 , 张海朋 . 2000年以来中国高耗能产业的空间格局演化及其成因[J]. 经济地理, 2019 , 39(5) : 110 -118 . DOI: 10.15957/j.cnki.jjdl.2019.05.013
Optimizing the space layout of high-energy intensive industry is of great significance to promote the construction of ecological civilization in the new era. Based on the provincial panel data from 2000 to 2016, this paper explores the spatial evolution of China's high-energy intensive industry. By calculating the location Gini coefficient and industrial concentration, it is found that the evolution of the spatial pattern of China's high-energy intensive industry has experienced the staged characteristics of "aggregation-diffusion-agglomeration". The provinces with high-energy intensive industry are relatively concentrated and are mainly distributed in a few provinces such as Shandong, Jiangsu, Henan and Guangdong. In terms of the time trend, the spatial pattern of high-energy intensive industry has undergone major changes, and the inter-regional exchanges have mainly manifested itself in the transition from the northeastern region to the central and western regions. The overall share of the industry in the eastern region remains stable, but the internal structure of the region has undergone significant changes and shows a large shift from Beijing, Shanghai and Guangdong to Shandong and Jiangsu. Based on related theories, we construct an econometric model of the influencing factors for spatial distribution of high-energy intensive industry. Statistical analysis shows that the economic level and historical basis are the main factors affecting the distribution of high-energy intensive industry, but the impact strength is gradually weakening. Resource endowments and economic globalization affect the spatial layout of high-energy intensive industry by affecting the way that companies obtain raw materials and intermediate products. However, the impact strength of the former is gradually weakening, while the latter's strength is increasingly prominent. Environmental regulation and government intervention are gradually becoming important driving forces for the spatial dispersion of high-energy intensive industry.
表1 解释变量的描述与预期符号Tab.1 Description of explanatory variables and expected symbols |
| 变量名称 | 符号 | 衡量方法 | 预期符号 |
|---|---|---|---|
| 自然资源禀赋 | NR | 地区采矿业从业人员数占全国该行业从业人员总数的比重 | + |
| 经济全球化 | FORE | 地区进出口贸易总额 | + |
| 经济发展水平 | PGDP | 地区人均GDP | 不确定 |
| 交通发展水平 | TRAN | 铁路运营里程与等级公路里程之和与国土面积的比值 | + |
| 历史基础 | HIS | 1985年地区六大高耗能产业的工业总产值占全国比重 | + |
| 环境管制 | ENVI | 单位工业产值所排放的SO2 | - |
| 集聚经济 | AGG | 工业的总产值减去高耗能产业总产值的差 | + |
| 政府干预 | GOV | 国有控股企业工业产值占所有企业工业产值的比重 | + |
表2 高耗能产业空间布局演化影响因子的回归结果Tab.2 Regression results of influencing factors for spatial distribution of high-energy intensive industry |
| 变量 | 模型(1) 2000—2016 | 模型(2) 2000—2005 | 模型(3) 2006—2010 | 模型(4) 2011—2016 |
|---|---|---|---|---|
| lnNR | 0.126*** | 0.242*** | 0.105** | 0.105*** |
| lnFORE | 0.237*** | 0.105* | 0.124*** | 0.147** |
| lnPGDP | 0.895*** | 1.456*** | 0.351*** | 0.473*** |
| lnTRAN | -0.128 | 0.007 | 0.124* | -0.009 |
| lnHIS | 0.498*** | 0.620*** | 0.566*** | 0.466*** |
| lnGOV | -0.234*** | -0.071 | -0.154* | -0.261** |
| lnENVI | -0.119*** | 0.026 | -0.283*** | -0.492*** |
| CONS | -0.900 | -4.665*** | 6.864*** | 2.343 |
| R2 | 0.842 | 0.758 | 0.806 | 0.856 |
| Wald test | 11 383.70*** | 3 065.49*** | 2 549.15*** | 412.21*** |
| Hausman test | 27.72*** | 1 129.11*** | 54.59*** | 17.21*** |
| Model | FE | FE | FE | FE |
| Obs | 527 | 186 | 155 | 186 |
注:“*、**、***”分别表示在0.10、0.05、0.01水平显著。 |
| [1] |
邵文彬, 李方一. 产能过剩背景下我国高耗能行业增长的动因分析[J]. 软科学, 2018, 32(1):41-46.
|
| [2] |
|
| [3] |
沈可挺, 龚健健. 环境污染、技术进步与中国高耗能产业——基于环境全要素生产率的实证分析[J]. 中国工业经济, 2011(12):25-34.
|
| [4] |
樊杰. 中国主体功能区划方案[J]. 地理学报, 2015, 70(2):186-201.
|
| [5] |
|
| [6] |
|
| [7] |
罗胤晨, 谷人旭. 1980—2011年中国制造业空间集聚格局及其演变趋势[J]. 经济地理, 2014, 34(7):82-89.
|
| [8] |
|
| [9] |
原嫄, 李国平, 孙铁山, 等. 中国制造业重心的空间分布变化特征与趋势研究——基于2001年和2009年数据的实证分析[J]. 人文地理, 2015, 30(5):99-105.
|
| [10] |
胡伟, 张玉杰. 中国工业发展的空间格局演变[J]. 经济地理, 2015, 35(7):105-112.
|
| [11] |
贺灿飞, 朱彦刚, 朱晟君. 产业特性、区域特征与中国制造业省区集聚[J]. 地理学报, 2010, 65(10):1218-1228.
|
| [12] |
焦兵, 李方超. 中国油气资源产业的空间布局及影响因素研究[J]. 中国矿业, 2013, 22(9):1-5,10.
|
| [13] |
|
| [14] |
贺曲夫, 刘友金. 我国东中西部地区间产业转移的特征与趋势——基于2000—2010年统计数据的实证分析[J]. 经济地理, 2012, 32(12):85-90.
|
| [15] |
石敏俊, 逄瑞, 郑丹, 等. 中国制造业产业结构演进的区域分异与环境效应[J]. 经济地理, 2017, 37(10):108-115.
|
| [16] |
周沂, 贺灿飞, 刘颖. 中国污染密集型产业地理分布研究[J]. 自然资源学报, 2015, 30(7):1183-1196.
|
| [17] |
廖双红, 肖雁飞. 污染产业区域间转移与中部地区碳转移空间特征及启示[J]. 经济地理, 2017, 37(2):132-140.
|
| [18] |
贺灿飞, 朱彦刚. 中国资源密集型产业地理分布研究——以石油加工业和黑色金属产业为例[J]. 自然资源学报, 2010, 25(3):488-501.
|
| [19] |
高菠阳. 中国重点工业行业空间变化特征[J]. 经济地理, 2012, 32(3):82-88.
|
| [20] |
孙祥栋, 张亮亮. 中国有色金属行业的地理分布——基于空间杜宾模型的实证分析[J]. 技术经济, 2016(6):96-100.
|
| [21] |
刘鹤, 金凤君, 刘毅. 中国石化产业空间组织的演进历程与机制[J]. 地理研究, 2012, 31(11):2031-2043.
|
| [22] |
|
| [23] |
|
| [24] |
|
| [25] |
中华人民共和国国家统计局. 中华人民共和国2017年国民经济和社会发展公报[M]. 北京: 中国统计出版社, 2018.
|
| [26] |
|
| [27] |
|
| [28] |
|
| [29] |
梁育填, 樊杰, 柳林, 等. 优化开发区域制造业企业迁移的因素及其区域影响:以广东东莞市为例[J]. 地理研究, 2013, 32(3):497-506.
|
| [30] |
王国蒙, 王元地, 杨雪. 环境管制对环境库兹涅兹曲线的影响研究[J]. 软科学, 2017, 31(12):78-81,86.
|
| [31] |
黄继忠, 冀刚. 外部性与产业发展——一个理论分析框架[J]. 技术经济与管理研究, 2018(2):113-118.
|
| [32] |
沈静. 环境管制影响下的佛山陶瓷产业区位变动机制[J]. 地理学报, 2012, 67(4):467-478.
|
| [33] |
国务院公报. 国务院关于“十一五”期间各地区单位生产总值能源消耗降低指标计划的批复[EB/OL]. http://www.gov.cn/gongbao/content/2006/content_443285.htm,2018-06-01.
|
/
| 〈 |
|
〉 |