
京津冀城市群就业密度空间分布特征及溢出效应
|
罗翔(1978—),男,江西九江人,博士,副教授。主要研究方向为区域经济学与发展经济学。E-mail:philiplaw@163.com。 |
收稿日期: 2019-03-22
修回日期: 2020-05-18
网络出版日期: 2025-04-18
基金资助
国家自然科学基金项目(71974071)
国家自然科学基金项目(71774066)
国家自然科学基金项目(71904151)
华中师范大学“土地利用与粮食安全”青年学术创新团队项目(CNU19TD004)
Spatial Distribution Characteristics and Spillover Effect of Employment Density in Beijing-Tianjin-Hebei Metropolitan Region
Received date: 2019-03-22
Revised date: 2020-05-18
Online published: 2025-04-18
城市群的发展是国家经济发展的主要载体,对就业密度的考察是理解城市群规模与效率的一个重要视角。文章基于2000—2015年京津冀城市群180个区县(市)的面板数据,考察了其就业密度的空间分布特征与溢出效应。文章研究发现:城市群整体的就业密度向一线城市集中,廊道扩散特征明显;城市群内部就业密度的空间分布差异显著,是以北京强中心为主导的多中心结构;就业密度的空间溢出效应与就业集聚程度有关,就业密度越高的地区,其空间溢出效应明显,就业密度低的地区不具有空间溢出效应。文章的政策建议是:进一步降低中心城市就业门槛,支持经济的跨地区合作;在不同就业密度地区,实行差异化的产业发展功能定位。
罗翔 , 宋鑫 , 朱丽霞 , 万庆 , 张祚 . 京津冀城市群就业密度空间分布特征及溢出效应[J]. 经济地理, 2020 , 40(8) : 59 -66 . DOI: 10.15957/j.cnki.jjdl.2020.08.008
The development of urban agglomerations is the main carrier of national economic development. The study of employment density is an important perspective to understand the size and efficiency of city groups. This paper uses the panel data of 180 districts and counties in the Beijing-Tianjin-Hebei metropolitan region from 2000 to 2015,studying the spatial distribution and the spatial spillover effect of employment density. The main findings are: The spatial and temporal evolution of employment density gradually converges to the first-tier cities in the core area,with obvious corridor diffusion characteristics;Within the Beijing-Tianjin-Hebei metropolitan region,the spatial distribution of employment density varies greatly and is a multi-center structure dominated by Beijing Strong Center; The spatial spillover effect of employment density is related to the degree of employment agglomeration,and the spillover effect is obvious in those areas where the employment density is higher and the spillover effect is not shown in the areas with low employment density. The policy implications of this paper are as follows: further lowering the employment threshold of central cities,supporting cross-regional economic cooperation; implementing differentiated industrial development orientation in different employment density areas.
表1 变量设定及说明Tab.1 Variate setting and description |
| 变量分类 | 变量名称 | 变量含义 | 单位 |
|---|---|---|---|
| 被解释变量 | 就业密度 | 单位面积的就业人数 | 人/km2 |
| 解释变量 | 就业密度空间 溢出效应 | 就业密度的空间滞后项 | 人/km2 |
| 控制变量 | 人均GDP | 人均国内生产总值 | 元 |
| 二三产业占比 | 二三产业占GDP的比重 | % | |
| 人均医疗床位 | 人均拥有的医院、卫生机构的 床位 | 张 | |
| 人均福利院 | 人均拥有的社会福利院数 | 个 | |
| 教育水平 | 每万人大学生人数 | 人 | |
| 城市化率 | 城镇人口占总人口比 | % | |
| 矩阵 | 空间权重矩阵 | Queen法则下180×180的矩阵 |
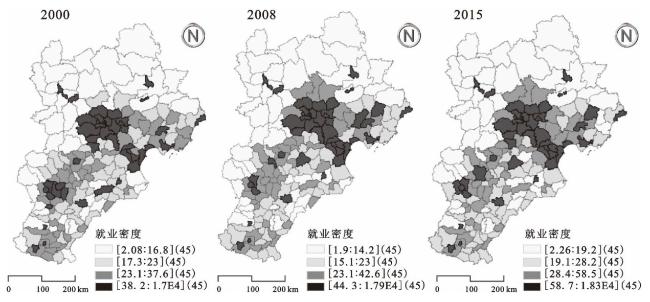
图2 京津冀地区就业密度核密度图Fig.2 Nuclear density figure of employment density in Beijing-Tianjin-Hebei metropolitan region |
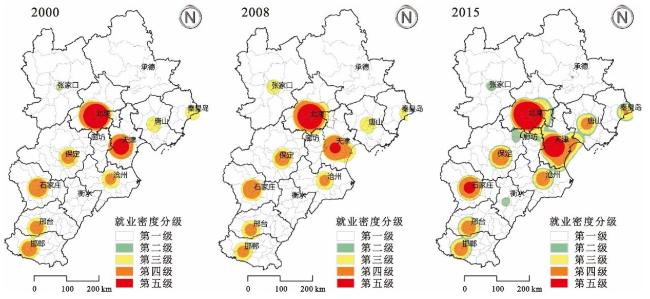
表2 京津冀城市群就业密度分市分梯度数量表Tab.2 Grading scale table of employment density in Beijing-Tianjin-Hebei metropolitan region |
| 城市 | 年份 | 梯队划分 | 城市 | 年份 | 梯队划分 | 城市 | 年份 | 梯队划分 | |||||||||
|---|---|---|---|---|---|---|---|---|---|---|---|---|---|---|---|---|---|
| 一 | 二 | 三 | 四 | 一 | 二 | 三 | 四 | 一 | 二 | 三 | 四 | ||||||
| 北京 | 2000 | 14 | 1 | 2 | 1 | 廊坊 | 2000 | 4 | 1 | 4 | 0 | 衡水 | 2000 | 1 | 1 | 6 | 3 |
| 2008 | 14 | 4 | 0 | 0 | 2008 | 4 | 1 | 4 | 0 | 2008 | 1 | 1 | 4 | 5 | |||
| 2015 | 14 | 4 | 0 | 0 | 2015 | 3 | 3 | 2 | 1 | 2015 | 1 | 2 | 6 | 2 | |||
| 天津 | 2000 | 7 | 3 | 3 | 0 | 张家口 | 2000 | 1 | 0 | 0 | 13 | 邢台 | 2000 | 1 | 5 | 6 | 6 |
| 2008 | 9 | 2 | 2 | 0 | 2008 | 1 | 0 | 0 | 13 | 2008 | 1 | 3 | 8 | 6 | |||
| 2015 | 9 | 4 | 0 | 0 | 2015 | 1 | 0 | 0 | 13 | 2015 | 1 | 6 | 6 | 5 | |||
| 石家庄 | 2000 | 7 | 6 | 1 | 4 | 承德 | 2000 | 1 | 0 | 0 | 8 | 邯郸 | 2000 | 1 | 9 | 4 | 2 |
| 2008 | 3 | 10 | 0 | 5 | 2008 | 1 | 0 | 0 | 8 | 2008 | 1 | 7 | 8 | 0 | |||
| 2015 | 4 | 6 | 4 | 4 | 2015 | 1 | 0 | 0 | 8 | 2015 | 1 | 5 | 10 | 0 | |||
| 唐山 | 2000 | 2 | 5 | 4 | 0 | 秦皇岛 | 2000 | 1 | 1 | 2 | 1 | ||||||
| 2008 | 4 | 3 | 4 | 0 | 2008 | 1 | 0 | 3 | 1 | ||||||||
| 2015 | 3 | 3 | 5 | 0 | 2015 | 1 | 0 | 1 | 3 | ||||||||
| 保定 | 2000 | 3 | 9 | 7 | 4 | 沧州 | 2000 | 2 | 4 | 6 | 3 | ||||||
| 2008 | 3 | 10 | 6 | 4 | 2008 | 2 | 4 | 6 | 3 | ||||||||
| 2015 | 4 | 9 | 5 | 5 | 2015 | 2 | 3 | 6 | 4 | ||||||||
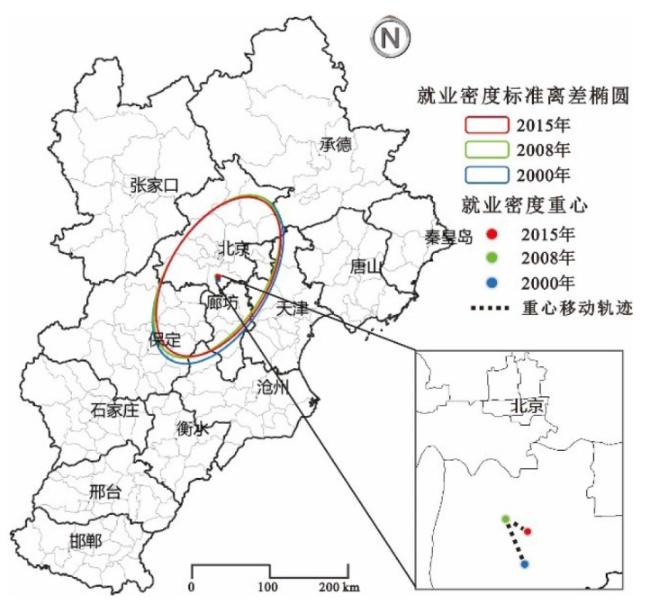
图3 京津冀城市群就业密度重心和标准离差椭圆变动Fig.3 Gravity and standard deviation ellipse change of employment density in Beijing-Tianjin-Hebei metropolitan region |
表3 京津冀城市群就业密度整体增长态势的空间统计结果Tab.3 Spatial statistical results of the employment density's overall growth trend in Beijing-Tianjin-Hebei metropolitan region |
| 指标 | 2000 | 2008 | 2015 |
|---|---|---|---|
| 就业密度重心(x,y) | (-17 683,106 748 9) | (-19 145,107 186 6) | (-17 701,107 112 0) |
| 标准离差椭圆面积(km2) | 22 239.98 | 20 799.49 | 20 821.1 |
| 标准离差椭圆长轴(m) | 112 138.86 | 10 8401.67 | 105 854.07 |
| 标准离差椭圆短轴(m) | 63 133.91 | 61 080.29 | 62 603.77 |
| 旋转角(°) | 28.56 | 29.06 | 28.04 |
| 空间密集性指数 | 526.13 | 609.26 | 821.76 |
表4 京津冀城市群就业密度全局自相关检验结果Tab.4 Global autocorrelation test results of employment density in Beijing-Tianjin-Hebei metropolitan region |
| 年份 | Moran's I | P值 | Z值 | 年份 | Moran's I | P值 | Z值 |
|---|---|---|---|---|---|---|---|
| 2000 | 0.5023 | 0.001 | 11.4875 | 2008 | 0.5493 | 0.001 | 14.5584 |
| 2001 | 0.5265 | 0.001 | 12.6049 | 2009 | 0.5575 | 0.001 | 14.6182 |
| 2002 | 0.5381 | 0.001 | 12.7667 | 2010 | 0.6519 | 0.001 | 15.2550 |
| 2003 | 0.5419 | 0.001 | 14.5753 | 2011 | 0.6545 | 0.001 | 16.1734 |
| 2004 | 0.5071 | 0.001 | 13.3459 | 2012 | 0.6574 | 0.001 | 16.1987 |
| 2005 | 0.5048 | 0.001 | 13.2747 | 2013 | 0.6579 | 0.001 | 16.1993 |
| 2006 | 0.5043 | 0.001 | 12.3252 | 2014 | 0.6788 | 0.001 | 16.0012 |
| 2007 | 0.5015 | 0.001 | 12.6737 | 2015 | 0.7074 | 0.001 | 14.2351 |
表5 回归结果Tab.5 Regression results |
| 被解释变量:就业密度 | 模型1 SAR | 模型2 SEM | 模型3 系统GMM-SAR |
|---|---|---|---|
| 就业密度空间溢出 | 0.013(0.010) | 0.010(0.010) | |
| 就业密度空间误差 | 0.022***(0.011) | ||
| 人均GDP | 0.316***(0.111) | 0.344***(0.059) | 0.277***(0.103) |
| 二三产业占比 | 0.432***(0.105) | 0.411***(0.101) | 0.422***(0.182) |
| 人均医疗床位 | 0.000(0.044) | 0.000(0.077) | 0.001(0.010) |
| 人均福利院 | 0.000(0.001) | 0.001(0.003) | 0.000(0.000) |
| 教育水平 | 0.112***(0.003) | 0.205***(0.011) | 0.331***(0.012) |
| 城市化率 | 0.443***(0.061) | 0.404***(0.069) | 0.712***(0.315) |
| 识别不足LM检验 | 382.774*** | ||
| 过度识别Hansen J检验 | 通过 | ||
| 观察值 | 2 880 | 2 880 | 2 880 |
注:*、**、***分别表示在10%、5%、1%的置信水平下显著;括号内报告的是标准误;模型1至模型3均是使用最大似然估计(MLE)。 |
表6 分组回归结果Tab.6 Grouped regression results |
| 被解释变量:就业密度 | 系统GMM-SAR | |||
|---|---|---|---|---|
| 模型4 0.25就业密度分位数以下 | 模型5 中位数就业密度以下 | 模型6 中位数就业密度以上 | 模型7 0.75就业密度分位数以上 | |
| 就业密度空间溢出 | 0.001(0.021) | 0.010(0.022) | 0.034***(0.014) | 0.072***(0.024) |
| 控制变量 | 控制 | 控制 | 控制 | 控制 |
| 识别不足LM检验 | 311.625*** | 201.766*** | 403.552*** | 450.140*** |
| 过度识别Hansen J检验 | 通过 | 通过 | 通过 | 通过 |
| 观察值 | 720 | 1440 | 1440 | 720 |
注:*、**、***分别表示在10%、5%、1%的置信水平下显著;括号内报告的是标准误;模型4至模型7均是使用最大似然估计(MLE)。 |
| [1] |
|
| [2] |
陆铭. 空间的力量:地理、政治与城市发展[M]. 上海: 格致出版社, 2013.
|
| [3] |
|
| [4] |
|
| [5] |
沈体雁, 张晓欢, 赵作权. 东北地区就业密度分布的空间特征——基于两次经济普查数据的空间计量经济分析[J]. 经济地理, 2012, 32(10):14-20.
|
| [6] |
|
| [7] |
|
| [8] |
蒋丽, 吴缚龙. 广州市就业次中心和多中心城市研究[J]. 城市规划学刊, 2009(3):75-81.
|
| [9] |
曾海宏, 孟晓晨, 李贵才. 深圳市就业空间结构及其演变(2001——2004)[J]. 人文地理, 2010(3):34-40.
|
| [10] |
|
| [11] |
刘碧寒, 沈凡卜. 北京都市区就业—居住空间结构及特征研究[J]. 人文地理, 2011, 26(4):40-47.
|
| [12] |
张勤. 武汉市就业分布的时空演变研究[D]. 武汉: 华中师范大学, 2014.
|
| [13] |
|
| [14] |
吴文钰, 马西亚. 多中心城市人口模型及模拟:以上海为例[J]. 现代城市研究, 2006, 21(12):39-44.
|
| [15] |
沈体雁, 张晓欢, 赵作权, 等. 中国就业密度分布的空间特征[J]. 地理与地理信息科学, 2013, 29(1):64-68.
|
| [16] |
劳昕, 沈体雁, 温锋华. 长三角与珠三角就业密度分布比较研究[J]. 城市发展研究, 2013, 20(12):12-17.
|
| [17] |
沙勇, 郭洁. 京津冀地区就业增长的空间集散趋势分析[J]. 人口与发展, 2014, 20(5):2-9.
|
| [18] |
|
| [19] |
|
| [20] |
范剑勇. 产业集聚与地区间劳动生产率差异[J]. 经济研究, 2006(11):72-81.
|
| [21] |
|
| [22] |
|
| [23] |
刘修岩, 殷醒民. 空间外部性与地区工资差异:基于动态面板数据的实证研究[J]. 经济学(季刊), 2009, 8(1):77-98.
|
| [24] |
苏红键, 魏后凯. 密度效应、最优城市人口密度与集约型城镇化[J]. 中国工业经济, 2013(10):5-17.
|
| [25] |
韩峰, 柯善咨. 城市就业密度、市场规模与劳动生产率——对中国地级及以上城市面板数据的实证分析[J]. 城市与环境研究, 2015(1):51-70.
|
| [26] |
|
| [27] |
曾国平, 吴明娥. 服务业的集聚与城市化——基于省级面板数据的空间计量分析[J]. 城市问题, 2013(12):55-61.
|
| [28] |
杨静, 杨向辉, 张光源. 中国第三产业就业创造的影响因素——基于14个行业面板数据的实证分析[J]. 财经科学, 2015(6):97-107.
|
/
| 〈 |
|
〉 |