
基于两阶段DEA模型的高校科技创新对区域创新绩效影响
|
王辉(1982—),女,湖南冷水江人,博士,教授,硕士生导师。主要研究方向为区域经济发展。E-mail:453778461@qq.com。 |
收稿日期: 2019-09-02
修回日期: 2020-05-29
网络出版日期: 2025-04-18
基金资助
教育部人文社会科学研究青年基金项目(17YJC880099)
湖南省社会科学成果评审委员会课题(XSPYBZZ052)
Science and Technology Innovation of Universities on Regional Innovation Performance Based on Two-Stage DEA Model
Received date: 2019-09-02
Revised date: 2020-05-29
Online published: 2025-04-18
王辉 , 陈敏 . 基于两阶段DEA模型的高校科技创新对区域创新绩效影响[J]. 经济地理, 2020 , 40(8) : 27 -35 . DOI: 10.15957/j.cnki.jjdl.2020.08.004
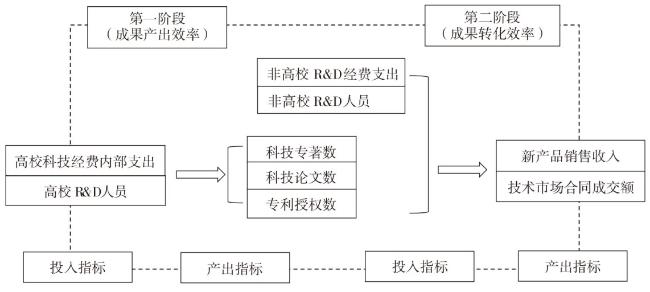
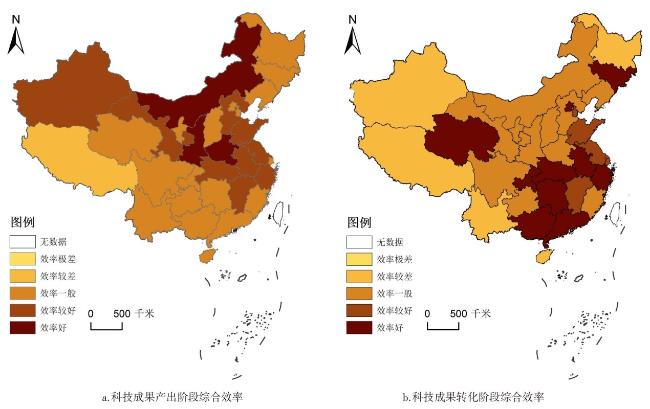
The process of the impact of university science and technology innovation on regional innovation performance was divided into two stages in this article: the output of scientific and technological achievements and the transformation of scientific and technological achievements. The paper establish a two-stage DEA model to evaluate the performance impact of university science and technology innovation on regional innovation performance,with 31 provinces as a research sample. The research results show that: 1) the overall efficiency which the scientific and technological innovation of universities on regional innovation performance in China is not reached the DEA level; when it comes to the output stage of scientific and technological achievements,4 provinces including Inner Mongolia,Henan,Guizhou,Xinjiang have reached the DEA level; and 11 provinces including Beijing,Tianjin,Jilin,Shanghai,Zhejiang,Anhui,Jiangxi,Guangdong,Guangxi,Chongqing,Qinghai have reached the DEA level on the transformation efficiency of scientific and technological achievements. 2) Compare the two-stage efficiency,there is a phenomenon in the province of "there will be another",and technical efficiency is the key to improving the efficiency of the two phases; 3) The reason why some provinces fail to achieve DEA efficiency is that there are some problems such as redundant input or insufficient output. By optimizing the allocation of resources in universities,strengthening cooperation between industry,universities and research institutes,improving innovation systems in the region,and focusing on inter-regional cooperation and innovation,it's possible to promote the development of scientific and technological innovation in universities and improve regional innovation performance.
表1 我国31个省(自治区、直辖市)科技成果产出与科技成果转化阶段绩效评价Tab.1 Performance evaluation of the output and transformation stage of scientific and technological achievements of 31 provinces (autonomous regions, municipalities) in China |
| 省份 | 第一阶段 | 省份 | 第二阶段 | |||||||
|---|---|---|---|---|---|---|---|---|---|---|
| 综合效率 | 纯技术效率 | 规模效率 | 规模效应 | 综合效率 | 纯技术效率 | 规模效率 | 规模效应 | |||
| 北京 | 0.605 | 1.000 | 0.605 | drs | 北京 | 1.000 | 1.000 | 1.000 | - | |
| 天津 | 0.480 | 0.487 | 0.986 | irs | 天津 | 0.844 | 1.000 | 0.844 | drs | |
| 河北 | 0.892 | 0.986 | 0.905 | drs | 河北 | 0.660 | 0.661 | 0.999 | irs | |
| 山西 | 0.516 | 0.521 | 0.989 | irs | 山西 | 0.652 | 0.653 | 0.998 | irs | |
| 内蒙古 | 1.000 | 1.000 | 1.000 | - | 内蒙古 | 0.434 | 0.450 | 0.964 | irs | |
| 辽宁 | 0.620 | 0.727 | 0.853 | drs | 辽宁 | 0.717 | 0.725 | 0.990 | drs | |
| 吉林 | 0.511 | 0.588 | 0.869 | drs | 吉林 | 1.000 | 1.000 | 1.000 | - | |
| 黑龙江 | 0.617 | 0.626 | 0.985 | irs | 黑龙江 | 0.388 | 0.496 | 0.783 | drs | |
| 上海 | 0.729 | 0.838 | 0.870 | drs | 上海 | 0.972 | 0.974 | 0.998 | irs | |
| 江苏 | 0.964 | 1.000 | 0.964 | drs | 江苏 | 0.808 | 0.822 | 0.983 | drs | |
| 浙江 | 0.883 | 0.907 | 0.973 | drs | 浙江 | 1.000 | 1.000 | 1.000 | - | |
| 安徽 | 0.803 | 0.808 | 0.994 | irs | 安徽 | 1.000 | 1.000 | 1.000 | - | |
| 福建 | 0.688 | 0.712 | 0.967 | irs | 福建 | 0.554 | 0.555 | 0.998 | irs | |
| 江西 | 0.933 | 0.957 | 0.974 | irs | 江西 | 0.976 | 0.980 | 0.996 | irs | |
| 山东 | 0.800 | 0.856 | 0.934 | drs | 山东 | 0.856 | 0.861 | 0.995 | irs | |
| 河南 | 1.000 | 1.000 | 1.000 | - | 河南 | 0.749 | 0.751 | 0.998 | drs | |
| 湖北 | 0.894 | 1.000 | 0.894 | drs | 湖北 | 1.000 | 1.000 | 1.000 | - | |
| 湖南 | 0.715 | 0.762 | 0.939 | drs | 湖南 | 1.000 | 1.000 | 1.000 | - | |
| 广东 | 0.618 | 0.975 | 0.633 | drs | 广东 | 1.000 | 1.000 | 1.000 | - | |
| 广西 | 0.787 | 0.820 | 0.959 | irs | 广西 | 1.000 | 1.000 | 1.000 | - | |
| 海南 | 0.796 | 1.000 | 0.796 | irs | 海南 | 0.319 | 0.341 | 0.936 | irs | |
| 重庆 | 0.744 | 0.747 | 0.996 | irs | 重庆 | 1.000 | 1.000 | 1.000 | - | |
| 四川 | 0.617 | 0.817 | 0.755 | drs | 四川 | 0.471 | 0.497 | 0.948 | drs | |
| 贵州 | 0.783 | 0.819 | 0.956 | irs | 贵州 | 0.487 | 0.511 | 0.953 | drs | |
| 云南 | 0.727 | 0.730 | 0.995 | irs | 云南 | 0.349 | 0.371 | 0.940 | drs | |
| 西藏 | 0.340 | 1.000 | 0.340 | irs | 西藏 | 0.248 | 1.000 | 0.248 | irs | |
| 陕西 | 1.000 | 1.000 | 1.000 | - | 陕西 | 0.685 | 0.773 | 0.886 | drs | |
| 甘肃 | 0.857 | 0.872 | 0.983 | irs | 甘肃 | 0.482 | 0.605 | 0.797 | drs | |
| 青海 | 0.796 | 1.000 | 0.796 | irs | 青海 | 1.000 | 1.000 | 1.000 | - | |
| 宁夏 | 0.746 | 0.824 | 0.906 | irs | 宁夏 | 0.673 | 0.756 | 0.890 | irs | |
| 新疆 | 0.842 | 0.883 | 0.954 | irs | 新疆 | 0.366 | 0.373 | 0.980 | irs | |
| mean | 0.752 | 0.847 | 0.896 | mean | 0.732 | 0.779 | 0.940 | |||
表2 综合效率等级分类体系Tab.2 Comprehensive efficiency rating system |
| 综合效率值范围 | 效率等级 |
|---|---|
| 1.0 | 第一类效率好 |
| [0.8,1.0) | 第二类效率较好 |
| [0.4,0.8) | 第三类效率一般 |
| [0.2,0.4) | 第四类效率较差 |
| (0,0.2) | 第五类效率极差 |
表3 科技成果产出阶段的优化分析Tab.3 Optimization of the output stage of scientific and technological achievements |
| 省份 | 产出不足 | 投入冗余 | ||||
|---|---|---|---|---|---|---|
| 科技论文 (篇) | 科技专著 (篇) | 专利授权 (件) | 高校R&D 人员(人) | 高校R&D 经费内部 支出(万元) | ||
| 北京 | 0 | 0 | 0 | 0 | 0 | |
| 天津 | 0 | 108.022 | 1 554.819 | 0 | 103 394.9 | |
| 河北 | 0 | 380.986 | 532.294 | 8 678.057 | 0 | |
| 山西 | 0 | 243.795 | 0 | 0 | 0 | |
| 辽宁 | 0 | 0 | 1 879.822 | 0 | 8 429.299 | |
| 吉林 | 0 | 977.208 | 1 201.91 | 0 | 0 | |
| 黑龙江 | 3 931.001 | 18.096 | 0 | 0 | 0 | |
| 上海 | 0 | 0 | 2 781.482 | 0 | 144 320.8 | |
| 江苏 | 0 | 0 | 0 | 0 | 0 | |
| 浙江 | 28 112.97 | 727.549 | 0 | 0 | 0 | |
| 安徽 | 8 460.751 | 747.7 | 0 | 0 | 0 | |
| 福建 | 3 432.15 | 772.431 | 0 | 2 809.152 | 0 | |
| 江西 | 0 | 256.415 | 0 | 0 | 0 | |
| 山东 | 7 406.572 | 742.486 | 0 | 4 349.091 | 0 | |
| 湖北 | 0 | 0 | 0 | 0 | 0 | |
| 湖南 | 0 | 797.686 | 687.723 | 0 | 0 | |
| 广东 | 0 | 478.401 | 6 797.957 | 9 865.384 | 0 | |
| 广西 | 850.608 | 738.606 | 0 | 6 674.174 | 0 | |
| 海南 | 0 | 0 | 0 | 0 | 0 | |
| 重庆 | 0 | 168.868 | 0 | 0 | 0 | |
| 四川 | 0 | 940.916 | 2 435.281 | 5 069.501 | 0 | |
| 贵州 | 0 | 369.412 | 0 | 1 336.094 | 0 | |
| 云南 | 0 | 373.481 | 0 | 856.848 | 0 | |
| 西藏 | 0 | 0 | 0 | 0 | 0 | |
| 甘肃 | 0 | 111.774 | 0 | 0 | 0 | |
| 青海 | 0 | 0 | 0 | 0 | 0 | |
| 宁夏 | 0 | 63.016 | 36.895 | 14.258 | 0 | |
| 新疆 | 0 | 552.916 | 0 | 3 338.601 | 0 | |
| mean | 1 683.679 | 308.702 | 577.683 | 1 386.812 | 8 262.742 | |

表4 科技成果转化阶段的优化分析Tab.4 Optimization of the transformation stage of scientific and technological achievements |
| 省份 | 产出不足 | 投入冗余 | ||||
|---|---|---|---|---|---|---|
| 新产品 销售收入 (万元) | 技术市场合同成交金额 (亿元) | 科技论文 (篇) | 科技专著 (篇) | 专利授权 (件) | ||
| 天津 | 0 | 0 | 0 | 0 | 0 | |
| 河北 | 0 | 131.053 | 0 | 545.333 | 0 | |
| 山西 | 0 | 0 | 505.838 | 230.553 | 0 | |
| 内蒙古 | 0 | 21.706 | 8 879.129 | 770.93 | 0 | |
| 辽宁 | 0 | 0 | 11 689.91 | 946.658 | 0 | |
| 黑龙江 | 0 | 0 | 14 540.94 | 494.187 | 4 208.825 | |
| 上海 | 0 | 0 | 39 492.36 | 1 465.083 | 2 850.598 | |
| 江苏 | 0 | 0 | 26 596.18 | 671.512 | 12 759.15 | |
| 福建 | 0 | 64.504 | 793.44 | 0 | 0 | |
| 江西 | 0 | 4.006 | 0 | 72.86 | 23.386 | |
| 山东 | 0 | 0 | 0 | 460.079 | 3 878.019 | |
| 河南 | 0 | 173.453 | 6 459.521 | 1 205.66 | 0 | |
| 海南 | 0 | 10.234 | 573.248 | 224.123 | 0 | |
| 四川 | 0 | 0 | 11 551.65 | 0 | 2 668.109 | |
| 贵州 | 0 | 0 | 0 | 141.523 | 226.281 | |
| 云南 | 0 | 0 | 0 | 307.452 | 93.063 | |
| 西藏 | 0 | 0 | 0 | 0 | 0 | |
| 陕西 | 0 | 0 | 19 553.56 | 0 | 5 507.724 | |
| 甘肃 | 0 | 0 | 7 115.752 | 459.617 | 617.765 | |
| 宁夏 | 0 | 23.969 | 2 918.469 | 113.642 | 0 | |
| 新疆 | 0 | 48.013 | 3 488.161 | 7.605 | 0 | |
| mean | 0 | 15.385 | 4 972.844 | 261.833 | 1 059.127 | |
| [1] |
肖洒, 刘君. 区域高等教育科技创新能力协同发展测度分析[J]. 经济地理, 2018, 38(8):124-131.
|
| [2] |
|
| [3] |
|
| [4] |
张鹏, 于伟. 高校对区域创新效率的影响:基于随机前沿生产函数的分析[J]. 教育与经济, 2013(6):24-29.
|
| [5] |
肖振红, 范君荻. 科技人力资源投入对区域创新绩效的影响研究[J]. 科学学研究, 2019, 37(11):1944-1954.
|
| [6] |
程鹏. 高校R&D知识溢出与区域创新能力——基于空间杜宾模型的实证研究[J]. 教育与经济, 2014(6):60-68
|
| [7] |
李宪印, 于婷, 刘忠花. 基于EBA 模型的高校创新与区域创新的协同作用研究[J]. 经济与管理评论, 2017(2):41-47.
|
| [8] |
王家庭, 谢郁, 倪方树, 等. 高等教育资源集聚对提升区域创新能力的影响研究[J]. 创新, 2016, 10(5):39-48.
|
| [9] |
王淑英, 秦芳. 基于空间面板模型的高校创新产出溢出效应的实证研究[J]. 软科学, 2015(7):64-68.
|
| [10] |
张海滨, 陈笃彬. 基于三螺旋理论的高校支撑区域创新体系评价研究[J]. 东南学术, 2012(1):181-189.
|
| [11] |
|
| [12] |
郭泉恩, 孙斌栋. 高校知识溢出对我国高技术产业创新的影响研究——基于省级区域的空间计量分析[J]. 世界地理研究, 2017, 26(4):82-92.
|
| [13] |
|
| [14] |
原毅军, 黄菁菁. FDI、产学研合作与区域创新产出——基于互补性检验的实证研究[J]. 研究与发展管理, 2016, 28(6):38-47.
|
| [15] |
|
| [16] |
何郁冰. 产学研协同创新的理论模式[J]. 科学学研究, 2012, 30(2):165-174.
|
| [17] |
|
| [18] |
王鹏, 张剑波. 高校创新投入、产学合作与大中型企业创新产出——基于我国十三省市面板数据的实证研究[J]. 暨南学报, 2014(10):59-67.
|
| [19] |
李林, 傅庆. 产学研主体创新效率对区域创新的影响研究[J]. 科技进步与对策, 2014, 31(5):45-49.
|
| [20] |
王晓珍, 蒋子浩, 郑颖. 我国高校创新效率评价研究:八大区域视角[J]. 科研管理, 2019, 40(3):114-125.
|
| [21] |
张博榕, 李春成. 基于两阶段动态 DEA 模型的区域创新绩效实证分析[J]. 科技管理研究, 2016(12):62-67.
|
| [22] |
|
| [23] |
|
| [24] |
王新红, 薛泽蓉, 张行. 基于两阶段DEA模型的混合所有制企业创新效率测度研究——基于制造业上市企业的经验数据[J]. 科技管理研究, 2018, 38(14):61-67.
|
| [25] |
|
| [26] |
吴卫红, 杨婷, 张爱美, 等. 创新资源集聚对区域创新绩效的溢出效应[J]. 科技进步与对策, 2017, 34(17):40-45.
|
| [27] |
|
| [28] |
赵树宽, 余海晴, 巩顺龙. 基于DEA方法的吉林省高技术企业创新效率研究[J]. 科研管理, 2013, 34(2):36-43.
|
/
| 〈 |
|
〉 |