
中国西部城市参与全球和全国竞争的时空格局及网络结构演化
|
杨亮洁(1977—),女,甘肃静宁人,博士,副教授。主要研究方向为城市地理、城城市空间重构、城市网络。E-mail:yangljmnx@163.com。 |
收稿日期: 2018-12-17
修回日期: 2019-03-10
网络出版日期: 2025-04-18
基金资助
国家自然科学基金项目(41501176)
国家自然科学基金项目(41661025)
国家自然科学基金项目(41571155)
西北师范大学青年教师科研能力提升计划项目(NWNU-LKQN-14-13)
Network Structure Evolution and the Spatial-Temporal Pattern of China Western Cities Participating in Global and National Competition
Received date: 2018-12-17
Revised date: 2019-03-10
Online published: 2025-04-18
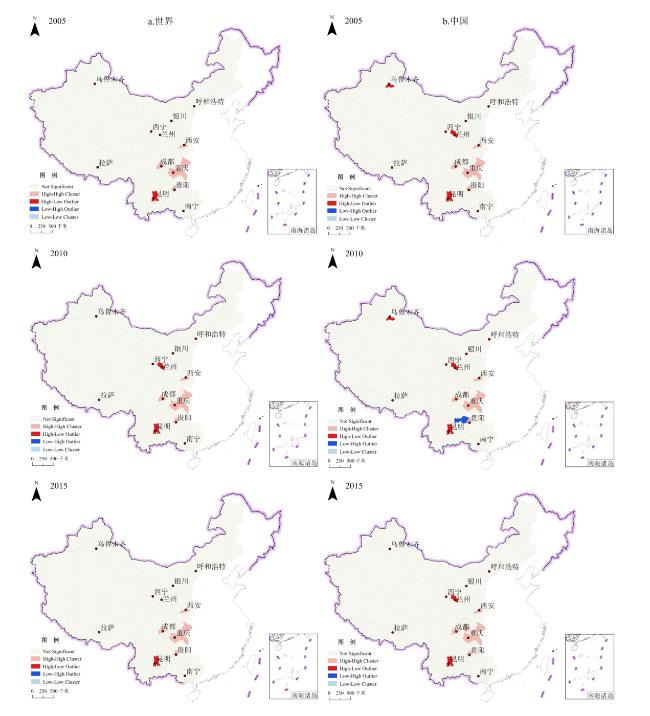
以世界和中国500强企业为样本,应用变异系数、位序—规模法则、空间自相关、社会网络分析等方法分析西部城市参与全球和全国经济竞争的时空格局及网络结构演变。结果表明:①外资和中国企业的空间格局核心—边缘结构明显,成都、重庆和西安是集聚中心。②外资企业集聚趋势明显,核心—边缘结构强化;中国企业集聚趋势减弱,核心—边缘结构弱化。③西部城市外资和中国企业均存在“组织链末端锁定”现象,参与全球和全国竞争的能力均较弱,但参与全球竞争的能力更弱。④两类企业均围绕成都、重庆、西安、贵阳形成高—高集聚区,呈群体式发展,围绕兰州、昆明形成高—低集聚区,呈据点式发展,其余大部分城市空间自相关性极弱,空间极化不明显,中国企业的区位选择对外资企业有明显的示范效应。⑤基于外资企业的城市网络结构趋于复杂化,集聚特征明显;基于中国企业的城市网络发育趋于成熟,分散效应明显增强;成都、重庆、西安是城市网络的核心城市。因此,西部地区应积极培育具有辐射带动力增长极,吸引国内外企业,增强区际联系,提升西部城市参与全球和全国竞争的能力。
杨亮洁 , 杨永春 , 潘竟虎 . 中国西部城市参与全球和全国竞争的时空格局及网络结构演化[J]. 经济地理, 2019 , 39(10) : 43 -53 . DOI: 10.15957/j.cnki.jjdl.2019.10.007
This paper analyzes the spatial-temporal pattern and network structure evolution of China western cities participating in global and national economic competition by the methods of variation coefficient, rank-size rule, spatial auto-correlation and social network analysis. The results show that: 1) The core-edge spatial structure of foreign and Chinese enterprises is obvious. Chengdu, Chongqing and Xi'an are the gathering centers; 2) The tendency of foreign enterprise agglomeration is obvious, and the core-edge structure is strengthened. The tendency of Chinese enterprises agglomeration is weakened, and the core-edge structure is weakened. 3) Both foreign and Chinese enterprises in western cities have the phenomenon of "organizational chain end locking" and their ability to participate in global and national competition is weak, but their ability to participate in global competition is weaker; 4) Both types of enterprises form high-high cluster areas which center around Chengdu, Chongqing, Xi'an and Guiyang, and show a group-type development, while high-low cluster areas around Lanzhou and Kunming show a point-based development, the spatial auto-correlation is weak in the rest of cities and their spatial polarization is not obvious. The location selection of Chinese enterprises has obvious demonstration effect on foreign enterprises; 5) The urban network structure based on foreign enterprises is tending to be complicated and has obvious agglomeration characteristics; The urban networks based on Chinese enterprises are becoming mature and the decentralization effect is obviously enhanced; Chengdu, Chongqing and Xi'an are the core cities of the urban network. Therefore, the western region should actively cultivate radiation-driven growth poles, attract domestic and foreign enterprises, and enhance the competitiveness of western cities.
表1 2005、2010、2015年世界500强和中国500强分支企业变异系数Tab.1 Variation coefficients of the world top 500 and China top 500 enterprises (2005, 2010 and 2015) |
| 2005 | 2010 | 2015 | |
|---|---|---|---|
| 世界500强 | 1.8417 | 3.6757 | 11.4033 |
| 中国500强 | 1.6293 | 1.4761 | 1.4422 |
表2 2005—2015年西部城市企业数量位序—规模参数Tab.2 Rank-size rule parameter based on number of the enterprise in western cities |
| 全行业 | 制造业 | 生产服务业 | 生活服务业 | ||||||||||
|---|---|---|---|---|---|---|---|---|---|---|---|---|---|
| 2005 | 2010 | 2015 | 2005 | 2010 | 2015 | 2005 | 2010 | 2015 | 2005 | 2010 | 2015 | ||
| 世界500强企业 | 常数 | 6.8042 | 7.7345 | 8.699 | 6.7955 | 7.7223 | 8.5560 | 2.9178 | 4.211 | 6.1221 | 2.0241 | 3.7095 | 5.2402 |
| 回归系数 | 1.5424 | 1.4019 | 1.3598 | 1.5342 | 1.5488 | 1.3818 | 1.5000 | 1.9136 | 2.2294 | 1.2585 | 1.6945 | 1.7858 | |
| R平方 | 0.7982 | 0.8566 | 0.8767 | 0.7807 | 0.798 | 0.8435 | 0.9524 | 0.9494 | 0.8987 | 0.9390 | 0.9413 | 0.8369 | |
| P值 | P值均小于0.001,通过0.001水平的显著性检验 | ||||||||||||
| 中国500强企业 | 常数 | 8.7889 | 8.9512 | 9.2674 | 7.6951 | 7.9834 | 9.0088 | 8.3259 | 8.4081 | 9.4114 | 7.1939 | 7.3123 | 7.6158 |
| 回归系数 | 1.1879 | 0.9176 | 0.8720 | 1.2989 | 1.2954 | 1.1494 | 1.2403 | 1.1196 | 0.8854 | 1.5748 | 1.2679 | 1.2099 | |
| R平方 | 0.7756 | 0.8168 | 0.8219 | 0.7135 | 0.7534 | 0.6248 | 0.7546 | 0.7382 | 0.8395 | 0.7943 | 0.7013 | 0.7333 | |
| P值 | P值均小于0.001,通过0.001水平的显著性检验 | ||||||||||||
表3 2005、2010、2015年世界和中国500强企业在中国西部的组织链分支数量表Tab.3 The number of organizational chains of the world’s and China’s top 500 enterprises in western China (2005, 2010 and 2015) |
| 类型/时间(数量) | 总部 | 区域总部 | 科研 | 子公司 | 孙公司 | 办事处(重孙) | 分支总数 | 投资企业数 | |
|---|---|---|---|---|---|---|---|---|---|
| 中国500强 | 2005 | 37(0.19) | 0(0) | 15(0.08) | 56(0.28) | 8 936(45.22) | 10 718(54.24) | 19 762 | 219 |
| 2010 | 33(0.11) | 0(0) | 22(0.08) | 65(0.22) | 12 845(44.07) | 16 185(55.52) | 29 150 | 229 | |
| 2015 | 47(0.07) | 31(0.05) | 57(0.09) | 413(0.65) | 16 871(26.63) | 45 942(72.51) | 63 361 | 268 | |
| 2005 | 0(0) | 1(0.05) | 0(0) | 28(1.47) | 125(6.55) | 1 754(91.93) | 1 908 | 86 | |
| 世界500强 | 2010 | 0(0) | 1(0.03) | 0(0) | 31(0.83) | 339(9.02) | 3 386(90.13) | 3 757 | 116 |
| 2015 | 0(0) | 2(0.02) | 0(0) | 48(0.41) | 964(8.28) | 10 634(91.29) | 11 648 | 163 | |
注:括号中的数字表示占总分支机构数的百分比。 |
表4 2005、2010、2015年世界500强企业在中国西部城市的组织链分支数量表(top10)Tab.4 The number of organizational chains of the world's top 500 enterprises in western China (2005, 2010 and 2015) |
| 年份 | 城市 | 总部 | 区域总部 | 科研 | 子公司 | 孙公司 | 办事处(重孙) | 分支总数 | 投资企业数 |
|---|---|---|---|---|---|---|---|---|---|
| 2005 | 成都 | 0 | 0 | 0 | 2 | 47 | 141 | 190 | 63 |
| 重庆 | 0 | 1 | 0 | 6 | 22 | 146 | 175 | 44 | |
| 西安 | 0 | 0 | 0 | 10 | 17 | 116 | 143 | 45 | |
| 昆明市 | 0 | 0 | 0 | 2 | 4 | 70 | 76 | 34 | |
| 南宁市 | 0 | 0 | 0 | 2 | 5 | 69 | 76 | 28 | |
| 乌鲁木齐市 | 0 | 0 | 0 | 3 | 2 | 50 | 55 | 26 | |
| 贵阳 | 0 | 0 | 0 | 0 | 3 | 47 | 50 | 20 | |
| 兰州 | 0 | 0 | 0 | 1 | 1 | 37 | 39 | 18 | |
| 呼和浩特市 | 0 | 0 | 0 | 0 | 5 | 33 | 38 | 20 | |
| 榆林市 | 0 | 0 | 0 | 0 | 1 | 29 | 30 | 14 | |
| 2010 | 重庆 | 0 | 1 | 0 | 6 | 67 | 294 | 368 | 70 |
| 成都 | 0 | 0 | 0 | 5 | 90 | 265 | 360 | 86 | |
| 西安 | 0 | 0 | 0 | 10 | 38 | 208 | 256 | 62 | |
| 昆明市 | 0 | 0 | 0 | 2 | 15 | 193 | 210 | 43 | |
| 南宁市 | 0 | 0 | 0 | 2 | 10 | 122 | 134 | 34 | |
| 贵阳 | 0 | 0 | 0 | 0 | 7 | 103 | 110 | 29 | |
| 乌鲁木齐市 | 0 | 0 | 0 | 3 | 13 | 85 | 101 | 34 | |
| 兰州 | 0 | 0 | 0 | 1 | 8 | 80 | 89 | 27 | |
| 呼和浩特市 | 0 | 0 | 0 | 0 | 10 | 65 | 75 | 25 | |
| 遵义 | 0 | 0 | 0 | 0 | 3 | 52 | 55 | 17 | |
| 2015 | 成都 | 0 | 0 | 0 | 8 | 69 | 1 148 | 1 225 | 98 |
| 重庆 | 0 | 1 | 0 | 10 | 75 | 996 | 1 082 | 76 | |
| 西安 | 0 | 1 | 0 | 12 | 53 | 750 | 816 | 66 | |
| 昆明市 | 0 | 0 | 0 | 7 | 56 | 483 | 546 | 61 | |
| 南宁市 | 0 | 0 | 0 | 2 | 44 | 310 | 356 | 46 | |
| 贵阳 | 0 | 0 | 0 | 1 | 36 | 263 | 300 | 42 | |
| 乌鲁木齐市 | 0 | 0 | 0 | 1 | 37 | 241 | 279 | 54 | |
| 呼和浩特市 | 0 | 0 | 0 | 0 | 26 | 223 | 249 | 47 | |
| 兰州 | 0 | 0 | 0 | 2 | 29 | 216 | 247 | 48 | |
| 咸阳市 | 0 | 0 | 0 | 0 | 1 | 220 | 221 | 27 |
注:鉴于篇幅限制,文中表格只呈现前十位城市。下同。 |
表5 2005、2010、2015年中国500强企业在中国西部城市的组织链分支数量表(top12)Tab.5 The number of organizational chains of China’s top 500 companies in western China in 2005, 2010 and 2015 |
| 年份 | 城市 | 总部 | 区域总部 | 科研 | 子公司 | 孙公司 | 销售机构等(重孙) | 分支总数 | 投资企业数 |
|---|---|---|---|---|---|---|---|---|---|
| 2005 | 重庆 | 4 | 0 | 2 | 11 | 635 | 1 059 | 1 711 | 114 |
| 成都 | 3 | 0 | 7 | 1 | 596 | 962 | 1 569 | 114 | |
| 西安 | 1 | 0 | 1 | 3 | 375 | 719 | 1 099 | 114 | |
| 昆明市 | 2 | 0 | 0 | 2 | 382 | 550 | 936 | 106 | |
| 南宁市 | 1 | 0 | 0 | 0 | 276 | 455 | 732 | 93 | |
| 兰州 | 0 | 0 | 1 | 2 | 272 | 364 | 639 | 88 | |
| 乌鲁木齐市 | 4 | 0 | 1 | 5 | 226 | 301 | 537 | 93 | |
| 贵阳 | 1 | 0 | 0 | 10 | 240 | 268 | 519 | 84 | |
| 呼和浩特市 | 3 | 0 | 0 | 4 | 151 | 241 | 399 | 82 | |
| 柳州市 | 2 | 0 | 0 | 10 | 133 | 214 | 359 | 61 | |
| 2010 | 重庆 | 6 | 0 | 2 | 13 | 951 | 1 288 | 2 260 | 121 |
| 成都 | 3 | 0 | 7 | 1 | 840 | 1 304 | 2 155 | 122 | |
| 西安 | 3 | 0 | 3 | 5 | 520 | 960 | 1 491 | 122 | |
| 昆明市 | 2 | 0 | 0 | 0 | 490 | 783 | 1 275 | 109 | |
| 南宁市 | 1 | 0 | 0 | 0 | 380 | 604 | 985 | 96 | |
| 兰州 | 0 | 0 | 2 | 1 | 334 | 470 | 807 | 92 | |
| 乌鲁木齐市 | 4 | 0 | 2 | 7 | 309 | 400 | 722 | 97 | |
| 贵阳 | 1 | 0 | 0 | 11 | 326 | 375 | 713 | 85 | |
| 呼和浩特市 | 3 | 0 | 0 | 0 | 177 | 361 | 541 | 78 | |
| 柳州市 | 2 | 0 | 0 | 10 | 161 | 338 | 511 | 66 | |
| 2015 | 重庆 | 9 | 7 | 2 | 33 | 1 150 | 4 696 | 5 897 | 173 |
| 成都 | 6 | 9 | 16 | 40 | 1 002 | 3 100 | 4 173 | 186 | |
| 西安 | 3 | 10 | 13 | 40 | 677 | 2 187 | 2 930 | 175 | |
| 昆明市 | 3 | 0 | 1 | 18 | 607 | 1 481 | 2 110 | 153 | |
| 南宁市 | 2 | 0 | 1 | 9 | 455 | 1 291 | 1 758 | 145 | |
| 兰州 | 0 | 0 | 4 | 13 | 414 | 910 | 1 341 | 134 | |
| 乌鲁木齐市 | 4 | 2 | 3 | 23 | 362 | 835 | 1 229 | 142 | |
| 贵阳 | 2 | 0 | 1 | 15 | 398 | 813 | 1 229 | 130 | |
| 柳州市 | 2 | 0 | 0 | 20 | 213 | 781 | 1 016 | 94 | |
| 呼和浩特市 | 3 | 1 | 1 | 16 | 246 | 708 | 975 | 120 |
表6 世界500强和中国500强企业相异性指数Tab.6 Dissimilarity indexes of the world top 500 and China top 500 companies in western China |
| 世界500强和中国500强企业不同时间相异性指数 | 世界 | 中国 | |||||||
| 2005/2010 | 2005/2015 | 2010/2015 | 2005/2010 | 2005/2015 | 2010/2015 | ||||
| 0.08 | 0.1 | 0.09 | 0.05 | 0.1 | 0.08 | ||||
| 世界500强/中国500强相异性指数 | 同时间 | 不同时间 | |||||||
| 2005 | 2010 | 2015 | 2005/2010 | 2005/2015 | 2010/2005 | 2010/2015 | 2015/2005 | 2015/2010 | |
| 0.13 | 0.13 | 0.14 | 0.14 | 0.15 | 0.12 | 0.15 | 0.11 | 0.12 | |
表7 2005、2010、2015年中国西部企业分布的Moran’s ITab.7 Moran’s Iindex of enterprise distribution in western China in 2005, 2010 and 2015 |
| 2005 | 2010 | 2015 | ||
|---|---|---|---|---|
| 世界500强 | Moran’s I指数 | 0.033862* | 0.032166* | 0.030914* |
| 预期指数 | -0.007692 | -0.007692 | -0.007692 | |
| 方差 | 0.000481 | 0.000480 | 0.000474 | |
| z得分 | 1.895116 | 1.819260 | 1.772392 | |
| p值: | 0.058077 | 0.055752 | 0.076329 | |
| 中国500强 | Moran’s I指数 | 0.047758** | 0.043291** | 0.057572** |
| 预期指数 | -0.007692 | -0.007692 | -0.007692 | |
| 方差 | 0.000569 | 0.000567 | 0.000568 | |
| z得分 | 2.325552 | 2.141971 | 2.738249 | |
| p值: | 0.020042 | 0.032196 | 0.006177 |
注:*表示显著水平为0.1,**表示显著水平为0.05,***表示显著水平为0.01。 |
表8 2005、2010、2015年世界500强企业城市网络中心度(top10)Tab.8 Degree centrality of urban network in western China in 2005, 2010 and 2015 |
| 2005 | 2010 | 2015 | |||||||||||
|---|---|---|---|---|---|---|---|---|---|---|---|---|---|
| 城市 | 绝对中心度 | 相对中心度 | 比例 | 城市 | 绝对中心度 | 相对中心度 | 比例 | 城市 | 绝对中心度 | 相对中心度 | 比例 | ||
| 世 界 500 强 企 业 | 重庆 | 566 | 5.964 | 0.202 | 成都 | 3 135 | 5.209 | 0.157 | 重庆 | 210 044 | 11.352 | 0.182 | |
| 成都 | 341 | 3.593 | 0.122 | 重庆 | 2 460 | 4.087 | 0.123 | 成都 | 160 392 | 8.668 | 0.139 | ||
| 西安 | 291 | 3.066 | 0.104 | 乌鲁木齐 | 1 489 | 2.474 | 0.075 | 西安 | 75 677 | 4.090 | 0.066 | ||
| 南宁 | 198 | 2.086 | 0.071 | 西安 | 917 | 1.524 | 0.046 | 昆明 | 40 682 | 2.199 | 0.035 | ||
| 昆明 | 159 | 1.675 | 0.057 | 自贡 | 657 | 1.092 | 0.033 | 贵阳 | 34 245 | 1.851 | 0.030 | ||
| 乌鲁木齐 | 101 | 1.064 | 0.036 | 昆明 | 546 | 0.907 | 0.027 | 乌鲁木齐 | 29 178 | 1.577 | 0.025 | ||
| 眉山 | 96 | 1.012 | 0.034 | 安顺 | 512 | 0.851 | 0.026 | 南宁 | 28 785 | 1.556 | 0.025 | ||
| 迪庆 | 96 | 1.012 | 0.034 | 遵义 | 485 | 0.806 | 0.024 | 包头 | 25 054 | 1.354 | 0.022 | ||
| 兰州 | 87 | 0.917 | 0.031 | 南宁 | 450 | 0.748 | 0.023 | 赤峰 | 24 284 | 1.312 | 0.021 | ||
| 贵阳 | 77 | 0.811 | 0.027 | 兰州 | 445 | 0.739 | 0.022 | 榆林 | 18 798 | 1.016 | 0.016 | ||
| 密度 | 0.03 | 0.13 | 0.34 | ||||||||||
| 中心势/% | 5.83 | 5.03 | 11.04 | ||||||||||
| 中 国 500 强 企 业 | 成都 | 247 174 | 7.126 | 0.189 | 重庆 | 182 505 | 8.164 | 0.116 | 重庆 | 1 583 742 | 10.462 | 0.124 | |
| 重庆 | 238 159 | 6.866 | 0.182 | 成都 | 173 981 | 7.783 | 0.111 | 成都 | 915 738 | 6.049 | 0.072 | ||
| 西安 | 110 807 | 3.159 | 0.085 | 西安 | 97 798 | 4.375 | 0.062 | 西安 | 573 973 | 3.792 | 0.045 | ||
| 昆明 | 42 416 | 1.223 | 0.032 | 昆明 | 81 766 | 3.658 | 0.052 | 昆明 | 365 731 | 2.416 | 0.029 | ||
| 兰州 | 31 355 | 0.904 | 0.024 | 兰州 | 55 961 | 2.503 | 0.036 | 南宁 | 316 944 | 2.049 | 0.025 | ||
| 呼和浩特 | 29 072 | 0.838 | 0.022 | 呼和浩特 | 46 145 | 2.064 | 0.029 | 乌鲁木齐 | 299 888 | 1.981 | 0.024 | ||
| 乌鲁木齐 | 28 118 | 0.811 | 0.021 | 乌鲁木齐 | 43 171 | 1.931 | 0.028 | 兰州 | 248 655 | 1.643 | 0.020 | ||
| 南宁 | 25 244 | 0.728 | 0.019 | 南宁 | 35 262 | 1.577 | 0.023 | 渭南 | 228 126 | 1.507 | 0.018 | ||
| 贵阳 | 24 257 | 0.699 | 0.019 | 贵阳 | 33 722 | 1.508 | 0.022 | 贵阳 | 195 209 | 1.290 | 0.015 | ||
| 咸阳 | 19 402 | 0.559 | 0.015 | 咸阳 | 29 286 | 1.310 | 0.019 | 柳州 | 160 975 | 1.063 | 0.013 | ||
| 密度 | 0.38 | 0.80 | 1.00 | ||||||||||
| 中心势/% | 6.94% | 7.75 | 9.97 | ||||||||||
| [1] |
冷炳荣, 杨永春, 李英杰, 等. 中国城市经济网络结构空间特征及其复杂性分析[J]. 地理学报, 2011, 66(2):199-211.
|
| [2] |
张杰, 唐根年. 浙江省制造业空间分异格局及其影响因素[J]. 地理科学, 2018, 38(7):1 107-1 117.
|
| [3] |
韩会然, 杨成凤, 宋金平. 北京批发企业空间格局演化与区位选择因素[J]. 地理学报, 2018, 73(2):219-231.
|
| [4] |
史育龙. 培育区域协同增长极塑造协调发展新格局——“十三五”时期中国区域发展趋势展望[J]. 建筑设计管理, 2016, 33(3):5-7.
|
| [5] |
约翰·冯·杜能. 孤立国同农业和国民经济的关系[M]. 吴衡康,译. 北京: 商务印书馆, 1986.
|
| [6] |
阿尔弗雷德·韦伯. 工业区位论[M]. 李刚剑,陈志人,张英保,译. 北京: 商务印书馆, 2010.
|
| [7] |
奥古斯特·勒施. 经济空间秩序[M]. 王守礼,译. 北京: 商务印书馆, 2010.
|
| [8] |
|
| [9] |
|
| [10] |
|
| [11] |
Henry Wai-chung Yeung,
|
| [12] |
|
| [13] |
李涛, 张伊娜. 2000—2010 年长三角地区参与全球劳动分工的时空演化格局[J]. 城市发展研究, 2016, 23(3):49-56.
|
| [14] |
唐子来, 赵渺希. 长三角地区的经济全球化进程的时空演化格局[J]. 城市规划学刊, 2009(1):38-45.
|
| [15] |
宋周莺, 刘卫东. 中国工业中小企业省区分布及其影响因素[J], 地理研究, 2013, 32(12):2 233-2 243.
|
| [16] |
毕秀晶, 李仙德. 上海现代服务业外资企业空间格局及其机理研究[J]. 城市规划学刊, 2010(1):64-70.
|
| [17] |
陈长瑶, 杨青山, 赵瀚, 等. 资源型城市制造业企业空间分布研究——基于吉林通化医药制造业企业的分析[J]. 经济地理, 2017, 37(7):131-138.
|
| [18] |
高金龙, 袁丰, 陈雯. 转型期城市制造业空间重构过程与机理——以南京市为例[J]. 地理研究, 2017, 36(6):1 014-1 028.
|
| [19] |
李建新, 杨永春, 蒋小荣, 等. 中国制造业产业结构高级度的时空格局与影响因素[J]. 地理研究, 2018, 37(8):1 558-1 574.
|
| [20] |
梁双波, 曹有挥, 吴威. 上海大都市区港口物流企业的空间格局演化[J]. 地理研究, 2013, 32(8):1 448-1 456.
|
| [21] |
朱慧, 周根贵. 国际陆港物流企业空间格局演化及其影响因素——以义乌市为例[J]. 经济地理, 2017, 37(2):98-105.
|
| [22] |
蒋天颖, 伍婵提, 陈改改. 浙江省A级物流企业时空格局特征研究[J]. 地理科学, 2017, 37(11):1 720-1 727.
|
| [23] |
王瑞, 蒋天颖, 王帅. 宁波市港口物流企业空间格局及区位选择[J]. 地理科学, 2018, 38(5):691-698.
|
| [24] |
王丹, 方斌, 陈正富. 基于社区尺度的互联网企业空间格局与演化——以扬州市区为例[J]. 经济地理, 2018, 38(6):133-141.
|
| [25] |
石敏俊, 杨晶, 龙文, 等. 中国制造业分布的地理变迁与驱动因素[J]. 地理研究, 2013, 32(9):1 708-1 720.
|
| [26] |
陈延斌. 山东省外资企业空间格局演变及城市网络体系变化[D]. 长春: 东北师范大学, 2013.
|
| [27] |
|
| [28] |
|
| [29] |
刘军. 整体网分析讲义[M]. 上海: 格致出版社, 2011.
|
/
| 〈 |
|
〉 |

