
西北地区旅游经济与交通业共生发展
|
马国强(1982—),男,甘肃兰州人,博士,国家注册城乡规划师。主要研究方向为旅游经济、旅游地理与旅游规划。E-mail:mgq@lzu.edu.cn。 |
收稿日期: 2018-10-27
修回日期: 2019-03-18
网络出版日期: 2025-04-18
基金资助
甘肃省如何融入“一带一路”研究项目(LDBR2018-013)
甘肃省社会科学规划项目(YB003)
The Symbiotic Development of Tourism Economy and Transportation Industry in Northwest China
Received date: 2018-10-27
Revised date: 2019-03-18
Online published: 2025-04-18
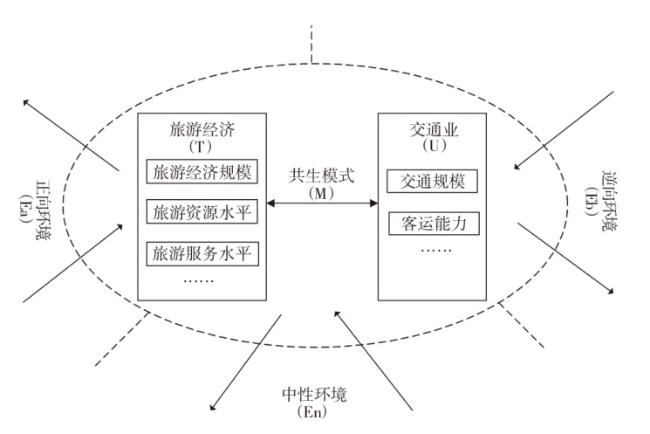
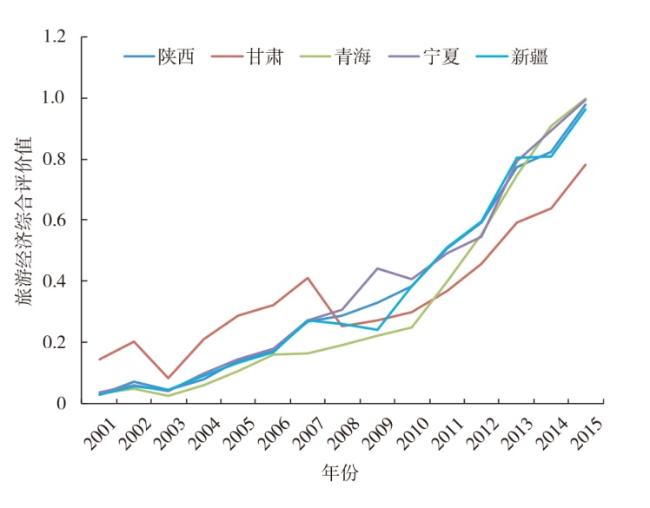
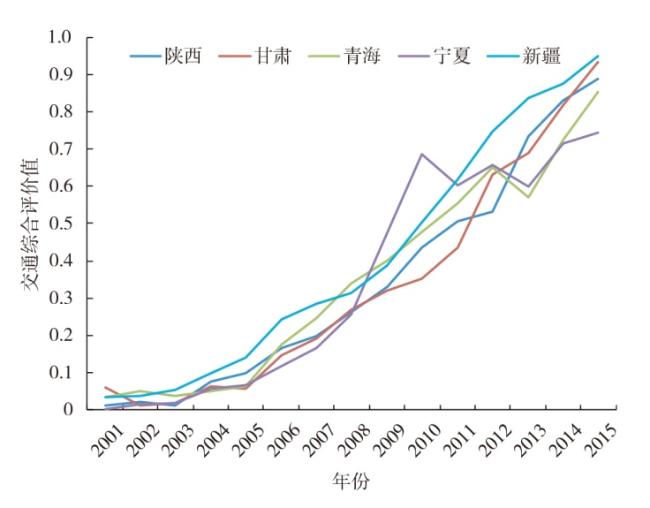
以共生理论为指导,在西北五省(区)旅游经济和交通业发展水平综合评价的基础上,通过2001—2015年共生单元间共生度和共生系数的对比分析,对各省(区)旅游经济和交通业之间的共生发展进行了实证研究。结果显示:①西北地区及各省旅游经济和交通业综合发展水平指数呈稳步上升趋势。②5A、4A级景区和民用航空所占权重较高,分别对旅游经济和交通业起重要支撑作用。③从共生度来看,2002—2015年,陕西、青海、新疆表现为正向非对称共生关系,宁夏为近似正向对称关系,甘肃为寄生关系。④从共生系数来看,陕西、甘肃、青海、宁夏在0.5~1.0之间,表明旅游经济的影响较大,旅游经济发展驱动交通业的发展;而新疆在0~0.5之间,表明交通业影响较大,交通业发展先于旅游经济,对旅游经济发展支撑作用明显。
马国强 , 汪慧玲 , 许倩 . 西北地区旅游经济与交通业共生发展[J]. 经济地理, 2019 , 39(10) : 223 -230 . DOI: 10.15957/j.cnki.jjdl.2019.10.027
Since the Western Development Program, the tourism economy and transportation industry in Northwest China have influenced and promoted each other, forming a "Symbiotic Symbiosis" development pattern. This paper makes a comprehensive evaluation of the development level of tourism and transportation in the five provinces (autonomous regions) in Northwest China under the guidance of symbiosis theory, and makes an empirical study on the symbiotic development between tourism economy and transportation industry in each province (autonomous region) through the comparative analysis of symbiotic degree and Coexistence coefficientbetween symbiotic units from 2001 to 2015.The results show that: 1) The comprehensive development level index of tourism economy and transportation industry in Northwest China and the provinces (autonomous regions) have been steadily rising. 2)The Class 5A and 4A scenic spots and civil aviation occupy a higher weight, which play an important role in supporting tourism economy and transportation industry.3) From the degree of symbiosis, between 2002 and 2015, Shaanxi, Qinghai and Xinjiang showed Positive Asymmetric Symbiosis Relationship(PASR), Ningxia was close to PASR, and Gansu was Parasitic Relationship(PR). 4) From the coexistence coefficient, Shaanxi, Gansu, Qinghai and Ningxia are between 0.5 and 1, which indicates that the tourism economy has a greater impact, and the development of tourism economy drives the development of transportation industry; Xinjiang is between 0 and 0.5, which indicates that the transportation industry has a greater impact, indicating that the development of transportation industry is prior to tourism.
表1 旅游经济与交通业发展评价指标体系与权重Tab.1 Evaluation index system and weight of tourism economy and transportation industry development |
| 目标 | 指标 | 陕西 | 甘肃 | 青海 | 宁夏 | 新疆 | |
|---|---|---|---|---|---|---|---|
| 旅游经济 | 旅游经济规模 | 国内旅游人次 | 0.1465 | 0.1632 | 0.0870 | 0.1273 | 0.1012 |
| 国内旅游收入 | 0.1586 | 0.1554 | 0.1408 | 0.1481 | 0.1370 | ||
| 入境旅游人次 | 0.0884 | 0.1168 | 0.0307 | 0.0966 | 0.1156 | ||
| 入境旅游收入 | 0.0894 | 0.1081 | 0.0581 | 0.1487 | 0.1082 | ||
| 旅游总收入占GDP的比例 | 0.0711 | 0.0897 | 0.0393 | 0.0551 | 0.0838 | ||
| 旅游资源水平 | 5A级景区数量 | 0.1511 | 0.1320 | 0.2509 | 0.1507 | 0.1493 | |
| 4A级景区数量 | 0.1104 | 0.0904 | 0.1044 | 0.1177 | 0.1699 | ||
| 其他A级景区数量 | 0.0921 | 0.0717 | 0.2061 | 0.0473 | 0.0618 | ||
| 旅游服务水平 | 星级酒店数量 | 0.0361 | 0.0404 | 0.0430 | 0.0730 | 0.0419 | |
| 旅行社数量 | 0.0563 | 0.0322 | 0.0398 | 0.0355 | 0.0313 | ||
| 交通业 | 交通规模 | 公路里程 | 0.0782 | 0.0846 | 0.0811 | 0.0734 | 0.1004 |
| 铁路营运里程 | 0.1049 | 0.1852 | 0.0928 | 0.1801 | 0.2527 | ||
| 民用航空航线里程 | 0.3451 | 0.2381 | 0.1393 | 0.1133 | 0.0702 | ||
| 客运能力 | 公路客运量 | 0.0979 | 0.0965 | 0.1289 | 0.0951 | 0.0707 | |
| 铁路客运量 | 0.0661 | 0.0646 | 0.1351 | 0.0799 | 0.1206 | ||
| 民用航空客运量 | 0.1192 | 0.1185 | 0.1201 | 0.1998 | 0.1091 | ||
| 公路旅客周转量 | 0.0867 | 0.0767 | 0.0915 | 0.0751 | 0.0616 | ||
| 铁路旅客周转量 | 0.0577 | 0.0659 | 0.0840 | 0.0821 | 0.1174 | ||
| 航空旅客周转量 | 0.0443 | 0.0700 | 0.1272 | 0.1012 | 0.0973 | ||
表2 旅游经济与交通发展共生度分析Tab.2 Analysis of the symbiosis between tourism economy and traffic development |
| 年份 | 陕西 | 甘肃 | 青海 | 宁夏 | 新疆 | |||||||||
|---|---|---|---|---|---|---|---|---|---|---|---|---|---|---|
| 2002 | 4.7448 | 0.2108 | -1.1505 | -0.8692 | 1.1860 | 0.8431 | 1.7383 | 0.5753 | 80.3875 | 0.0124 | ||||
| 2003 | 2.5044 | 0.3993 | -16.4441 | -0.0608 | 2.2567 | 0.4431 | -9.1162 | -0.1097 | -0.6958 | -1.4372 | ||||
| 2004 | 0.5305 | 1.8849 | 2.8068 | 0.3563 | 2.7897 | 0.3585 | 1.4258 | 0.7014 | 1.0857 | 0.9210 | ||||
| 2005 | 2.6234 | 0.3812 | -12.9520 | -0.0772 | 3.3661 | 0.2971 | 5.2498 | 0.1905 | 1.0035 | 0.9965 | ||||
| 2006 | 0.4875 | 2.0512 | 0.3790 | 2.6384 | 0.4862 | 2.0569 | 0.6535 | 1.5302 | 0.3155 | 3.1693 | ||||
| 2007 | 2.8864 | 0.3465 | 1.9597 | 0.5103 | 0.0419 | 23.8751 | 1.9094 | 0.5237 | 2.5377 | 0.3941 | ||||
| 2008 | 0.3012 | 3.3199 | -2.0492 | -0.4880 | 0.2907 | 3.4402 | 0.3580 | 2.7930 | -0.4017 | -2.4897 | ||||
| 2009 | 0.6221 | 1.6075 | 0.3656 | 2.7356 | 0.5435 | 1.8401 | 0.6256 | 1.5984 | -0.2393 | -4.1782 | ||||
| 2010 | 0.5328 | 1.8770 | 0.8630 | 1.1588 | 0.3230 | 3.0961 | -0.1663 | -6.0139 | 1.2205 | 0.8194 | ||||
| 2011 | 1.7382 | 0.5753 | 0.8073 | 1.2387 | 1.9758 | 0.5061 | -0.9955 | -1.0046 | 1.1200 | 0.8928 | ||||
| 2012 | 3.3227 | 0.3010 | 0.4486 | 2.2290 | 1.6238 | 0.6158 | 1.0360 | 0.9653 | 0.6423 | 1.5568 | ||||
| 2013 | 0.8832 | 1.1322 | 2.3984 | 0.4169 | -2.3985 | -0.4169 | -4.3133 | -0.2318 | 2.3211 | 0.4308 | ||||
| 2014 | 0.5161 | 1.9376 | 0.3328 | 3.0051 | 1.0512 | 0.9513 | 0.8341 | 1.1989 | 0.0528 | 18.9365 | ||||
| 2015 | 2.6866 | 0.3722 | 1.2584 | 0.7946 | 0.6861 | 1.4576 | 3.6678 | 0.2726 | 2.1170 | 0.4724 | ||||
| 均值 | 1.7414 | 1.1712 | -1.4983 | 0.9706 | 1.0159 | 2.8117 | 0.2077 | 0.2135 | 6.5333 | 1.4641 | ||||
表3 旅游经济与交通发展共生系数分析Tab.3 Analysis of the symbiotic coefficient of tourism economy and traffic development |
| 年份 | 陕西 | 甘肃 | 青海 | 宁夏 | 新疆 | |||||||||
|---|---|---|---|---|---|---|---|---|---|---|---|---|---|---|
| 2002 | 0.9575 | 0.0425 | 0.5697 | 0.4303 | 0.5845 | 0.4155 | 0.7514 | 0.2486 | 0.9998 | 0.0002 | ||||
| 2003 | 0.8625 | 0.1375 | 0.9963 | 0.0037 | 0.8359 | 0.1641 | 0.9881 | 0.0119 | 0.3262 | 0.6738 | ||||
| 2004 | 0.2196 | 0.7804 | 0.8874 | 0.1126 | 0.8861 | 0.1139 | 0.6703 | 0.3297 | 0.5410 | 0.4590 | ||||
| 2005 | 0.8731 | 0.1269 | 0.9941 | 0.0059 | 0.9189 | 0.0811 | 0.9650 | 0.0350 | 0.5018 | 0.4982 | ||||
| 2006 | 0.1920 | 0.8080 | 0.1256 | 0.8744 | 0.1912 | 0.8088 | 0.2993 | 0.7007 | 0.0905 | 0.9095 | ||||
| 2007 | 0.8928 | 0.1072 | 0.7934 | 0.2066 | 0.0018 | 0.9982 | 0.7848 | 0.2152 | 0.8656 | 0.1344 | ||||
| 2008 | 0.0832 | 0.9168 | 0.8077 | 0.1923 | 0.0779 | 0.9221 | 0.1136 | 0.8864 | 0.1389 | 0.8611 | ||||
| 2009 | 0.2790 | 0.7210 | 0.1179 | 0.8821 | 0.2280 | 0.7720 | 0.2813 | 0.7187 | 0.0542 | 0.9458 | ||||
| 2010 | 0.2211 | 0.7789 | 0.4269 | 0.5731 | 0.0945 | 0.9055 | 0.0269 | 0.9731 | 0.5983 | 0.4017 | ||||
| 2011 | 0.7513 | 0.2487 | 0.3946 | 0.6054 | 0.7961 | 0.2039 | 0.4977 | 0.5023 | 0.5564 | 0.4436 | ||||
| 2012 | 0.9169 | 0.0831 | 0.1675 | 0.8325 | 0.7250 | 0.2750 | 0.5177 | 0.4823 | 0.2921 | 0.7079 | ||||
| 2013 | 0.4382 | 0.5618 | 0.8519 | 0.1481 | 0.8519 | 0.1481 | 0.9490 | 0.0510 | 0.8434 | 0.1566 | ||||
| 2014 | 0.2103 | 0.7897 | 0.0997 | 0.9003 | 0.5249 | 0.4751 | 0.4103 | 0.5897 | 0.0028 | 0.9972 | ||||
| 2015 | 0.8783 | 0.1217 | 0.6129 | 0.3871 | 0.3200 | 0.6800 | 0.9308 | 0.0692 | 0.8176 | 0.1824 | ||||
| 均值 | 0.5554 | 0.4446 | 0.5604 | 0.4396 | 0.5026 | 0.4974 | 0.5847 | 0.4153 | 0.4735 | 0.5265 | ||||
| [1] |
|
| [2] |
|
| [3] |
|
| [4] |
|
| [5] |
张广海, 赵金金. 我国交通基础设施对区域旅游经济发展影响的空间计量研究[J]. 经济管理, 2015, 535(7):116-126.
|
| [6] |
王兆峰. 入境旅游流与航空运输网络协同演化及差异分析——以西南地区为例[J]. 地理研究, 2012, 31(7):1 328-1 338.
|
| [7] |
王兆峰, 徐赛. 不同交通方式对旅游效率的影响与评价——以张家界为例[J]. 地理科学, 2018, 38(7):1 148-1 155.
|
| [8] |
王新越, 赵文丽. 我国高铁通达性与区域旅游经济耦合关系及空间特征分析[J]. 中国海洋大学学报(社会科学版), 2017, 1:77-83.
|
| [9] |
王娟, 刘赛. 长江中游城市群综合交通与旅游经济协调发展研究[J]. 经济问题, 2018(8):111-118.
|
| [10] |
马勇, 李丽霞, 任洁. 神农架林区旅游经济—交通状况—生态环境协调发展研究[J]. 经济地理, 2017, 37(10):215-227.
|
| [11] |
余菲菲, 胡文海, 荣慧芳. 中小城市旅游经济与交通耦合协调发展研究——以池州市为例[J]. 地理科学, 2015, 35(9):1 116-1 122.
|
| [12] |
陈新哲, 熊黑钢. 新疆交通与旅游协调发展的定量评价及时许分析[J]. 地域研究与开发, 2009, 28(6):118-121.
|
| [13] |
刘安乐, 王成, 杨承玥, 等. 边疆山区旅游城市的交通与旅游发展耦合关系——以丽江市为实证案例[J]. 经济地理, 2018, 38(1):196-203.
|
| [14] |
李如友, 黄常州. 中国交通基础设施对区域旅游发展的影响研究——基于门槛回归模型的证据[J]. 旅游科学, 2015, 29(2):1-13,27.
|
| [15] |
侯志强. 交通基础设施对区域旅游经济增长效应的实证分析——基于中国省域面板数据的空间计量模型[J]. 宏观经济研究, 2018(6):118-132.
|
| [16] |
袁纯清. 共生理论——兼论小型经济[M]. 天津: 经济科学出版社, 1998:1-30.
|
| [17] |
胡晓鹏. 产业共生:理论界定及其内在机理[J]. 中国工业经济, 2008, 246(9):118-128.
|
| [18] |
保继刚, 楚义芳. 旅游地理学(修订版)[M]. 北京: 高等教育出版社, 1999.
|
| [19] |
胡浩, 王娇娥, 金凤君. 基于可达性的中小文化旅游市场潜力分析[J]. 地理科学进展, 2012, 31(6):808-816.
|
| [20] |
毕丽芳, 马耀峰, 苏醒. 西北地区旅游规模差异及其位序规模分布[J]. 干旱区资源与环境, 2013, 27(8):196-200.
|
| [21] |
徐秀美, 平措卓玛, 胡淑卉. 雅鲁藏布大峡谷国家公园生态旅游经济系统健康水平测评——基于信息熵的视角[J]. 生态经济, 2017, 33(10):139-144.
|
| [22] |
李慧, 王春峰, 李博, 等. 我国省际体育文化旅游节事资源支撑能力评价[J]. 统计与决策, 2018(15):111-116.
|
/
| 〈 |
|
〉 |